1Geology Department, Yangon University, Yangon, Myanmar
2Geological Engineering Department, Faculty of Engineering, Gadjah Mada University, Yogyakarta, Indonesia 2Civil and Environmental Engineering Department, Faculty of Engineering, Gadjah Mada University, Yogyakarta,
Indonesia
4Department of Urban Management, Graduate School of Engineering, Kyoto University, Katsura Campus, Nishikyo,
Kyoto, Japan
Abstract
Microtremor is currently considered the foremost tool in site effect studies. The ground motion is estimated with microtremor observations, meaning that subsoil mechanical properties and geometry are evaluated and from them an estimate of local ampli-fication is computed. Here, the ground motion is studied by the site effects of seismic hazard zona-tion of urban areas in Yogyakarta City. The main purpose of this paper is zoning the geological en-gineering features and assessing seismic of the re-search urban area. In this regard, the microtremors are measured at 274 sites by single station sampling method and Nakamura technique. The microtremors of all over the city are processed by a model of Mitutoyo-GPL-6A3P. The amplification factor gen-erally ranges between 0.70 and 5.56 and the natu-ral frequency normally varies between 0.40 and 3.30 Hz. The information layers are prepared in GMT used for detecting the zonation of potential seismic hazard. The shear wave velocity is calculated in 12 existing drilling sites based on the geotechnical approach of SPT for soil condition. To study the
∗Corresponding author: Z. L. KYAW, Department of Geological Engineering, Faculty of Engineering, Gadjah Mada University, Jl. Grafika 2 Yogyakarta, 55281, Indone-sia. E-mail: zlkyaw.geol@gmail.com.
ground motion, geological engineering condition is investigated using amplification factor, natural fre-quency, shear wave velocity maps which are ana-lyzed using densely single microtremor observation and SPT from existing drilling sites.
Keywords: Ground motion, amplification factors, natural frequency; H/V spectral ratio, microtremor observations, Yogyakarta Urban.
1 Introduction
oc-curred near Yogyakarta city on May 27th, 2006 at 5:54 am local time. The earthquake di-rectly affected the provinces of Yogyakarta and Central Java Island. This earthquake caused nearly 6,500 fatalities and above 36,000 injured. More than 135,000 houses were damaged, and 600,000 people were homeless. In this study, the densely single microtremor observation5s are carried out in the eastern part of Yogyakarta City plain and the estimation of ground motion characteristics based on the H/V spectrum and S-wave velocity. It is clearly noticed that the amplification factors and the natural frequency required for the microtremor has effective sed-iment thickness with soil condition of S-wave velocity.
2 Geological condition
The geology around Yogyakarta City is con-trolled by active plate tectonic phenomena such as the active volcano and active subduction of Indian-Australia oceanic plate below the Eura-sia continental plate. To the west, there is a dome of andesitic breccia and lava flows with intensive fault formation. Whereas at the eastern part, steep mountains of carbonaceous-volcanic rocks as well as limestone with karst landscape are exposed. The major structure is the north-east trending normal fault and well-known Opak fault which defines the eastern limit of a trough extending from Yogyakarta to the coast. The Quaternary succession is domi-nated by volcanic deposits, largely attributable to Merapi volcano. Other important deposits such as litoral clay deposits in the vicinity of Wates, minor valley and terrace alluvium in the main river valleys, deflation materials on limestone and sand dunes adjacent to the coast have also been encountered. The Yogyakarta unit forms the surface outcrop throughout the lowland area of Yogyakarta Basin from Merapi Middle Slope to the coast. The unit consists of an interbedded sequence of sand, gravels, silts and clay. The amount of clay increases south-ward. However, the layers of coarse materials have been encountered throughout the basin. Thickness of this unit is variable and up to 45
m in some places. This unit lies unconformable upon the Sleman unit.
3 Past earthquake events
Earthquakes occur almost continuously around the world. Fortunately, most are so small that they cannot be felt. Only a very small per-centage of earthquakes are large enough to cause noticeable damage and small percentage of those are large enough to be considered ma-jor earthquakes. Throughout recorded history, some of these major earthquakes can be re-garded as being particularly significant, either because of their size and the damage they pro-duced or because of what scientists and engi-neers were able to learn from them.
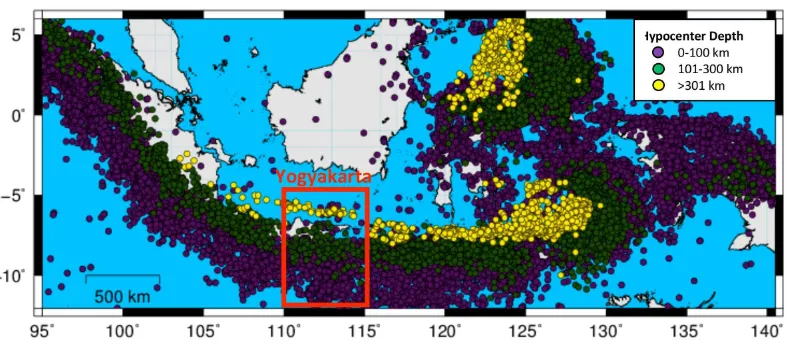
The Java trench region shows low seismic-ity compared with the Sumatra subduction zone region but the destructive earthquakes occurred in the past and some of them have generated tsunami. The historical earthquakes record in this area can be generally divided as pre-historical period up to about 1840 with the epicentre locations and magnitudes based largely upon felt reports, and an instrumen-tal period which refers to USGS (NEIC) and ANSS earthquake catalogues. According to the historical and instrumental records, most of the earthquakes which affected the Yogyakarta special province mostly occurred within the radius of 200 km.
Figure 1: Historical Seismicity in Indonesia (Mw>4.0 and 1840–2013).
4 Microtremor and existing drilling sites
The earth surface is always in motion at differ-ent frequencies; even in the absence of active seismic sources. The damages caused by the recent earthquake are concluded as a direct re-sult of local geological conditions affecting the ground motion. These constant vibrations are called microseisms or preferably microtremors. The amplitude of these microtremors is gen-erally too small (10-4-10-2 mm) to be felt by human senses. Microtremors are considered as noise sources in seismological studies. Mi-crotremor is a very convenient tool to estimate the effect of surface geology on seismic motion without other geological information. More-over the single microtremor observation meth-ods have been developed as a simple and cost effective method to determine the characteris-tics of the ground properties (Nakamura, 1989; Tokimatsu et al., 1994).
In today practice, to provide a good cover-age of the study area, the measurement sites are designed with a grid spacing of 500 meters to the main path of the north-south and east-west of the research area to known in detail the configuration soft rocks and contact hard rock. The results of microtremor observations were measured for five minutes by using the sam-pling rate of 100 Hz with 3-components. Al-though they are results from five minutes mea-surements, it is still enough to get first funda-mental period of H/V ratio for most of cases.
The first fundamental frequency of H/V ratio mostly reflects the S-wave velocity of sediments and it is therefore used for validation of S-wave velocity structures determined by geotechnical approach.
Moreover, the single microtremors observa-tions of 274 sites in the eastern part of Yo-gyakarta City show in the Figure 2(a). The measurements were carried out during the day-time using a microtremor instrument which is model of Mitutoyo-GPL-6A3P and serial No. 0418707. A single seismic station was used for the microtremor measurements. It was com-posed of a short-period, three-component seis-mometer with natural period of one second, a 24-bit A/D converter with GPS time, sampling each channel at 100, and a laptop computer to control the system and store the data. At each sites microtremors were recorded with a sampling rate of 100 Hz for 5 minutes. Dur-ing the measurements particular attention was given to keep the recordings free from very lo-cal noise sources, like e.g. passing pedestri-ans, vehicles or operating machineries. Mete-orological disturbances, e.g., rainfall or gusty wind, did not occur during the observation pe-riod. The site’s topography and local peculiari-ties were also considered, e.g., artificial soil re-plenishments, floor coverings, paved or tarmac roads, and neighbouring elevated structures.
parameters have been evaluated in the research areas for determination strong ground motion and ground response analyses. The detailed drilling program had been gotten from sec-ondary data for subsurface investigation in Yo-gyakarta City. The boreholes had been through-out the study area to evaluate the geotechnical properties of subsurface soil layers. The bore-holes were generally drilled up to the bedrock. The depths are varying from 20 to 40 m. For the site characterization in the 8 km × 9 km of the eastern part of Yogyakarta City and twelve borehole investigations were conducted as shown in Figure 2a.
The eastern part of Yogyakarta City sits in a broad valley between two groups of roughly north running mountains, which are Kulon Progo Mountains to the west and Southern Mountains to the east. The towering Merapi volcano caps the northeast end of the valley. Be-hind that is the single peak of the Sundero vol-cano and a cluster of small peaks in the Dieng volcano complex as shown in Figure 2b.
5 Analysis of H/V spectrum
A microtremor is a very small ground motion that can be recorded at the ground surface. It can be produced by a variety of excitations (e.g., wind, traffic, breaking sea waves). A full microtremor record can be described by one vertical and two horizontal components. The analysis was conducted by using the recorded microtremor. First, the horizontal component which consists of estimating the ratio between the Fourier amplitude spectra of the horizontal (H) to vertical (V) components of ambient noise vibrations is recorded at one single station as shown in Figures 3(a) and (b). The peak period of the HVSR is known to correspond to the res-onant period of the site.
The procedure generally used to calculate the HVSR that consists in the application of Equation (1) to the average amplitude spec-tra of the three components of motion. This HVSR method postulates the shape of the Fourier spectrum (Nakamura, 2000). Equa-tion (1) shows the method used to calculate HVSR using the observed records (1)
HVSR=
q
FNSi(ω)2+FEWi(ω)2
FUDi(ω) (1)
where FNSi(ω), FEWi(ω)andFUDi(ω)denote
the Fourier amplitude of the NS, EW and UD components of each interval, respectively, and
ωis the frequency.
6 Transfer function or amplification
spectrum
Earthquake damage is strongly affected by site amplification from bedrock to the ground sur-face, as well as the size of the earthquake it-self. The site amplification of the ground is con-trolled by factors of the sedimentary layers such as soil density, shear wave velocity, damping characteristics, shape of irregular boundaries, etc. In considering the earthquake disaster pre-vention measures, knowledge of amplification characteristics and underlying structures of the ground are very important. The peak magni-tude of H/V ratio is generally correlated to site amplification. However, it is only a rough es-timation and the site amplification characteris-tics determined by response analysis is more acceptable and rational. The ratio of amplifi-cation of the Fourier spectrum at two layers is called frequency response function, spectral ra-tio or amplificara-tion factor. Amplificara-tion rara-tio is the amplitude of the objective layer to those of the reference layer and is a function with re-spect to frequency. The objective layer is cho-sen to be ground surface and reference layer is base. Thus, frequency at the peak of the spec-tral ratio corresponds to predominant period of the ground. The inverse of the frequency, i.e., natural predominant period is also obtained.
Figure 2: (a) Station of densely microtremor observations and existing drilling sites and (b) Topog-raphy or altitude map in Yogyakarta area
Figure 4: Principle of H/V spectrum methods (Nakamura, 2000).
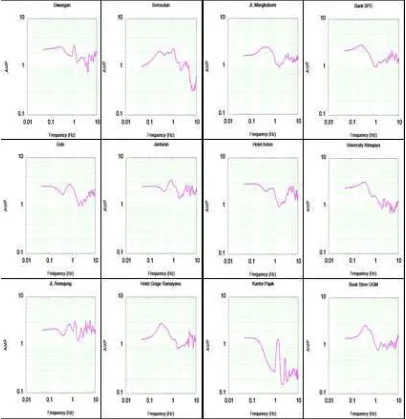
Figure 6: The transfer functions or the amplifi-cation factor.
AMP = Spectrum of horizontal motion of baserockSpectrum of surface horizontal motion
= ∝ Spectrum of surface horizontal motion Spectrum of surface vertical motion
(2) This equation enables to determine the natu-ral frequency of the surface deposit by simply using the surface records of microtremor. Thus, it is expected that the surface deposit is classi-fied into the viewpoint of earthquake response. The Figure 5 exhibits the transfer function or the amplification spectra of boreholes in the eastern part of Yogyakarta City.
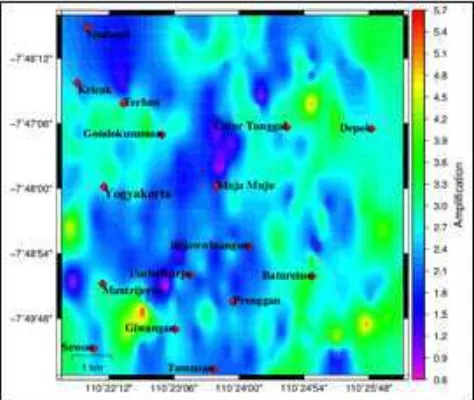
In Figure 6, the amplification factor generally ranges between 0.70 and 5.56. The high
ampli-fication mainly related to thicker sediment area where fundamental frequency is low, and vice versa: the lower amplification is in shallow sed-iment area where high fundamental frequency is dominant. The highest amplification zones are bounded in Terban, Gondokusuman, Yo-gyakarta, Mantrijeron, Baturetno, Catur Tung-gal and Depok areas where are thick sediment area and it should be contributed to construct the new huge building plan or project via en-gineering point of view. The lowest amplifica-tion zones are represented in dark blue colour which is included in Sinduadi, Kricak, north of Terban, south of Yogyakarta, Muja Muja, Re-jowwinangun and Umbulharjo, Prenggan, Se-won, Tamanan area (shallow sediment area).
7 Fundamental frequency
Estimation of the local response of a site is a key component of any analysis of local seismic hazard. Seismic hazards enable us to character-ize potential seismic aggressions that need to be taken into account while designing new struc-tures or upgrading existing ones. The experi-mental methods involving microtremor record-ings are useful for determining site effects in re-gions of moderate seismic activity like the east-ern part of Yogyakarta city where ground mo-tion records are few with highly dense urban population where the noise level is high. There-fore, each observation point provides a spectral ratio and enables an estimation of the funda-mental frequency and the maximum value of the amplification at the site studied.
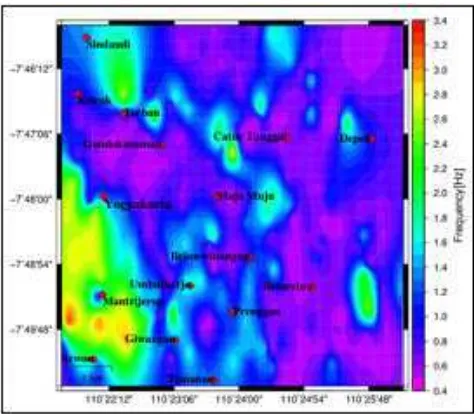
Figure 7: The fundamental frequency.
as the medium frequency zones (1.6-2.6 Hz). Moreover, it is noticed that small area between Mantrijeron and Giwangan area takes place in high frequency zones (>2.8 Hz). It means that high frequency zones are related to shal-low sediments and shal-low amplification zones. The general relationship between fundamen-tal frequency of peak H/V ratio and sediment thickness are shown in the following Table 1.
8 Evaluation of shear wave velocity
structures
The shear-wave velocity of soils plays an im-portant role in the design of geotechnical struc-tures under dynamic loads. Mapping of shear wave velocity profile has been widely used in seismic hazard and microzonation studies. A complete site characterization is essential for the seismic site classification and site response studies, which can be used together for seismic microzonation. Site characterization should include an evaluation of subsurface features, subsurface material types, subsurface material properties and buried/hollow structures to de-termine whether the site is safe against earth-quake effects not, such as site amplification. The theoretical evaluation of strong motions and site effects requires information on shear wave velocity structures, especially for
sedi-mentary layers overlying on bedrock, such as in Yogyakarta City.
The 27thMay 2006 earthquake caused severe damage in Yogyakarta Depression, especially in Yogyakarta city. One main reason for such se-vere damage is ground amplification due to un-derlying soil deposit. The most influential pa-rameter in determining the ground amplifica-tion in strong ground moamplifica-tion is the subsurface shear-wave velocity structure. Therefore, shear wave velocity structures were determined by geotechnical approach based on SPT values.
Geotechnical approach to S-wave velocity structure
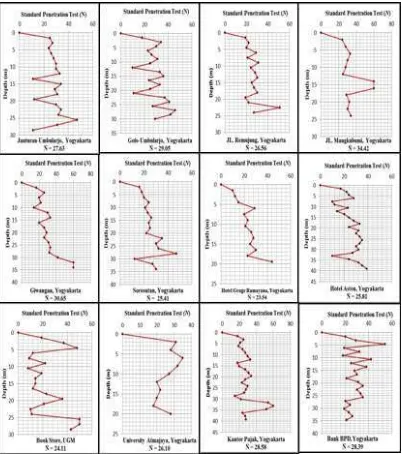
The standard penetration tests (SPT) were per-formed at twelve boring sites in the eastern part of Yogyakarta City together with drilling pro-grams. The SPT test was conducted at every 1.5 and 2 m interval in bore holes which these data are from secondary boring sites. These re-sults are basically related to shear wave veloc-ity. Then, the average N-values are calculated for each layer of evaluated subsurface soil pro-files by using the following equation (Fathaniet al., 2008).
Ni = recorded blows number ofithsoil layer
n= number of soil layer
Meanwhile, the S-wave velocity structures were determined by using empirical equations which mainly focused on SPT values (Yoshida
et al., 2004) for comparative analysis:
Vsi =100Ni1/3 (1≤Ni ≤25) (4)
(for sandy soil)
Vsi =80Ni1/3 (1≤Ni ≤50) (5)
(for clayey soil)
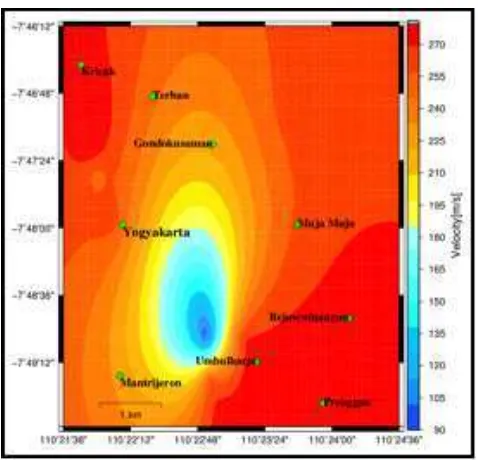
Figure 9: The shear wave velocity structure based on the average Standard Penetration Test (SPT).
Moreover, the soil classification is decided by using the results of site investigations of stan-dard penetration testing at 12 bore holes. From SPT results, the values of N until a depth of 20– 40 m are shown in Figure 8. The average values of N are used for determining the soil classifi-cation on each site. By using Equation 3, the average values of N until a depth of 20–40 m at the sites surrounding the eastern part of Yo-gyakarta City vary from 23.54 to 34.42.
In Figure 9, according to the average Stan-dard Penetration Test (SPT), the shear wave velocity of the downtown of the south of Yogyakarta is underlain by soft soil condi-tion (<175 ms−1). However, Kricak, Terban, Godokusuman, Yogyakarta, Muja Muju, Re-jowwinangun, Mantrijeron, Umbulharjo and Prenggan areas are investigated by medium soil (>175 ms−1). Therefore most of the re-search area homogeneously lie in the medium
9 Conclusion
References
Fathani, T. F., Adi, A. D., Pramumijoyo, S. and Karnawati, D. (2008) The Determination of Peak Ground Acceleration at Bantul Regency, Yo-gyakarta Province, Indonesia, The YoYo-gyakarta
18 (in Japanese).