www.elsevier.comrlocaterdsw
The impact of design management and process management on
quality: an empirical investigation
Sanjay L. Ahire
a,), Paul Dreyfus
b,1a
Department of MIS and Decision Sciences, UniÕersity of Dayton, 300 College Park, Dayton, OH 45469-2130, USA
b
Department of Management, Athens State UniÕersity, Athens, AL 35611, USA
Received 21 May 1998; accepted 6 October 1999
Abstract
Ž .
Design management and process management are two important elements of total quality management TQM implementation. They are drastically different in their targets of improvement, visibility, and techniques. In this paper, we establish a framework for identifying the synergistic linkages of design and process management to the operational quality
Ž . Ž .
outcomes during the manufacturing process internal quality and upon the field usage of the products external quality . Through a study of quality practices in 418 manufacturing plants from multiple industries, we empirically demonstrate that both design and process management efforts have an equal positive impact on internal quality outcomes such as scrap, rework, defects, performance, and external quality outcomes such as complaints, warranty, litigation, market share. A detailed contingency analysis shows that the proposed model of synergies between design and process management holds true for large and small firms; for firms with different levels of TQM experience; and in different industries with varying levels of competition, logistical complexity of production, or production process characteristics. Finally, the results also suggest that organizational learning enables mature TQM firms to implement both design and process efforts more rigorously and their synergy helps these firms to attain better quality outcomes. These findings indicate that, to attain superior quality outcomes, firms need to balance their design and process management efforts and persevere with long-term
Ž .
implementation of these efforts. Because the study spans all of the manufacturing sectors SIC 20 through 39 , these conclusions should help firms in any industry revisit their priorities in terms of the relative efforts in design management and process management.q2000 Elsevier Science B.V. All rights reserved.
Keywords: TQM; Design management; Process management; Product quality; Empirical; Structural equations modeling
)Corresponding author. Tel.:q1-219-237-4283; fax:q
1-219-237-4866.
Ž .
E-m ail addresses: sahire@ iusb.edu S.L. A hire ,
Ž .
[email protected] P. Dreyfus .
1
Tel.:q1-205-233-8120; fax:q1-205-233-8164.
1. Introduction
In this paper, we examine two types of organiza-tional efforts that contribute to the quality of prod-ucts and processes: design management and process management. While both are apparently relevant to
Ž .
successful total quality management TQM
imple-0272-6963r00r$ - see front matterq2000 Elsevier Science B.V. All rights reserved.
Ž .
mentation, they are drastically different in their tar-gets of improvement, visibility, and techniques. De-sign management efforts are targeted toward improv-ing product designs while process management strives for quality improvement in manufacturing techniques and processes. Design management ef-forts involve long-term work in the background while process management is usually more visible yet tac-tical. Finally, they involve different managerial and technical tools.
The manufacturing strategy literature has viewed product quality as one of the major competitive priorities for attaining a sustainable competitive
ad-Ž .
vantage Hill, 1994 . Recently, the speed of new product introduction has also been added to this list
Ž .
of priorities Kim, 1996 . From a quality manage-ment perspective, the speed of new product design and development indicates the importance of design-ing quality into new products. Because design efforts often have a limiting impact on attainable product quality, several researchers have stressed the
impor-Ž
tance of designing quality into products Juran, 1981; Juran and Gryna, 1993; Hauser and Clausing, 1988; Dean and Susman, 1989; Taguchi and Clausing, 1990; Boothroyd et al., 1994; Mizuno and Akao,
.
1994 .
Although the inherent design of products and processes is important, firms have to ensure a consis-tent and cost effective attainment of the desired product quality during production. Conformance quality relates to the need for managing production processes to yield products adhering to expected specifications. Several researchers emphasize process quality management and quality assurance as a way
Ž
of achieving high manufacturing quality Robinson and Schroeder, 1990; Benton, 1991; Everett and
.
Sohal, 1991; Chen and Tirupati, 1995 . Deming
Ž1986 advocated efficient process management, open.
communication, and systematic identification and re-moval of defects and their causes in the process. According to Deming, higher process quality results from efforts to attribute quality problems to system or process instead of workers. This in turn will yield high quality products.
Designing quality into products and managing production quality should both impact quality. Yet, few studies have touched upon the relative impor-tance of these two phases of quality management.
One such study, The American Quality Foundation
Ž .
and Ernst and Young study 1992 suggested that high quality performance firms invested more efforts in design management while low quality perfor-mance firms focused on inspections. However, the results of this study were published without disclos-ing the methodology and statistical analyses. Hence,
Ž
its conclusions cannot be generalized Hendricks and
. Ž .
Singhal, 1997 . Radhakrishnan and Srinidhi 1994 presented a framework for determining whether qual-ity should be designed into or inspected into
prod-Ž .
ucts. Flynn et al. 1995 empirically tested the rela-tionship among several elements of quality manage-ment. They reported inconclusive results about the relative impact of design management and process management on manufacturing quality. Greene
Ž1993. suggested that a firm with global quality visions should pursue the use of almost one hundred specific quality tools, ranging from problem report-ing and resolution to quality function deployment.
Ž .
Recently, Jayaram et al. 1997 found that typically about 38 of these tools were used in various manu-facturing firms. They identified the tools with signif-icant relationships to various aspects of product qual-ity such as aesthetics, reliabilqual-ity, and serviceabilqual-ity. They also identified significant tools associated with relatively high or low emphasis on each of the following four strategies: inspection, process control, process improvement, and design quality. However, they did not specifically study the relative net impact of the use of these strategies on either process or product quality. While these studies reported some useful observations on the relevance of design and process management in quality efforts, a systematic analysis of the net impact of these two components of TQM efforts on outcomes has not been under-taken. In this paper, we present an empirical investi-gation of the role of design and process management in quality outcomes of manufacturing firms.
2. Model
The primary objective of our research is to exam-ine the relative role of design and process manage-ment on operational quality results at the plant level.
Ž .
Ž .
products manufactured in the plant internal quality ?
Ž .2 Does it affect the customer perception of the Ž
quality of products upon field usage external
qual-. Ž qual-.
ity ? 3 Does process management affect the
inter-Ž .
nal and external quality? 4 Do design and process management affect operational quality to the same
Ž .
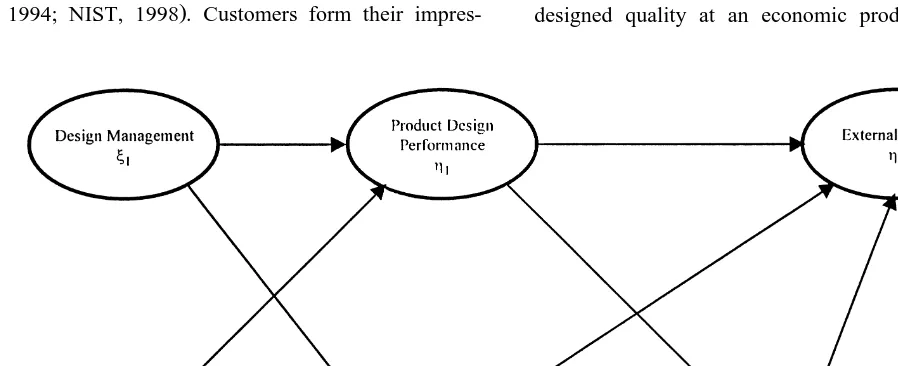
extent? 5 Is the relative influence of design and process management on the operational quality con-tingent upon organizational context variables such as size, quality management experience, and industry? We incorporate these questions in the form of a conceptual model shown in Fig. 1 that integrates the hypotheses developed in this section. The constructs used in developing our model are defined and the literature support for them is summarized in Table 1. To describe the hypothesized linkages of design and process management with quality outcomes more clearly, we first discuss the relevant elements of internal and external quality. This discussion is fol-lowed by the components of design and process management and their relationships in our model.
2.1. External and internal quality outcomes
The notion that overall market and business per-formance can be realized through long-term product quality improvement is a cornerstone of the
contem-Ž
porary quality revolution George and Weimerskirch,
.
1994; NIST, 1998 . Customers form their
impres-sions about a firm’s products based upon their
cur-Ž
rent and past experience with these products Garvin,
.
1987 . A satisfactory field performance of the prod-ucts is accompanied by lower customer dissatisfac-tion, greater customer loyalty, and improved market
Ž
share Crosby, 1979; Buzzell and Gale, 1987; Hardie,
.
1998 . We label this aspect of quality outcome as
external quality because it is related to the customer’s
perspective of the products upon field usage. It captures Juran’s ‘‘fitness for use’’ dimension of
Ž .
product quality Juran, 1981; Juran and Gryna, 1993 . Specifically, we focus our attention on four long-term indicators of external quality: warranty work, litiga-tion claims, customer complaints, and market share. Of these, warranty and litigation claims and cus-tomer complaints refer to the external quality failure
Ž .
costs Juran and Gryna, 1993 . Market share also has been directly associated with the customer percep-tion of a firm’s products based on recent and past
Ž
usage Buzzell and Gale, 1987; Reeves and Bednar, 1994; Flynn et al., 1995; Larson and Sinha, 1995;
.
Hardie, 1998 . Based on support from TQM
litera-Ž .
ture Dawson and Patrickson, 1991; Ahire, 1996 , we used improvement in these indicators over a 3-year time frame to measure firms’ performance along external quality outcomes.
Internal quality captures the ability of a
manufac-turing plant to produce products conforming to their designed quality at an economic production cost.
Table 1
Construct definitions and literature support
Construct Description Supporting literature
Ž . Ž .
Design management DM Design of product and process quality Hauser and Clausing 1988 ; Dean and Susman
Ž . Ž . Ž .
through advanced managerial and technical 1989 ; Womack et al. 1990 ; Funk 1992 ;
Rosen-Ž . Ž . Ž .
practices thal 1992 ; Greene 1993 ; Boothroyd et al. 1994 ;
Ž . Ž .
Deschamps and Nayak 1995 ; Ahire et al. 1996 ;
Ž .
Swink et al. 1996
Ž . Ž . Ž .
Quality training TRAIN Organizationwide training to enhance the Lawler et al. 1992 ; Snell and Dean 1992 ;
Ž .
competence in using quality management Svenson and Riderer 1992 ; Blackburn and Rosen
Ž . Ž . Ž .
tools 1993 ; Brown et al. 1994 ; Ahire et al. 1996 ;
Ž .
Black and Porter 1996 ; Melnyk and Denzler
Ž1996.
Ž . Ž . Ž .
Product design performance PDP Outcome of the design management process Clark and Fujimoto 1991 ; Huthwaite 1991 ;
Ž . Ž .
in terms of time to market and design Rosenthal 1992 ; Wheelwright and Clark 1992 ;
Ž .
changes across new products Deschamps and Nayak 1995 ; Kessler and
Ž . Ž .
Chakrabarti 1996 ; Melnyk and Denzler 1996
Ž . Ž . Ž . Ž .
Process quality management PQM Tracking and improvement of manufactur- Deming 1986 ; Imai 1986 ; Shingo 1986 ;
Ž . Ž .
ing process quality Mizuno 1988 ; Modarress and Ansari 1989 ;
Ž . Ž .
Robinson and Schroeder 1990 ; Greene 1993 ;
Ž . Ž .
Flynn et al. 1994 ; Ahire and Rana 1995 ; Chen
Ž . Ž .
and Tirupati 1995 ; Jayaram et al. 1997
Ž . Ž . Ž . Ž .
Internal quality INTQ Quality of finished products assesed before Crosby 1979 ; Schonberger 1986 ; Garvin 1987 ;
Ž . Ž .
shipping and associated process quality Juran and Gryna 1993 ; Brown et al. 1994 ; Flynn
Ž . Ž .
et al. 1994 ; Reeves and Bednar 1994 ; Ahire et
Ž . Ž .
al. 1996 ; Grandzol and Gershon 1998
Ž . Ž . Ž .
External quality EXTQ Quality of finished products from cus- Buzzell and Gale 1987 ; Garvin 1987 ; Juran and
Ž . Ž .
tomers’ viewpoint upon field usage Gryna 1993 ; Reeves and Bednar 1994 ; Larson
Ž . Ž .
and Sinha 1995 ; Grandzol and Gershon 1998 ;
Ž .
Hardie 1998
Thus, it can be viewed as the ‘‘conformance to requirement’’ dimension of quality as specified by
Ž .
Crosby 1979, 1996 . We specifically consider five measures of internal quality: scrap rate, rework rate, defect rate, internal reliability test performance prior to shipping, and manufacturing productivity. The performance of finished products in final tests and the proportion of defective units of production are widely used indicators of conformance quality at the
Ž
end of the production process Crosby, 1979, 1996;
.
Reeves and Bednar, 1994; Jayaram et al., 1997 . However, a lower percent of outgoing defective units can come at great cost if in-production quality is not assured. Efficient processes have been associated
Ž
with improved manufacturing productivity
Schon-.
berger, 1986 . The cost efficiency of a production process is reflected in the scrap and rework gener-ated during production. They represent internal
qual-Ž .
ity failure costs Juran and Gryna, 1993 . Scrap and rework have been used as appropriate indicators of
Ž
internal quality Flynn et al., 1995; Grandzol and
.
Gershon, 1998 . Therefore, we include manufactur-ing productivity as a supplementary measure of in-ternal quality. Using the same literature support as
Ž
that for external quality Dawson and Patrickson,
.
1991; Ahire, 1996 , we used improvement in the aforementioned indicators over a 3-year time frame to measure firms’ performance along internal quality outcomes.
The quality of products passing internal tests of reliability should affect the experience of customers who use the products in two prominent ways. First, customers perceive product quality in terms of their
Ž
net value defined as the ratio of performance to
.
influ-ence external quality due to their impact on the denominator of the value equation. The performance and reliability of the product also should affect the external quality indicators of customer satisfaction
Ži.e. complaints, warranty, litigation, and market
.
share . A lower percentage of defective products should help a firm to reinforce positive customer
Ž .
experience Hardie, 1998 . Therefore, we propose the following hypothesis.
Hypothesis 1. Internal quality has a positiÕe effect
on external quality.
2.2. Product design performance
Effective product design performance has been used as an important market leadership tool by suc-cessful firms in competitive industries. From the available literature, we identified two major dimen-sions of this competitive capability: new product development speed and number of components in products. The first dimension explains the ability of a firm to frequently offer new products and new designs to customers. Rubbermaid’s introduction of new products at a rate of more than one per day or Sony’s flooding of the electronics market by simulta-neously displaying more than 25 models of the same
Ž . Ž
product e.g. Walkman illustrate this ability Chase
.
et al., 1998 . However, the product variety offered by a firm depends upon the speed of product devel-opment. For example, the number of US car models for sale in the US rose from 38 to 50 between 1973 and 1989. During the same period, the number of Japanese car models for sale in the US rose from 19 to 58.
This capability of firms to outperform competitors based on product variety has been traced to two major outcomes of the product design process. The first source is the speed of new product development. The Japanese firms spent an average of 1.7 million h of engineering and a total of 46 months on develop-ment of a new model while their US counterparts spent an average of 3.1 million engineering h and
Ž
about 60 months to develop a new model Womack
.
et al., 1990 . The second source of competitive capability of new product designs is design simplifi-cation and component standardization. They both
affect product cost and performance through their impact on the number of parts used in the product. This was illustrated when NCR replaced its cash register model 2160 with the newer design model 2760 in the 1980s. Because of an improved design which resulted in an 85% reduction in the number of parts used, the model 2760 required only 25% of the assembly time as required by its predecessor, the model 2160. The new model also reduced the num-ber of parts and subassemblies supplied by outside sources by 65%, thus saving on direct and indirect
Ž .
material costs Port, 1989 . The importance of design simplification and parts reduction is further illus-trated by Toyota’s introduction of a more powerful engine at 33% less cost which was the result of a 33% reduction in the number of engine parts used previously and allowed Toyota to surge ahead of its
Ž
competition Wall Street Journal, November 11,
.
1996 . Finally, component standardization across product lines reduces the cost of production signifi-cantly through its impact on inventories and allows
Ž
employees to focus on fewer parts Schonberger,
.
1986; Melnyk and Denzler, 1996 . Hence, we used the speed of new product development and compo-nents reduction in product designs as two major indicators of product design performance. However, since design cycle times can vary widely across industries, we did not measure product design perfor-mance using a specific time frame such as 3 years. As the foregoing discussion shows, product de-sign performance should directly affect both external quality and internal quality. First, better product designs and faster new product introductions win over and retain customers. Also, agile innovators can better anticipate and respond to customers’ current and latent needs and preferences. Hence, agile firms should have fewer customer dissatisfaction problems. Such firms should also be able to maintain market leadership in their industry. Therefore, we propose the following hypothesis.
Hypothesis 2. Product design performance has a
positiÕe effect on external quality.
exam-ples of NCR and Toyota suggest, design simplifica-tion and components reducsimplifica-tion are important hall-marks of good design performance. Parts reductions allow workers to produce new products faster by working with previously designed and built compo-nents for which costs, standards, bills of materials,
Ž
and lead times are already known Melnyk and
.
Denzler, 1996 . Because process complexity is a function of design complexity, a lower number of parts per product should result in more streamlined production. For example, as NCR’s design improve-ment suggests, fewer and standardized components result in lower inventory costs and easier
manage-Ž .
ment of inventory Port, 1989 . Simplified produc-tion and workers’ prior experience with standardized parts should also result in lower scrap and rework
Ž .
and fewer defective units Schonberger, 1986 . This leads us to the following hypothesis.
Hypothesis 3. Product design performance has a
positiÕe effect on internal quality.
2.3. Process quality management
Ž .
Deming 1986 was a prominent proponent of
process quality management as a means of
optimiz-ing process performance. Accordoptimiz-ing to Taguchi
Ž1987 , the cost of non-conformance of quality in-.
creases at an increasing rate with the magnitude of non-conformance. Inferior quality manufacturing processes consume more resources due to scrap and rework of work-in-process and of the finished prod-ucts. This also leads to high defect rates and rejec-tions at final inspection stage. Hence, process quality management has been frequently cited as a major
Ž
dimension of integrated quality efforts Imai, 1986;
.
Shingo, 1986; Anderson et al., 1995 .
Process quality management essentially involves identifying critical components of the manufacturing processes and improving them to ensure the superior quality of products at economic costs. Researchers have stressed the importance of identifying appropri-ate process quality improvement opportunities be-cause of their significant impact on cost reduction, quality improvement, and organizational positive
re-Ž
inforcement of such efforts Spector and Beer, 1994;
. Ž .
Ahire, 1997 . Ahire and Rana 1995 suggest that
process improvement projects be prioritized and ef-forts be focused on key processes that show signifi-cant potential payoffs and visibility. Hence, we used selection of key processes for improvement as an indicator of process quality management efforts.
Process quality management can be viewed as a
Ž .
continuing four-step process: 1 selecting key pro-cesses through prioritization, typically, based on cost
Ž . Ž .
of quality considerations Ahire and Rana, 1995 , 2 identifying the root causes of problems in selected processes through the use of quality tools and
identi-Ž
fying improvement strategies Robinson and
. Ž .
Schroeder, 1990 , 3 implementing the changes us-ing corrective actions rangus-ing from error-proofus-ing techniques to resetting local parameters to complete
Ž
redesign of processes Shingo, 1986; Hammer and
. Ž .
Champy, 1993 , and 4 measuring the
improve-Ž . Ž .
ments in the process Ahire, 1997 . Juran 1981 and
Ž .
Deming 1986 have both stressed the importance of scrap and rework measurement throughout the manu-facturing process for identifying key processes and monitoring improvement in problem areas. Deming
Ž1986 has also specifically advocated the use of. Ž .
statistical process control SPC to track process performance for in-production quality assurance. Hence, we used the following measures of process
Ž .
quality management: 1 monitoring of scrap and
Ž . Ž .
rework, 2 application of SPC tools, 3 use of corrective and prevention tools such as error
proof-Ž .
ing, and 4 focus on key processes.
Process quality management should have a natural impact on internal quality through its effect on the amount of scrap and rework generated. As efforts are made to identify problem areas in production and corrective actions taken to eliminate the quality prob-lems, a lower number of defective products will be
Ž .
produced. Also, by Taguchi’s 1987 quadratic loss function, tightening of the process parameters around the optimum levels should lead to lower costs of poor quality including defects, scrap, and rework. Therefore, we propose the following hypothesis:
Hypothesis 4. Process quality management has a
positiÕe effect on internal quality.
and production employees to resolve customer com-plaints, provide feedback about product quality, and offer suggestions for future product improvements. Dell Computer’s approach of the production team directly handling the order fulfillment from cus-tomers is based on the notion of bringing cuscus-tomers closer to the actual production process for better
Ž
quality performance. Solectron a winner of the
.
Baldrige Award in 1991 resolves customer
com-Ž .
plaints from its industrial customers by: a identify-ing the out-of-control components of the
manufactur-Ž .
ing process, b revisingrimproving the process to
Ž .
bring it under control, and c tightening the toler-ance limits on the process using statistical tools if the
Ž
process is already under control George and
.
Weimerskirch, 1994 . To test the effectiveness of such strategies, we propose the following hypothesis:
Hypothesis 5. Process quality management has a
positiÕe effect on external quality.
2.4. Design management
In Section 2.2, we identified superior product design performance as an antecedent to high internal and external quality. However, the literature on prod-uct innovation suggests that the design management process largely determines the product design
perfor-Ž
mance Rosenthal, 1992; Wheelwright and Clark,
.
1992 . Hence, researchers have identified design management as an important element of integrated
Ž
quality efforts Flynn et al., 1994; Ahire et al.,
.
1996 .
It is possible to summarize several characteristics of an effective design management process from the new product design and innovation literature. Suc-cessful innovator firms first identify current and latent customer needs in a timely fashion. They translate these identified needs into relevant new product concepts or improved features of existing products. Finally, they ensure that they introduce these innovations into the market before competitors
ŽDeschamps and Nayak, 1995; Cohen et al., 1996 ..
However, while speed of executing this cycle is important, effectiveness of the design process may be undermined if accuracy and consistency of the
execution is compromised. For example, the rush to market a new product may compromise identifica-tion of customer needs and thus result in irrelevant products. Similarly, if manufacturability and process considerations are ignored, excellent product ideas may not result in high quality products, thus failing
Ž
the promising designs Dean and Susman, 1989; Boothroyd et al., 1994; Kessler and Chakrabarti,
.
1996 .
The traditional approach to design consisted of compartmentalized and myopic organization with de-sign engineers and R & D technologists forcing their ideas of product and process improvements on the marketing and production functions. This approach often led to irrelevant and ineffective innovation
ŽWheelwright and Clark, 1992 . Speed of product.
development and quality of developed products are critical to successful product design efforts. Rapid and relevant design and innovation requires a cross-functional organization and concurrent
planningrde-Ž .
signing process Deschamps and Nayak, 1995 . The concurrent engineering approach involves partici-pants from all parts of the supply chain in the design
Ž .
process Swink et al., 1996 . The participation of customers and the marketing function in the design process ensures that product designs are relevant to customer needs. Timely feedback from the produc-tion funcproduc-tion ensures the technical feasibility of the product ideas. Finally, coordination among the de-sign, purchasing, and production functions improves design and implementation of appropriate product– process combinations, resulting in a cost-effective
Ž .
production system Wheelwright and Clark, 1992 . An effective design process organized in this manner will be closely associated with specific design strate-gies such as standardization of components across various products and reduction in product compo-nents.
Several firms have used cross-functional teams and concurrent engineering to reduce product design cycle times and develop products that exceed
cus-Ž
tomer expectations Kochan, 1991; Rosenthal, 1992;
.
Deschamps and Nayak, 1995 . These cross-func-tional practices typically suggest early interactions among marketing, product design, manufacturing, quality assurance, and new product development
Ž .
func-tions are critical to understanding the linkage be-tween pre- and post-production quality issues. On-going interactions between the design and production functions is essential to ensure that the original and updated product designs are in agreement with the capabilities of the current manufacturing configura-tion. Finally, new product development time and
Ž
‘‘ramp-up’’ time the time taken by the production function to produce volume quantities of the new
.
product with acceptable levels of quality are both important for quality and time-based performance. Hence, the production function’s involvement in new product development projects is essential. Bench-marking has received considerable attention due to its role in ensuring the competitiveness of a firm’s
Ž .
products and processes Camp, 1989 . Finally, good product design practices entail evaluation of product designs from a manufacturing process perspective. Advanced design techniques such as the design of experiments can be useful in optimizing manufactur-ing process considerations for new product designs
ŽTaguchi, 1987 . Thus, we measured a firm’s design.
management efforts through the following items: use of quality function deployment, use of design of experiments in designing products and processes, use of competitive benchmarking, and integrated in-volvement of different levels of management, em-ployees, functions, and customers and suppliers in design efforts.
Based on these characteristics of integrated design practices, we measured organizations’ design man-agement efforts based on the extent of use of ad-vanced design organization and innovation execution tools such as quality function deployment, cross-functional teams, concurrent engineering, bench-marking, and design. To evaluate the impact of design management on product design performance, we propose the following hypothesis:
Hypothesis 6. Design management has a positiÕe
effect on product design performance.
Design management practices identified above should also affect the planning and coordination of overall quality efforts. Quality management literature has associated cross-functional integration of quality efforts as an enabler of teamwork, cooperation, and
Ž
quality-oriented culture Funk, 1992; Lawler et al.,
.
1992; Mirvis, 1997; Grandzol and Gershon, 1998 . The same organizational members who participate in the advanced design management practices also exe-cute process quality management practices. Their knowledge, experience, and attitudes regarding team-work, cooperation, and customer focus should spill over into the on-going efforts of tracking and im-proving the quality of manufacturing processes. This possibility leads to the following hypothesis:
Hypothesis 7. Design management has a positiÕe
effect on process quality management.
2.5. Quality training
Quality training has probably been the most
pub-licized programmatic aspect of TQM implementa-tion. It has been long recognized that well focused quality training is essential to better quality
manage-Ž .
ment Juran, 1981; Robinson and Schroeder, 1993 . The success of process quality improvement efforts is contingent upon the effectiveness of the actual usage of process quality improvement tools. The effectiveness of tools depends upon employees’ knowledge of the tools and management’s promotion of these tools. The level of knowledge about tools can be improved if the management ensures rigorous
Ž
quality training for managers and employees
Gala-.
gan, 1992; Svenson and Riderer, 1992 . Management can actively promote the use of these tools by pro-viding positive incentives and convincing employees that initial errors in using the tools are acceptable
ŽEverett and Sohal, 1991 . Also, multi-skilled em-.
ployees are more versatile and have a broader per-spective of the manufacturing process. Thus, the following four items measure a firm’s quality train-ing efforts: management and employee traintrain-ing in quality controlrimprovement tools, multi-functional training of employees, and actual use of process qualityrimprovement tools.
Researchers suggest that training employees in multiple-skills will enable them to better contribute
Ž
to process quality management Schonberger, 1986;
.
Hypothesis 8. Quality training has a positiÕe effect
on process quality management.
Quality training typically involves training in pro-cess control methods such as SPC tools. Specialized quality training also entails training in managerial problem-solving tools, group decision-making, and design tools such as, quality function deployment
Ž
and design of experiments Modarress and Ansari,
.
1989; Svenson and Riderer, 1992 . The impact of these specific design-related tools on product designs is hypothesized as follows.
Hypothesis 9. Quality training has a positiÕe effect
on product design performance.
3. Contingency factors
Fig. 1 and the associated nine hypothesized paths represent a conceptual model of the role of design and process management in a manufacturing firm’s internal and external quality outcomes. Although the hypothesized model relationships are rooted in litera-ture, we should not ignore the possibility that the intensity of execution of various implementation constructs and the resulting outcome constructs could be contingent upon some organizational and industry characteristics. Below, we identify some relevant contextual factors and their potential impact on the levels of the constructs in the model as well as on the model relationships.
3.1. Firm size effects
Firm size is an important contingency factor for several reasons. First, smaller firms have flatter orga-nizational structures and more informal communica-tion channels. Thus, because smaller factories are more manageable, TQM elements such as process quality management and design management maybe
Ž
more effectively applied in small firms Sonfield,
.
1984; Manoochehri, 1988 . Researchers have also associated the smaller size and informal organiza-tional structures of smaller organizations with their abilities to encourage and implement innovation
ŽSironopolis, 1994 . On the other hand, larger firms.
have more market clout, capital resources, and
pro-Ž .
fessional managerial expertise Finch, 1986 . To our
Ž .
knowledge, only one study Ahire and Golhar, 1996 has compared TQM implementation in large firms
Žmore than 250 employees and small firms 250 or. Ž .
fewer employees . Those researchers reported that while large and small firms did not differ signifi-cantly along design quality management, small firms did implement SPC usage to a higher extent than large firms. A closer examination of high product quality firms indicated that large high quality firms implemented design quality management and SPC usage more intensively than their small counterparts. Considering the literature support for distinctions between small and large firms in the general man-agement domain and a relative paucity of research in the quality management area with the aforemen-tioned exception, we investigated the effect of firm size on our model through the following propositions
Žin null form :.
Proposition 1. The leÕels of model constructs are
not affected by firm size.
Proposition 2. The model relationships are not
af-fected by firm size.
3.2. TQM duration effects
The organizational learning theory proposes that TQM implementation effectiveness will increase with
Ž .
TQM maturity in a firm. According to Garvin 1993 , this organizational learning is associated with an organization’s ability to explore the unknown and to identify and pursue novel solutions. In the context of our model, as TQM implementation matures, a firm may be able to maintain reliability of current produc-tion processes, and yet swing toward performing even better on design management and discovering a
Ž .
Ž .
Anderson et al. 1995 , organizational learning refers to the organizational capability to recognize and nurture the development of its skills, abilities, and knowledge. They identified organizational learning as one of the cornerstones of Deming’s theory of quality management and suggested that learning in-fluences process management. Though individual or-ganizations may differ in their ability to learn, the pervading nature of TQM programs should necessi-tate adequate time first for the creation of TQM
Ž .
infrastructure Ahire, 1996 and then for substantial
Ž .
organizational learning Melnyk and Denzler, 1996 . TQM implementation of 3 years has been used as an adequate time-frame to evaluate outcomes of TQM
Ž
campaigns Dawson and Patrickson, 1991; Ahire,
.
1996 . Hence, we test the following propositions.
Proposition 3. The leÕels of model constructs are
not affected by TQM duration.
Proposition 4. The model relationships are not
af-fected by TQM duration.
3.3. Industry effects
Type of industry could have moderating effects on the model relationships for several reasons. First, adoption and implementation rigor of technological and managerial innovations has been linked to the industry structural characteristics such as domestic
Ž .
and global competitive environment Porter, 1991 . The higher the volatility and global competitive chal-lenges of an industry, the higher the incentive for implementing such initiatives. For example, the auto-motive and computer industries have adopted con-temporary operations improvement strategies such as TQM to a much greater extent as compared to more stable industries such as pulp and paper or clay and glass. Second, industries also differ in terms of types of products and production processes. For example, the chemical industry primarily uses batch and con-tinuous manufacturing processes whereas the auto-motive or computer industry relies heavily on
modu-Ž .
lar assembly line production. Schmenner 1986 clas-sified industry SIC groups into three categories based on the logistical complexity of their production
pro-Ž
cesses measured by number of steps in the
produc-.
tion process . He concluded that the inherent nature of processes could impact the ability of various industries to implement individual elements of
pro-Ž .
ductivity improvement techniques. Funk 1995 fur-ther used Schmenner’s classification and argued that the logistical complexity of a production system will affect the relevance of various operations improve-ment techniques. For example, teamwork and coop-eration are of greater significance in logistically complex production systems such as automobile and computer assembly than in low logistical complexity production processes such as chemicals or food
pro-Ž . Ž .
cessing Funk, 1995 . Schmenner 1986 and Funk
Ž1995 classification coded SIC groups 20 through.
33 as low logistical complexity industries and SIC 34 through 38 as high logistical complexity indus-tries.
Coincidentally, the high logistical complexity
in-Ž
dustries electrical machinery, fabricated metal prod-ucts, industrial machinery, transportation equipment,
.
electronics, and instrumentation have also experi-enced fiercer global competition and use of advanced manufacturing technologies as compared to the low
Ž
logistical complexity industries Kotha and
Vadla-.
mani, 1995 . Moreover, these categories are synony-mous to classification of process-type production
Ž .
industries SIC 20 through 33 versus discrete-type
Ž . Ž
production industries SIC 34 through 38
Swami-.
dass and Kotha, 1998 . Hence, we test the impact of the differing intensity of competition, differing logis-tical complexity of production, and differing produc-tion processes across industries on our hypothesized model through the following propositions.
Proposition 5. The leÕels of model constructs are
not affected by the industry characteristics of compe-tition, logistical complexity, or production processes.
Proposition 6. The model relationships are not
af-fected by the industry characteristics of competition, logistical complexity, or production processes.
4. Survey
manage-ment practices on operational performance of manu-facturing plants in multiple industries. To assess the broader research questions, a comprehensive survey instrument, consisting of 115 question items, was developed in the main study. The main instrument was intended to examine several different organiza-tional management issues.
Ž .
Six American Society for Quality ASQ
mem-Ž .
bers industry managers were asked to review the original proposed instrument and refine it to enhance the readability, clarity, and comprehensiveness of the measurement instrument. A second test of con-tentrface validity was conducted with the redesigned questionnaire using a different group of ASQ mem-bers. Minor changes were suggested and the recom-mendations were incorporated into the final ques-tionnaire. In addition, a pilot-test was conducted at a local chapter of ASQ.
The main mail survey was administered to the ASQ mid-level managers in 2000 manufacturing
Ž .
firms SIC groups 20 through 39 randomly selected from all 48 of the contiguous states and Puerto Rico. Dillman’s three-wave method was used to execute
Ž .
the survey Dillman 1987 . It yielded a total response
Ž .
sample of 681 firms 34% response rate . The re-sponse to the instrument was examined for
non-re-Ž .
sponse bias. A MANOVA test p-0.05 was con-ducted to compare all of the responses along each variable across the first, second, and third wave
ŽArmstrong and Overton, 1977 . The test did not.
reveal any significant difference between the waves. In addition, the three waves were not significantly different in terms of number of employees, revenue, and unionization. These tests suggested that the sam-ple responses were representative of the general pop-ulation.
For this paper, we used 30 quality management related items from the original instrument that mea-sured the six constructs of the proposed model. These are presented in Appendix A. All items on the current research instrument were measured using a
Ž
seven-point Likert scale 1sstrongly disagree, 7s
.
strongly agree . Based on listwise elimination of responses corresponding to these 30 items, we used a response sample of 418 plants spanning 20 SIC
Ž .
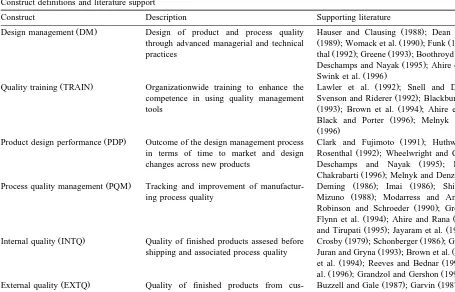
groups SIC 20 through 39 for this research paper. The characteristics of this sample are presented in Table 2. Note that the sample exhibited significant
Table 2
Response sample composition
a
Response sample size 418 plants
Ž .
Major SIC groups represented in the sample Name of the group SIC code: number of plants
Ž .
Industrial, commercial machinery, computers 35 : 51
Ž .
Electronic, electrical equipment 36 : 51
Ž .
Fabricated metal products 34 : 45
Ž .
Instruments 38 : 39
Ž .
Transportation equipment 37 : 38
Ž .
Rubber and plastics 30 : 38
Ž .
Chemicals 28 : 36
Ž .
Food and kindred 20 : 23
Ž .
Paper and allied products 26 : 20 Others: 52
Did not specify: 46
Number of employees per plant means477, medians250, modes150
Ž .
Net sales per plant million US$ means69.26, medians10.0, modes10.0
Ž .
Percent of plants unionized % unionizeds28.3%, non-unionizeds72.7%
Ž .
Age of a formal quality program at the plant years means6.6, std. deviations2.2
Respondent titles Managers with ‘‘Quality’’ in titles74%
Plantrproductionrtechnical managers24%
Ž .
Others HRM, accounting, etc.s2%
a
diversity in terms of industries, plant size, revenue, unionization, and their TQM experiences.
5. Measurement model
5.1. Model refinement
The current research instrument consisting of 30 items listed in Appendix A was refined prior to testing the proposed model. For this purpose, a con-firmatory factor analysis of the initial measurement
Ž
model was conducted using LISREL 8.2 Joreskog
.
and Sorbom, 1998 . The initial measurement model
Ž 2 with all 30 items resulted in an inadequate fit x %
dfs5.5, goodness of fit indexs0.77, standardized root mean squared residuals0.087, adjusted good-ness of fit indexs0.72, normed fit indexs0.81, non-normed fit indexs0.82, comparative fit index
.
s0.84 .
The initial measurement model was refined using
Ž
standard CFA refinement procedures Hair et al.,
.
1998; Koufturos, 1999 as follows. The itemrs with excessive standardized residuals and modification indices were identified and eliminated one at a time.
Ž 2
The absolute model fit indices GFI, x %df ratio,
.
SRMR were analyzed along with incremental and
Ž .
comparative indices AGFI, NFI, NNFI, CFI at each iteration. Researchers have cautioned against statis-tics-driven indefinite refinement without regard to the item’s relevance to the theory and content
valid-Ž .
ity Hair et al., 1998 . Thus, we stopped refinement upon attaining generally acceptable model fit
thresh-olds without a substantial reduction in the content validity of constructs. Four items were eliminated from the original 30 items. These are denoted in Appendix A with an asterisk. The loadings of indi-vidual retained items on corresponding constructs are indicated next to each item. Most of the loadings are above 0.6 suggesting that the items align well with their respective constructs.
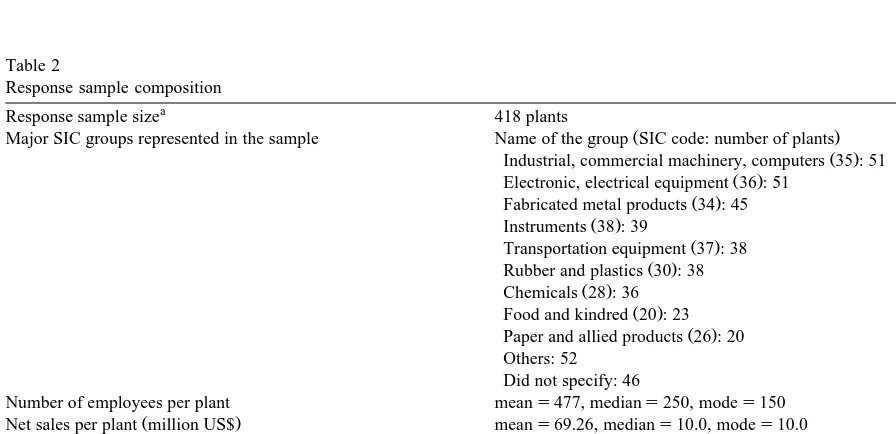
Table 3 summarizes the model fit of the final refined measurement model, scale descriptive
statis-Ž 2 . tics, and correlations. For large samples, x %df
ratios as high as 8, NNFI values as low as 0.86 and CFI values as low as 0.88 have been considered
Ž
adequate indicators of measurement model fit Doll
.
et al., 1998 . Thus, considering the large size and heterogeneity of our sample, the model fit indices
Žsee Table 3 demonstrate that the refined model fits.
the data well. Of the 15 scale correlations, 9 are below 0.50. In general, process quality management has high correlations with other constructs while product design performance has low correlations. The internal quality–external quality pair exhibits
Ž .
the highest correlation 0.75 . These ranges of corre-lations are high as would be expected for constructs in integrated quality efforts. They are comparable in ranges to correlations reported in other studies in
Ž .
quality management Ahire et al., 1996 .
5.2. ScaleÕalidation
Considering the high scale intercorrelations, sev-eral reliability and validity indices were computed to
Table 3
Descriptive statistics and scale intercorrelations of the refined measurement modela
Construct Number of Item, Item, Scale intercorrelations
items mean standard DM TRAIN PDP PQM INTQ EXTQ
deviation
Ž .
Design management DM 7 3.92 1.28 1.00
) )
Ž .
Quality training TRAIN 4 4.56 1.21 0.62 1.00
) ) ) )
Ž .
Product design performance PDP 2 3.81 1.43 0.40 0.33 1.00
) ) ) ) ) )
Ž .
Process quality management PQM 5 4.54 1.22 0.68 0.68 0.31 1.00
) ) ) ) ) ) ) )
Ž .
Internal quality INTQ 4 4.70 1.33 0.48 0.47 0.30 0.68 1.00
) ) ) ) ) ) ) ) ) )
Ž .
External quality EXTQ 4 4.73 1.24 0.47 0.46 0.28 0.66 0.75 1.00
a
Refined measurement model fit indices:x2rdfs3.50, GFIs0.87, SRMRs0.06, AGFIs0.85, NFIs0.90, NNFIs0.91, CFIs0.93.
)p-0.05,) )
P-0.01) ) )p-0.001,q
ensure that the refined scales represent reliable and valid measurements of the underlying constructs. Statistical validation of constructs includes specific assessment of convergent and discriminant validity
ŽHair et al., 1998 . However, unidimensionality and.
reliability of scales are prerequisites to assessment of
Ž
convergent and discriminant validity Carmines and
.
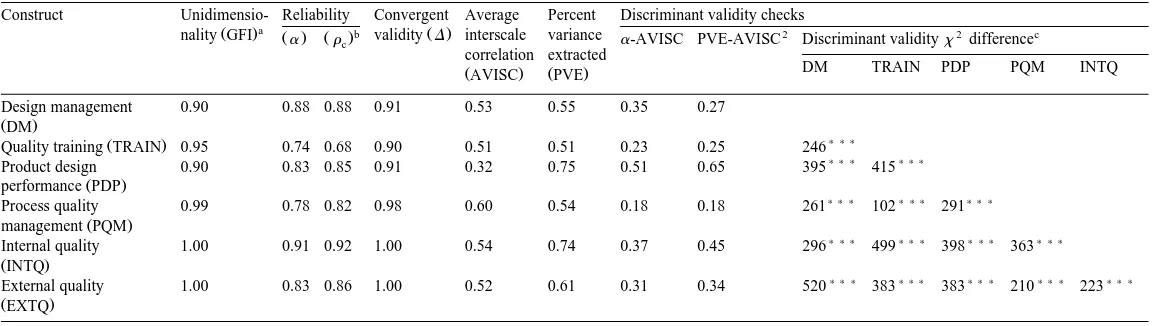
Zeller, 1979; Anderson and Gerbing, 1991 . Hence, indices of scale unidimensionality, reliability, cover-gent validity, and discriminant validity are reported in Table 4.
The unidimensionality goodness of fit index indi-cates the extent to which the scale items are strongly associated with each other and represent a single
Ž .
concept Hattie, 1985 . Typically, goodness of fit index values of 0.90 or higher indicate high evidence
Ž .
of unidimensionality Ahire et al., 1996 . All of the scales exhibited high satisfactory unidimensionality. Two scale reliability indices are reported: Cronbach’s
Ž . Ž .
a Cronbach, 1951 and Werts–Linn–Joreskog rc
Ž .
coefficients Werts et al., 1974 . Alpha values of 0.70 or higher and rc values of 0.50 or higher
Ž
provide evidence of good scale reliability
O’Leary-.
Kelly and Vokurka, 1998 . All of the refined scales have high values of both reliability indices.
Convergent validity is the extent to which varying approaches to construct measurement yield the same
Ž .
results Campbell and Fiske, 1959 . We report the
Ž .
Bentler–Bonett normed fit index D as a measure of convergent validity for each scale. All of the scales
Ž
exceed the threshold of 0.90 for this index Ahire et
.
al., 1996 .
Finally, the high scale correlations warranted careful assessment of discriminant validity of the constructs. Discriminant validity assesses the extent to which a concept and its indicators differ from
Ž
another concept and its indicators Bagozzi et al.,
.
1991 . Discriminant validity of constructs can be assessed in different ways. First, adequate discrimi-nant validity is established when the Cronbach relia-bility coefficient of each of the scales is adequately larger than the average of its correlations with other
Ž .
constructs Ghiselli et al., 1981 . Second, statistically distinct scales exhibit interscale correlations that are
Ž .
adequately different from 1.0 Bagozzi et al., 1991 .
Ž .
Third, if the percent variance extracted PVE by the scale items of a construct is consistently greater than the squared interscale correlations of the construct,
additional evidence for the discriminant validity of the construct with respect to all other constructs is
Ž .
established Fornell and Larcker, 1981 . Finally, nested measurement models involving pairs of
dif-Ž
ferent constructs one with a perfect correlation and
. 2
one with correlation free to vary can be run and x difference tested for significance. If the x2
differ-ence statistic is significant for 1 df, the two
con-Ž .
structs are statistically distinct Venkatraman, 1989 . The discriminant validity results summarized in Table 4 confirm that they adequately pass all of the afore-mentioned tests of discriminant validity.
Furthermore, we tested criterion-related validity of the exogenous and intermediate endogenous con-structs of the model. Criterion-related validity indi-cates the extent to which a measurement instrument estimates some important form of related behavior or result that is external to the measurement instrument
Ž .
itself Nunnally, 1978 . We assessed the criterion-re-lated validity of the input and intermediate outcome constructs using two additional numerical measures of operational quality, namely, overall rating of product quality within the industry and percentage of repeat customers. The overall rating of product
qual-Ž .
ity 1sworst-in-industry, 7sbest-in-industry
ex-Ž
hibits statistically significant correlations at p
-. Ž
0.01 with each construct design management: 0.40, training: 0.32, product design performance: 0.34, process quality management: 0.48, internal quality:
.
0.52, external quality: 0.45 . Percentage of repeat customers also indicates statistically significant
cor-Ž
relations with each construct design management: 0.22, training: 0.18, product design performance: 0.13, process quality management: 0.26, internal
.
quality: 0.18, external quality: 0.23 . Finally, the
Ž
correlations of the external quality construct the
.
final endogenous construct with product quality
rat-Ž . Ž .
ing 0.45 and percent repeat customers 0.23 fur-ther confirm the convergent validity of this critical outcome construct.
5.3. Subgroups measurement model analysis
()
S.L.
Ahire,
P.
Dreyfus
r
Journal
of
Operations
Management
18
2000
549
–
575
Table 4
Refined measurement scales validation indices
Construct Unidimensio- Reliability Convergent Average Percent Discriminant validity checks
a b 2 2 c
Ž . Ž .
nality GFI Ž .a Žrc. validity D interscale variance a-AVISC PVE-AVISC Discriminant validityx difference correlation extracted
DM TRAIN PDP PQM INTQ
ŽAVISC. ŽPVE.
Design management 0.90 0.88 0.88 0.91 0.53 0.55 0.35 0.27
ŽDM.
) ) )
Ž .
Quality training TRAIN 0.95 0.74 0.68 0.90 0.51 0.51 0.23 0.25 246
) ) ) ) ) )
Product design 0.90 0.83 0.85 0.91 0.32 0.75 0.51 0.65 395 415
Ž .
performance PDP
) ) ) ) ) ) ) ) )
Process quality 0.99 0.78 0.82 0.98 0.60 0.54 0.18 0.18 261 102 291
Ž .
management PQM
) ) ) ) ) ) ) ) ) ) ) )
Internal quality 1.00 0.91 0.92 1.00 0.54 0.74 0.37 0.45 296 499 398 363
ŽINTQ.
) ) ) ) ) ) ) ) ) ) ) ) ) ) )
External quality 1.00 0.83 0.86 1.00 0.52 0.61 0.31 0.34 520 383 383 210 223
ŽEXTQ. a
The GFI and Dvalues were obtained from first order single-scale measurement model runs.
b
Thercand PVE values were obtained from both single-scale and full measurement model runs.
c
Thex2 values were based on pairwise comparisons of scales.
)p-0.05,) )p-0.01,) ) )
()
Ahire,
P.
Dreyfus
r
Journal
of
Operations
Management
18
2000
549
–
575
563
Table 5
Subgroup analysis of the measurement model fit indices
2
Grouping criteria Subgroup Sample size x df p-value NNFI CFI
Overall model 418 969 277 0.00 0.91 0.93
Ž .
Firm size Small firms 250 or fewer employees 232 826 277 0.00 0.87 0.90
Ž .
Large firms more than 250 employees 186 659 277 0.00 0.89 0.91
Ž .
TQM duration Recent TQM implementers 3 or fewer years of TQM 127 760 277 0.00 0.80 0.83
Ž .
Experienced TQM implementers more than 3 years of TQM 284 767 277 0.00 0.92 0.93
a
Type of industry Low global competition, low logistical complexity, batch and 167 763 277 0.00 0.85 0.88
Ž .
process production SIC: 20 through 33
High global competition, high logistical complexity, discrete 224 684 277 0.00 0.92 0.94
Ž .
production SIC: 34 through 38
a Ž . Ž
Industry groupings adapted from the following sources: global competition Porter, 1991; Kotha and Vadlamani, 1995 , logistical complexity Schmenner, 1986; Funk,
. Ž .
to evaluate the model relationships for six specific subgroups corresponding to these contingency fac-tors: small versus large firms, recent versus experi-enced TQM implementers, and low versus high lo-gistical complexity. Firms were classified as small or
Ž
large using the cutoff of 250 employees Ahire and
.
Golhar, 1996 . TQM implementation duration of 3 years was used as the cutoff for classifying firms
Ž .
based on TQM duration. Schmenner 1986 and
Ž .
Funk 1995 classification was used to define firms as low or high logistical complexity firms based on their industry affiliation. As discussed in Section 3, we classify SIC groups 20 through 33 as low logisti-cal complexity industries and SIC groups 34 through 38 as high logistical complexity industries. This classification overlaps the classification of industries
Ž
on the basis of competition Porter, 1991; Kotha and
.
Vadlamani, 1995 and dominant production
pro-Ž .
cesses Swamidass and Kotha, 1998 . SIC groups 20 through 33 are characterized by relatively low com-petition and process type production while SIC groups 34 through 38 are high competition and discrete production industries.
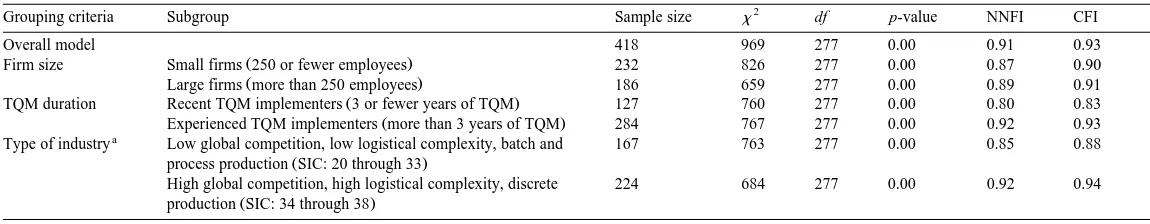
The overall measurement model provides a base-line for evaluating the invariance of measurement across the subgroups. Hence, it is necessary to evalu-ate its fit to the subgroup samples before evaluating
the path model and its invariance across subgroups
ŽMarsh, 1987; Bollen, 1989 . Following the recom-. Ž .
mendations of Doll et al. 1998 , we examined the adequacy of the baseline refined measurement model for each of the subgroups as follows. The measure-ment model was executed for each subgroup and NNFI and CFI values were used to assess the model fit. Table 5 summarizes the results of subgroup analysis. It is clear that the measurement model fits extremely well for small and large firms, more expe-rienced firms, and firms with high logistical com-plexity. The fit for low logistical complexity firms is also quite adequate and comparable to the fit indices
Ž .
reported by Doll et al. 1998 . Though the model fit for recent TQM implementers is inferior to the re-maining subgroups, two things should be noted. First, the lower subgroup sample size of recent TQM
Ž .
implementers Ns127 firms may have partially contributed to these low values. Second, the values
Ž . Ž .
of NNFI 0.80 and CFI 0.83 still exceed the
Ž
previously reported values NNFIs0.74, CFIs
.
0.79 qualifying a measurement model for ‘‘cautious
Ž .
interpretation’’ Doll et al., 1998 . These results demonstrate the overall adequacy of the baseline refined measurement model for the subgroups. All of these results enhance the confidence in the generaliz-ability of the measurement model for firms of
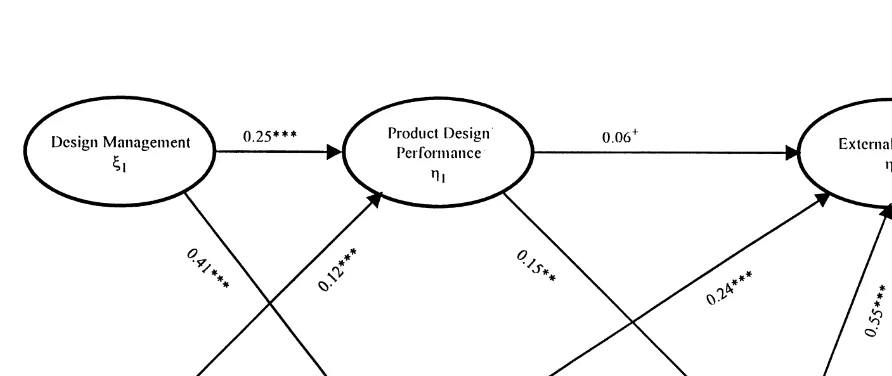
differ-Fig. 2. Model path significance results.) ) )p-0.001,) )p-0.01,)p-0.05,q
ent sizes, TQM experience, and industry affiliations. They lead the way for further analysis of the struc-tural path model.
6. Structural model results
Following the recommendation of Anderson and
Ž . Ž .
Gerbing 1991 and Hair et al. 1998 , the measure-ment model was validated first as summarized above, followed by structural model testing. The structural model hypothesized in Fig. 1 was executed using
Ž .
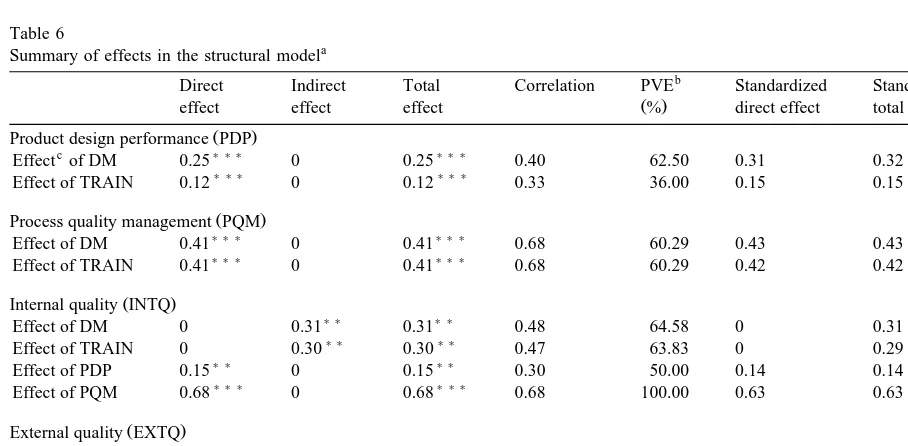
LISREL 8.2 Joreskog and Sorbom, 1998 . The esti-mates and significance of the path coefficients are presented in Fig. 2. Table 6 summarizes the results
Ž
of analysis. The absolute model fit indices GFI,
2 .
x %df ratio, SRMR and the incremental and
com-Ž .
parative indices AGFI, NFI, NNFI, CFI of the
structural model show that the hypothesized overall path model fits the data well. Also, the squared
Ž 2.
multiple correlations R of the endogenous con-structs indicate that the model explains a substantial
Ž .
amount of variance in external quality 64% ,
inter-Ž .
nal quality 47% , and process quality management
Ž57% . Product design performance has a relatively.
2 Ž .
low value of R 18% , but this is adequate and comparable to results reported in similar quality
Ž .
management studies Anderson et al., 1995 .
6.1. Path coefficients and hypotheses
Fig. 2 shows the estimates and significance of various hypothesized paths. The significance of
indi-Ž .
vidual path coefficients direct effects can be used to evaluate the hypotheses developed in Section 2. Note that with the exception of the product design
Table 6
Summary of effects in the structural modela
b
Direct Indirect Total Correlation PVE Standardized Standardized
Ž .
effect effect effect % direct effect total effect
Ž .
Product design performance PDP
c ) ) ) ) ) )
Effect of DM 0.25 0 0.25 0.40 62.50 0.31 0.32
) ) ) ) ) )
Effect of TRAIN 0.12 0 0.12 0.33 36.00 0.15 0.15
Ž .
Process quality management PQM
) ) ) ) ) )
Effect of DM 0.41 0 0.41 0.68 60.29 0.43 0.43
) ) ) ) ) )
Effect of TRAIN 0.41 0 0.41 0.68 60.29 0.42 0.42
Ž .
Internal quality INTQ
) ) ) )
Effect of DM 0 0.31 0.31 0.48 64.58 0 0.31
) ) ) )
Effect of TRAIN 0 0.30 0.30 0.47 63.83 0 0.29
) ) ) )
Effect of PDP 0.15 0 0.15 0.30 50.00 0.14 0.14
) ) ) ) ) )
Effect of PQM 0.68 0 0.68 0.68 100.00 0.63 0.63
Ž .
External quality EXTQ
) ) ) ) ) )
Effect of DM 0 0.29 0.29 0.47 61.70 0 0.30
) ) ) ) ) )
Effect of TRAIN 0 0.27 0.27 0.46 58.69 0 0.28
q ) ) ) )
Effect of PDP 0.06 0.09 0.15 0.28 53.57 0.06 0.13
) ) ) ) ) ) ) )
Effect of PQM 0.24 0.39 0.63 0.66 95.45 0.23 0.62
) ) ) ) )
Effect of INTQ 0.55 0 0.55 0.75 74.67 0.61 0.61
a
Model fit indices:x2rdfs4.80, GFIs0.98, SRMRs0.04, AGFIs0.91, NFIs0.98, NNFIs0.96, CFIs0.98. R2 values: external
Ž . Ž . Ž . Ž .
quality 0.64 , internal quality 0.47 , process quality management 0.57 , and product design performance 0.18 .
b
Ž .
Percent variance explained PVEstotal effectrcorrelation.
c
DM: design management, TRAIN: quality training, PDP: product design performance, PQM: process quality management, INTQ: internal quality, external quality.
)p-0.05,) )
p-0.01,) ) )
Ž .
performance–external quality link Hypothesis 2 all of the path coefficients of hypothesized paths in the
Ž
model are positive and highly significant most of
.
them at p-0.001 . Thus, 1, 3, 4, 5, 6, 7, 8, and 9 are strongly supported. The product design
perfor-Ž
mance to external quality causal hypothesis
Hy-.
pothesis 2 is relatively weakly supported at p-0.1
Žps0.08 . These results of the structural model.
hypotheses are summarized in Table 7.
6.2. Total effects and percentÕariance explained
Table 6 provides further information on indirect and total effects. Both design management and
train-Ž .
ing have significant indirect and total effects on internal quality and external quality. Process quality management has significant direct effect on external quality. In addition, it affects external quality signifi-cantly through its impact on internal quality. Interest-ingly, product design performance has a strongly significant indirect effect on external quality through its impact on internal quality. Thus, though there is
only weak support for the direct effect of product
Ž
design performance on external quality Hypothesis
.
2 , these results show that it does have an overall significant impact on external quality through its contribution to internal quality.
Following recommendations of Anderson et al.
Ž1995 , we computed the PVE for key construct pairs. Ž
of the model. PVE for a causal relationship for example, the direct path between training and pro-cess quality management or the relationship between design management and external quality through
in-.
termediate model linkages denotes the fraction of the total empirical correlation between two con-structs explained by the total effect of the affecting
Ž
construct on the affected construct Land, 1969;
.
Anderson et al., 1995 . Note that, with the exception
Ž
of training–product design performance PVEs
.
40% , the model effects explained more than 50% of correlation between key constructs. These results indicate that the measurement of constructs and con-ceptualization of the model relationships in the pro-posed model is adequate. They provide further em-pirical insights into the manner in which design and
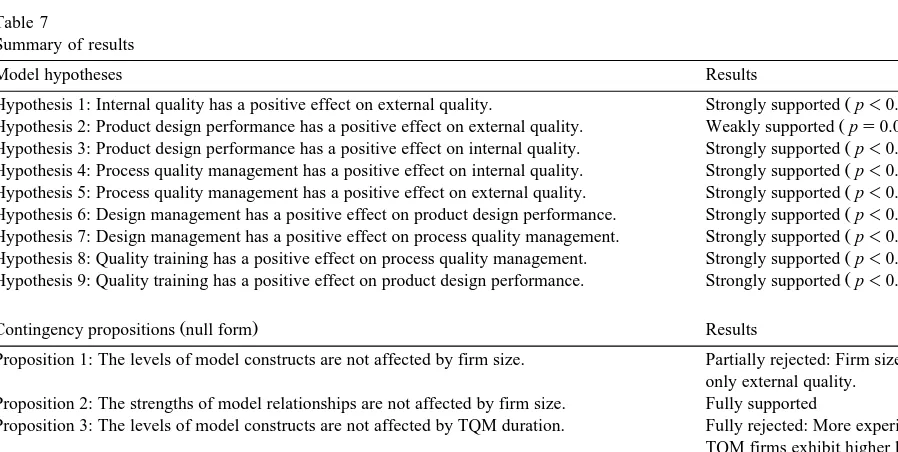
Table 7
Summary of results
Model hypotheses Results
Ž .
Hypothesis 1: Internal quality has a positive effect on external quality. Strongly supported p-0.001
Ž .
Hypothesis 2: Product design performance has a positive effect on external quality. Weakly supported ps0.08
Ž .
Hypothesis 3: Product design performance has a positive effect on internal quality. Strongly supported p-0.01
Ž .
Hypothesis 4: Process quality management has a positive effect on internal quality. Strongly supported p-0.001
Ž .
Hypothesis 5: Process quality management has a positive effect on external quality. Strongly supported p-0.001
Ž .
Hypothesis 6: Design management has a positive effect on product design performance. Strongly supported p-0.001
Ž .
Hypothesis 7: Design management has a positive effect on process quality management. Strongly supported p-0.001
Ž .
Hypothesis 8: Quality training has a positive effect on process quality management. Strongly supported p-0.001
Ž .
Hypothesis 9: Quality training has a positive effect on product design performance. Strongly supported p-0.001
Ž .
Contingency propositions null form Results
Proposition 1: The levels of model constructs are not affected by firm size. Partially rejected: Firm size affects only external quality.
Proposition 2: The strengths of model relationships are not affected by firm size. Fully supported
Proposition 3: The levels of model constructs are not affected by TQM duration. Fully rejected: More experienced TQM firms exhibit higher levels of all constructs vis-a-vis less`
process management strategies influence operational quality outcomes.
6.3. Standardized effects
Table 6 also summarizes the standardized direct and total causal effects in the model. Results point to several interesting empirical insights regarding the relative magnitude of influence of competing con-structs on a particular construct. First, the impact of design management on product design performance
Ž0.32. is more pronounced than that of training Ž0.15 . However, training and design management.
have similar impacts on process quality management
Ž0.42 and 0.43 . Second, both influence process qual-.
ity management more than product design perfor-mance. Third, design management and training have
Ž
about the same impact on internal quality 0.31 and
. Ž .
0.29 as on external quality 0.30 and 0.28 . Finally, internal and external quality are affected more by
Ž .
process quality management 0.63 and 0.62 than by
Ž .
product design performance 0.14 and 0.13 . The possible explanations for these results and their im-plications for TQM theory and practice are offered in
Ž .
the Discussion Section Section 8 .
7. Contingency analysis
The propositions presented in Section 3 consist of
Ž .
two parts. Propositions 1, 3, and 5 examine the invariance of the levels of the constructs across the subgroups based on firm size, TQM duration, and
Ž
logistical complexity, respectively. Propositions 2,
.
4, and 6 examine the invariance of the path relation-ships across the subgroups. To test the invariance of construct levels, we conducted a MANOVA analysis in SPSS 7.5. The invariance of path relationships and effects across the subgroups was tested by running multigroup analysis in LISREL 8.2.
7.1. MANOVA results
The conclusions about invariance of levels of the six model constructs based on MANOVA results of
effects of firm size, TQM duration, and logistical complexity on levels of the model constructs are presented in Table 7. Four indices of multivariate tests of significance are presented: Pillai’s trace, Wilk’s lambda, Hotelling’s trace, and Roy’s largest
Ž .
root Norusis, 1998 . Due to space limitations, we do not provide the detailed results of MANOVA. The values and significance of the indices indicated that firm size and TQM duration have a multivariate significant impact on the model constructs while logistical complexity does not. Moreover, firm size significantly affects only the external quality
out-Ž .
comes ps0.002 . TQM duration, however, has a consistent impact on each of the model constructs.
Ž
Thus, Proposition 1 invariance of construct levels
.
across firm size groups is rejected but it appears that firm size affects only external quality outcomes. On the whole, firm size does not affect the model
sub-Ž
stantially. Proposition 3 invariance of construct
lev-.
els across TQM duration groups is clearly rejected.
Ž
Note that experienced TQM firms more than 3 years
.
of TQM implementation exhibit a significantly higher score on each construct as compared to their
Ž
less experienced counterparts 3 or fewer years of
.
TQM . Thus, a firm’s TQM duration does appear to affect the intensity of implementation of the design and process management constructs and conse-quently the performance outcome levels. Finally, lack of significance of the multivariate statistics for
Ž .
logistical complexity industry type indicates that Proposition 5 cannot be rejected. Thus, the levels of design and process management constructs and their outcomes are invariant across different industry types.
7.2. Subgroup structural model analysis
To test if the model relationships vary across the subgroups, we conducted a four-stage analysis of path models for the various subgroups using LISREL
Ž .
8.2 Joreskog and Sorbom, 1998 . The detailed re-sults of the analyses described below are available with the principal author for interested readers. The
Ž
conclusions of the analyses in terms of testing
Pro-.