www.elsevier.nlrlocatereconbase
Returns to firm-provided training: evidence
from French worker–firm matched data
1Dominique Goux
), Eric Maurin
Centre de Recherche en Economie et Statistique, Timbre J310, Departement de la Recherche,´
15, bld Gabriel Peri, 92 245 Malakoff Cedex, France´
Received 2 February 1998; accepted 30 November 1998
Abstract
Using worker–firm matched data, we study the incidence and the effects of firm-pro-vided training in France. When we use the same kinds of data and models as the existing ones, the estimated impact of training on wages is as high in France as in other countries. When we build on the uniqueness of our French data and control for the selectivity of firms’ training practices, the estimated impact of training falls close to zero. The wage differentials observed across trained and untrained workers reflect that individuals who are the most likely to be placed in training programs are also those with the highest unmeasured abilities.q2000 Elsevier Science B.V. All rights reserved.
JEL classification: J24; J31
Keywords: Firm-provided training; Returns to training
1. Introduction
The idea that post-school training may be a remedy to labour market diseases is often found in the press and political debate. From the viewpoint of policy-makers, post-school training could be an instrument for increasing the flexibility of labour
)
Corresponding author. Tel.:q33-1-41-17-60-36; Fax:q33-1-41-17-60-46; E-mail: [email protected]
1
A previous version of this paper was presented at the CEPR Workshop «Rising Inequalities», La Coruna, 14r15 February 1997 and at the 1997 EEA meeting in Toulouse.˜
0927-5371r00r$ - see front matterq2000 Elsevier Science B.V. All rights reserved. Ž .
markets by providing workers with channels that would enable them to adapt to technical changes.
Even though most countries seem to agree on the necessity of post-school training, the approach varies greatly from country to country as to how to upgrade the skills of their adult work force. Each country tries to use its specific institutional and cultural advantages. In Germany, the system is characterized by a high level of cooperation between firms, workers and unions. Skills that are attained through this system are nationally recognized and certified. Unlike Germany, US training system is highly decentralized. No national system validates skills that are acquired outside the school system. On the other hand, Japanese institutions are more informal than the American or German ones with training being conducted mostly by seniors. In Japan, employers implicitly impose high costs on employees who quit their firms.
An increasing number of studies have been carried out on the German,
Ž .
Japanese and American systems Lynch, 1994 . On the contrary, very little has been done on the French system, which is rather unique in itself. In France, firms either have to train their workers or pay a tax. More specifically, each firm with more than ten employees has to devote a percentage of its total wage bill to training its employees. If the firm is unable to document its training expenses as being equal or greater to the minimum percentage imposed, it must pay the difference between its actual training expenditures and the minimum imposed training expenditures to public benefit training organizations. This system has been in place since 1971. The initial train-or-pay tax rate was 0.8% of the total wage bill; it rose to 1.2% in 1988 and is currently at 1.5%.
Why such a system? First, in France, the relationships between employers and unions are not as strong as they are in Germany. Second, the links between employees and their firms are much weaker in France than in Japan. Third, the French government traditionally plays an important role in regulating employment relationships. It compensates for the strained relationships between employers, workers and unions by intervening by way of its central administration. This administration has the power to make firms respect a pay-or-train system.
In our view, evaluating the French system provides some interesting insights into how training affects the labour market. In particular, the French system shows how wages and job mobility of lower-skilled workers could be affected in other countries if their governments required firms to spend more on training.2
Ž .
The French National Institute of Statistics and Economic Studies INSEE has recently conducted a survey on a representative sample of French workers, which gives the identification numbers of the employing firms both before and after
2
participation in training programs. The possibility of matching workers and their firms is unique to the French system. In all the other countries, the empirical analyses based on individual data are unable to match workers with the training
Ž
strategies of the employing firms see for instance the various studies in Lynch,
.
1994 . In particular, the origin of the observed impact of training on wages—does it reflect true returns to training or does it reflect the correlation between training and the firm-specific compensation policy—cannot be identified. Our data enable us to go one step further to examine the impact of post-school training on wages when we control for firm effects.
This paper is organized as follows. Section 2 describes the data. Section 3 presents the econometric model, which is a system of three simultaneous equa-tions: the first one describes training program selection; the second one describes post-training mobility; and the last one is a wage equation which includes training and post-training mobility as covariates. The system is recursive and we propose a two-stage estimation method. We analyse the results in Sections 4 and 5. Once we take into account the heterogeneity of firms’ economic performances and the selectivity of both training and post-training mobility, the estimated impact of training on wages is close to zero.
2. The data
The data used in this paper come from the French survey on Education and
Ž
Qualifications Enquete sur la Formation et la Qualification Professionnelle,
ˆ
.
hereafter FQP , which was conducted at the beginning of 1993 by the French
Ž .
National Institute of Statistics and Economic Surveys INSEE . The sample is made up of households. It was designed to represent the French adult population, 20 to 64 years old, at the time of the survey.3 The sample is stratified along three
Ž .
main dimensions: region, place of residence urban vs. rural , and number of adults living in the household. The stratification procedure and the sampling fractions are fixed so that each individual between the ages of 20 and 64 have the same probability of being in the sample. The sample yielded 12,640 households,
Ž .
of which 88.4% responded. The number of indiÕidual and useable responses
yielded 18,023 cases. The sample includes both males and females who are employed, unemployed or out of the labour force.
The following standard information is compiled for each interviewee: age,
Ž .
nationality, labour-market status employed, unemployed, out of the labour force ,
Ž .
occupation 4-digit index, 318 items , seniority, industry and size of the employing firm, school-leaving date, and educational attainment. In this study, labour-market
3
The only restriction is that the field consists of all conventional households residing in
metropoli-Ž .
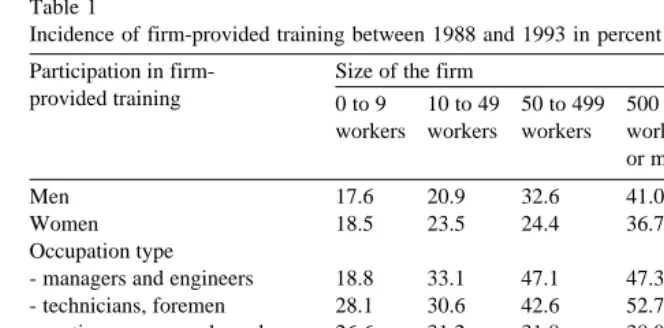
Table 1
Incidence of firm-provided training between 1988 and 1993 in percent
Participation in firm- Size of the firm Total Public Total
provided training 0 to 9 10 to 49 50 to 499 500 private sector workers workers workers workers
or more
Men 17.6 20.9 32.6 41.0 26.6 34.5 28.1
Women 18.5 23.5 24.4 36.7 23.8 31.6 26.3
Occupation type
- managers and engineers 18.8 33.1 47.1 47.3 33.4 33.2 33.3
- technicians, foremen 28.1 30.6 42.6 52.7 38.2 42.6 39.5
- routine non-manual employees 26.6 31.2 31.8 38.0 30.6 35.4 32.1
Žadministration.
- unskilled non-manual workers 8.0 15.0 18.5 20.6 12.4 15.4 13.1
- skilled manual workers 11.0 13.2 25.1 27.8 18.4 21.9 18.7
- unskilled manual workers 4.4 10.2 10.9 21.9 10.4 5.9 9.8
Total 18.0 21.8 29.4 39.5 25.5 32.9 27.3
Source: FQP survey, 1993, INSEE.
Field: wage-earners in 1988 and 1993, aged 20 to 64.
experience is measured by the number of years between leaving school and the survey date. The survey contains supplementary information on the workers’
Ž .
situations five years before the survey i.e., at the beginning of 1988 : labour-market status, occupation, seniority, industry and size of the employing firm.
The FQP survey also provides information on net annual earnings. Respondents
Ž .
are asked to give their wages for the year prior to the survey i.e., in 1992 . The
number of months spent in full-time or part-time jobs are also recorded.4 This
information is used to reconstruct the full-time equivalent annual earnings for each respondent.
Ž .
In the FQP survey, each respondent also reports 1 whether hershe
partici-pated in any employer-sponsored training programs between the beginning of
Ž .
1988 and the beginning of 1993 and 2 if hershe changed firms between the
beginning of 1988 and the beginning of 1993. If the respondent reports having participated in employer-sponsored training programs, hershe is asked to give the date of the last one. If the respondent changed firms, hershe is asked to give the date of hisrher departure from the 1988 firm. Some basic statistics are reported in Table 1.
The very interesting feature of the 1993 FQP survey is that it provides the
Ž .
current establishment identification number SIRET number for 80% of the
workers surveyed, and the 1988 establishment identification number for about the same number of respondents. This information is collected and coded in several
4
stages which are described in Appendix A. We used these identification numbers to match the FQP individual file with the Corporate Tax Return databases
(Benefices Industriels et Commerciaux, hereafter BIC . Each year, the French
´ ´
.administration gathers all the available information on the annual fiscal situation of the firms in the BIC database.
We matched the FQP file successively with five BIC databases, i.e., for 1988, 1989, 1990, 1991, 1992. For each given year, the match turns out to be successful for about 80% of the 1993 available identification numbers and for about the same number of 1988 identification numbers. The employers not included are very small firms that are not bound to the same fiscal declarations as the larger ones.
When an employer is both in a fiscal database and in the FQP survey, we can
Ž . Ž . Ž . Ž . Ž .
extract 1 the number of employees L , 2 the total wage bill W , 3 and thet t
Ž .
total operating income i.e., profit for the corresponding year t. We use this
Ž .
information in order to build 1 the profit per worker of both the 1988 and 1993
Ž . Ž .
employer between 1988 and 1992 i.e., PtrL , tt s1988, . . . ,1992 , 2 the mean
Ž
wage paid by these employers between 1988 and 1992 i.e., WtrL , tt s
. Ž .
1988, . . . ,1992 , 3 and the total growth employment rate of these firms between
Ž Ž . . .
1989 and 1992 i.e., LtyLty1 , ts1989, . . . ,1992 P , for each worker in thet FQP survey. As for the 1993 employer, we are also able to build the mean wage of
Ž Ž . Ž .
the co-workers in 1992 i.e., W92yW92 r L92y1 , where W92 is the 1992 wage
.
of the considered worker .
In the econometric exercise, we focus on workers who were in the private-sec-tor in 1988. Moreover, we only consider workers whose last participation in a continuous training program occurred in the 1988 firm between the beginning of 1989 and the beginning of 1992. To study the impact of training on earnings, it is indeed necessary to focus on training sessions which occur before the period that
Ž .
corresponds to the reported earnings i.e., 1992 . All in all, the size of the sample used in the econometric exercise is 4333. Information derived from the matched databases is available for about 60% of the workers in this sample.
3. The econometric model
Ž .
The FQP survey gives three basic categories of wage determinants: 1 those
Ž
that are unaffected by participation in continuous training i.e., gender, educational
. Ž .
level, age, size and industry of the firm providing the training, etc. ; 2 those that
Ž
can be affected by participation in continuous training i.e., individual position in
. Ž .
the occupational hierarchy, seniority ; 3 and participation in continuous training itself. To study the impact of participation in continuous training between the beginning of 1989 and the beginning of 1992, one simple strategy is thus to make
Ž .
an OLS regression of the 1992 wages on 1 the 1992 measurement of the
Ž .
determinants which are unaffected by continuous training, 2 the 1988
measure-Ž .
variable denoting participation in continuous training between the beginning of 1989 and the beginning of 1992.
Such an approach would be similar to most of the existing attempts to identify the impact of training. However, it still neglects several important issues.
First of all, workers are undoubtedly selected for training programs according to their measured and unmeasured abilities. If high unmeasured abilities deter-mine both wages and training program selection, we can observe higher wages for workers who receive training even if the training has no real impact on wages.
Ž
Second, the impact of training on the wages of stayers i.e., workers who do not
.
switch firms after participating in a training program is likely to be different than it is on the wages of movers. As for stayers, training specifically related to their positions in the firm can have a positive impact on their wages, whereas more general training may not have an impact at all. For movers, on the other hand, general training can have positive benefits on their value on the job market, whereas this kind of training may have absolutely no impact in their present company. Thus, we must consider post-training mobility as a potential determinant of the return to training and add both a mobility variable and a mobility-training interaction variable to the list of wage determinants.
Lastly, firms are most likely to train workers who are the least likely to quit or be fired after the training sessions. Thus, we can expect a negative correlation between being trained and post-training mobility. If this turns out to be the case and if a correlation exists between the unobserved determinants of mobility and wages, then the standard OLS estimates of the returns to training will still be biased, even if the unobserved determinants of training and wages are not correlated.
To address these basic selectivity issues, a wage model must be built with two selection criteria: training and post-training mobility. To be more specific, let Ti be the dummy that denotes that worker i was trained by his 1988-firm between the
beginning of 1989 and the beginning of 1992 and let M be the dummy thati
denotes that worker i left his 1988-firm. We will consider the following system of three simultaneous equations:
Tis1 if X1 ia1qu1 i)0 and Tis0 otherwise
Ž .
1Mis1 if X2 ia2qTibqu2 i)0 and Mis0 otherwise
Ž .
2log wisX3 ia3qTi sgqM Ti
Ž
i mg qfm.
q´iŽ .
3Within our framework, identification does not require any exclusion restrictions and can be achieved by functional form. Notice, however, that our data-set
Ž .
provides variables that influence T , but not Mi i i.e., X1oX . This in itself is2 enough to identifyb. Our data-set also contains variables that explain training and
Ž .
mobility, but not wages i.e., X1oX3 and X2oX . Again, this in itself is3
enough to identify theg and f coefficients.
More precisely, X includes variables that describe the economic performances1
Ž
of the firm in 1988, before training i.e., firm’s mean wage, operating income and
.
growth rate in 1988 while X only includes the variables that describe the firm’s2 performances from the same year as training. Lastly, X3 includes variables that describe the firm’s situation in 1992. We also include variables that describe the spouse’s occupational situation as specific determinants of mobility.
Ž .
The u , u ,1 i 2 i ´i triplets are assumed to be independent, identically and
normally distributed. V represents their variance–covariance matrix with:
1 r r1s
r 1 r s
Vs 2
2
r1s r2s s
The r, r1 and r2 parameters control for the simultaneity of the employers’
decisions. The unobserved factors that cause a firm to train a worker are likely to be those that also cause the firm to offer secure positions and promotions to the same worker.
There are several possible estimation methods for such a simultaneous equation model. It is possible to estimate all the parameters simultaneously using the maximum-likelihood technique. Such an approach is not difficult per se, but implies rather heavy computational burden. The model is recursive and we will follow a more comprehensive two-stage strategy. First, we will estimate the
Ž . Ž .
parameters that rule participation in training program T and mobility Mi i using
5 Ž .
a bivariate-probit model. This model provides estimates of l1 isE u1 irT , Mi i
Ž . Ž .
and l2 isE u2 irT , Mi i see Appendix B . Second, we shall estimate the wage
equation using l1 i and l2 i as supplementary independent variables in order to control for the selectivity of training and mobility. Within our framework, the
Ž Ž ..
selectivity bias i.e., E ´irT , Mi i is a simple linear combination of l1 and l2 i
Žagain, see Appendix B . Notice that, if. r is small, then the coefficient which
Ž . Ž .
corresponds to l1 i l2 i in the wage equation is proportional to r1 r .2
4. Results
Let us first consider the results of the bivariate model, beginning with the
Ž .
training equation Table 2 .
5 Ž .
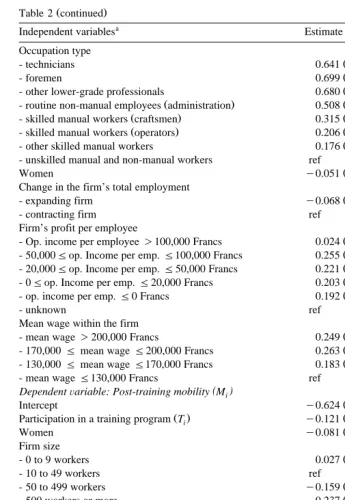
Table 2
Firm-provided training and post-training mobility. A bivariate probit analysis
a Ž .
Independent variables Estimate standard error
( ) DependentÕariable: participation in firm-proÕided training T
i
Ž .
Intercept y1.713 0.062
Industry
Ž .
- agriculture, food, meat and dairy products y0.233 0.059
Ž .
- building and construction y0.487 0.056
Ž .
- wholesale and retail trade y0.327 0.059
Ž .
- transportation, telecommunications and mail y0.022 0.063
Ž .
- other private sector services y0.228 0.048
Ž .
- real estate and credit agencies y0.162 0.139
Ž .
- 50 to 499 workers 0.297 0.035
Ž .
- 500 workers or more 0.353 0.035
b
Educational level
Ž .
- level 1 no diploma ref
Ž .
- experienceF5 years, seniorityF2 years ref
Ž .
- experienceF5 years, seniority 2 to 5 years 0.221 0.054
Ž .
- experience 5 to 10 years, seniorityF2 years 0.043 0.036
Ž .
- experience 5 to 10 years, seniority 2 to 5 years y0.010 0.047
Ž .
- experience 5 to 10 years, seniority 5 to 10 years 0.071 0.032
Ž .
- experience 10 to 20 years, seniorityF5 years 0.200 0.032
Ž .
- experience 10 to 20 years, seniority 5 to 10 years 0.060 0.030
Ž .
- experience 10 to 20 years, seniority 10 to 20 years 0.247 0.033
Ž .
- experience 20 to 30 years, seniorityF5 years 0.267 0.034
Ž .
- experience 20 to 30 years, seniority 5 to 10 years 0.068 0.035
Ž .
- experience 20 to 30 years, seniority 10 to 30 years y0.083 0.035
Ž .
- experienceG30 years, seniorityF5 years 0.151 0.030
Ž .
- experienceG30 years, seniority 5 to 10 years y0.079 0.095
Ž .
- experienceG30 years, seniorityG10 years y0.485 0.066 Occupation type
Ž .
- managers and other senior executives 0.439 0.050
Ž .
Ž .
- other lower-grade professionals 0.680 0.042
Ž . Ž .
- routine non-manual employees administration 0.508 0.049
Ž . Ž .
- skilled manual workers craftsmen 0.315 0.046
Ž . Ž .
- skilled manual workers operators 0.206 0.048
Ž .
- other skilled manual workers 0.176 0.051
- unskilled manual and non-manual workers ref
Ž .
Women y0.051 0.032
Change in the firm’s total employment
Ž .
- expanding firm y0.068 0.041
- contracting firm ref
Firm’s profit per employee
Ž .
- Op. income per employee)100,000 Francs 0.024 0.031
Ž .
- 50,000Fop. Income per emp.F100,000 Francs 0.255 0.054
Ž .
- 20,000Fop. Income per emp.F50,000 Francs 0.221 0.042
Ž .
- 0Fop. Income per emp.F20,000 Francs 0.203 0.049
Ž .
- op. income per emp.F0 Francs 0.192 0.049
- unknown ref
Mean wage within the firm
Ž .
- mean wage)200,000 Francs 0.249 0.060
Ž .
- 170,000Fmean wageF200,000 Francs 0.263 0.048
Ž .
- 130,000Fmean wageF170,000 Francs 0.183 0.038
- mean wageF130,000 Francs ref
( )
DependentÕariable: Post-training mobility M
i
Ž .
Intercept y0.624 0.045
Ž . Ž .
Participation in a training program Ti y0.121 0.336
Ž .
- 50 to 499 workers y0.159 0.041
Ž .
- 500 workers or more y0.237 0.042
b
Educational level
Ž .
- level 1 includes no diploma ref
Ž .
- managers and other senior executives 0.324 0.076
Ž .
- engineers and higher-grade professionals y0.043 0.066
Ž .
- technicians y0.075 0.074
Ž .
Ž .
- other lower-grade professionals 0.070 0.063
Ž . Ž .
- routine non-manual employees administration y0.021 0.045
Ž . Ž .
- skilled manual workers craftsmen 0.229 0.037
Ž . Ž .
- skilled manual workers operators 0.048 0.032
Ž .
- other skilled manual workers 0.131 0.036
- unskilled manual and non-manual workers ref Industry
Ž .
- agriculture, food, meat and dairy products 0.035 0.052
Ž .
- building and construction 0.403 0.050
Ž .
- wholesale and retail trade 0.334 0.047
Ž .
- transportation, telecommunications and mail 0.387 0.036
Ž .
- other private sector services 0.308 0.043
Ž .
- real estate and credit agencies 0.493 0.136
Ž .
- insurance y0.125 0.061
- banking and finance ref
Experience and seniority
- experienceF5 years, seniorityF2 years ref
Ž .
- experienceF5 years, seniority 2 to 5 years y1.180 0.083
Ž .
- experience 5 to 10 years, seniorityF2 years 0.758 0.064
Ž .
- experience 5 to 10 years, seniority 2 to 5 years y1.372 0.227
Ž .
- experience 5 to 10 years, seniority 5 to 10 years y0.153 0.072
Ž .
- experience 10 to 20 years, seniorityF5 years 0.322 0.054
Ž .
- experience 10 to 20 years, seniority 5 to 10 years y0.498 0.068
Ž .
- experience 10 to 20 years, seniority 10 to 20 years 0.122 0.053
Ž .
- experience 20 to 30 years, seniorityF5 years y0.121 0.050
Ž .
- experience 20 to 30 years, seniority 5 to 10 years y0.625 0.052
Ž .
- experience 20 to 30 years, seniority 10 to 30 years y0.043 0.047
Ž .
- experienceG30 years, seniorityF5 years y0.496 0.047
Ž .
- experienceG30 years, seniority 5 to 10 years y0.388 0.060
Ž .
- experienceG30 years, seniorityG10 years y0.171 0.069
Ž .
Profit per employee post-training
Ž .
- Op. income per employee)100,000 Francs 0.089 0.037
Ž .
- 50,000Fop. income per emp.F100,000 Francs y0.115 0.045
Ž .
- 20,000Fop. income per emp.F50,000 Francs y0.187 0.038
Ž .
- 0Fop. Income per emp.F20,000 Francs 0.054 0.036
Ž .
- op. income per emp.F0 Francs y0.008 0.035
- unknown ref
Ž .
Mean wage within the firm post-training
Ž .
- mean wage)200,000 Francs 0.184 0.035
Ž .
- 170,000Fmean wageF200,000 Francs y0.053 0.034
Ž .
- 130,000Fmean wageF170,000 Francs 0.034 0.037
Ž .
Table 2 continued
a Ž .
Independent variables Estimate standard error
Ž .
Change in the firm’s total employment post-training
Ž .
- expanding firm y0.308 0.031
- contracting firm ref
Gender and occupation of the spouse
Ž .
- man, manager, higher-grade professional y0.105 0.041
Ž .
- woman, manager, higher-grade professional 0.504 0.072
Ž .
- man, foreman, technician 0.211 0.028
Ž .
- woman, foreman, technician 0.198 0.032
- other occupation ref
Gender and degrees of the spouse
Ž .
- man, vocational training diploma 0.306 0.038
Ž .
- woman,vocational training diploma 0.118 0.036
Ž .
- man, no diploma or primary diploma y0.112 0.035
Ž .
- woman, no diploma or primary diploma 0.217 0.039
- other degrees ref
- single, divorced or widowed ref
Correlation
Ž .
Between Training and Mobility y0.171 0.186
Number of observations 4333
Log-likelihood y3771.1
Source: FQP survey 1993, INSEE.
Field: wage-earners, not civil servants in 1988.
a
In the training equation, the independent variables correspond to the situation in 1988. In the post-training mobility equation, the firm’s variables correspond to the training firm’s situation the same year the training takes place, while the worker’s variables correspond to the same year as in the training
Ž .
equation i.e., 1988 .
b
The educational levels are the following. Level 1: no diploma or the primary-school leaving diploma,
( .
now abolished CEP Certificat d’Etudes Primaires ; Level 2: The diploma at the end of fourth year of
( .
secondary school, the BEPC BreÕet d’Etudes du Premier Cycle ; Level 3: vocational training diploma,
Ž . Ž
mainly the CAP Certificat d’Aptitudes Professionnelles and the BEP BreÕet d’Etudes
Profession-.
nelles ; Level 4: baccalaureat, the advanced high-school leaving diploma; a prerequisite for admission´
Ž
into university; Level 5: two years of academic post-baccalaureat studies DEUG, Diplome d’Etudes´ ˆ
. Ž
UniÕersitaires Generales ; Level 6: two years of vocational post-baccalaureat studies DUT, Diplome´ ´ ´ ˆ
.
UniÕersitaire de Technologie, and BTS, BreÕet de Technicien Superieur , paramedical diplomas; Level´
Ž .
7: three or four years post-baccalaureat of academic studies licence, maıtrise ; Level 8: college´ ˆ graduates, Ph.D.
Ž .
Dependent variables: Participation in firm-provided training between 1989 and 1992 T ; Post-trainingi
Ž .
mobility M .i
depends on the firm’s mean wage: the higher the firm’s mean wage, the higher the frequency of training programs. In other words, the higher the average quality of the workforce, the higher the individual likelihood of receiving training.
On the contrary, the probability of being trained does not depend significantly on the firm’s profit per worker or the change in total number of employees. De facto, training is neither more or less prevalent in expanding or declining firms.
Ž .2 The probability of being trained depends strongly on the position within the occupational hierarchy. Interestingly, training efforts are not concentrated on occupations that are at the top or bottom of the hierarchy, but on those in the
Ž .
middle technicians, foremen, etc. .
Ž .3 When we consider workers with more than 20 years of experience in the
labour market, training turns out to be significantly more prevalent among low-seniority workers compared to those who have spent most of their career within the same firm. On the contrary, when we consider workers with less than 20 years of experience in the labour market, the probability of being trained is greater among high-seniority workers.
Ž .4 Training is the least prevalent among workers who have no educational
qualifications at all. There are no significant variations as to who participates in training programs among educated workers.
All in all, there are less variations in training probability in relation to the level
Ž .
of transferable human capital i.e., experience or education than to the firms’ characteristics or to the worker’s position in the occupational hierarchy.
Let us now consider the mobility equation.
Ž .1 Workers are more likely to leave small firmsŽ-50 employees than large.
Ž .
ones 50 employees or more . They are also more likely to leave firms that are downsizing than firms that are expanding. The firm’s overall performance has a greater impact on the probability of an individual leaving the firm than on him or her being trained.
Ž .2 Workers who hold managerial positions within the occupational hierarchy
are more likely to leave their firms than those in subordinate positions. However, the position in the occupational hierarchy has much less impact on the probability of an individual changing firms than on himrher being trained.
Ž .3 When we consider workers with more than 20 years of experience in the
labour market, changing firms turns out to be significantly less prevalent among low-seniority workers. On the contrary, when we consider workers with less than 20 years of experience in the labour market, the likelihood of them changing firms is stronger among those with the longest seniority.
Ž .4 The impact of training on changing firms is negative, but small and not
significantly different from zero.
Let us recall that this impact is identified because the variables that describe the
Ž
firm’s economic situation correspond to 1988 in the training equation i.e., a
.
Moreover, there are some more training determinants that do not belong in the set of variables that influence the likelihood of changing firms. For instance,
Ž .
training is much less frequent within very small firms i.e., -10 employees than within firms with 10–50 employees, while there is no significant differences between the exit rates of the workers from these two categories of firms. The incidence of training reaches its lowest level in the consumer-product industry, even though the workers within this industry are neither more nor less mobile than the workers of the other industries. Similarly, technicians and foremen are more likely to participate in continuous training than both unskilled and skilled workers, while they are neither more nor less mobile. In France, workers with no educa-tional qualifications are less likely to be trained than those with the lowest level of formal education, but are not more likely to change firms. All these differences contribute to the identification of the net impact of training on mobility.
The last significant result from our bivariate analysis concerns the estimated r coefficient: it is negative, but very small and not significantly different from zero. We can consider that important determinants of both training and mobility were not omitted.
Ž .
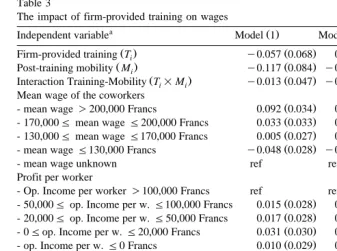
Let us now consider the wage equation Table 3, Model 1 .
Ž .1 The estimated gm, fm and gs are negative, but not significantly different from zero. As it turns out, French workers who received training between 1989 and 1992 did not earn more than the others in 1992.
Ž .2 There are no significant wage variations in relation to the profit per worker or to the firm’s growth rate. Workers did not earn more in high-profit firms than in low-profit ones. However, ceteris paribus, the higher the average wage of co-workers, the higher the individual worker’s wage.
Ž .3 The other estimated impacts are very standard and are not reported in the table. Wages are higher in large firms than in small ones, and they increase according to education or experience in the labour market.6
Ž .4 The estimated r1 is positive and significantly different from zero. The unobserved determinants of participation in firm-provided training programs turn out to be wage determinants. High-wage workers are more likely to be selected for a training programs than other workers.
The estimated r2 is positive, but not significantly different from zero. The
unobserved determinants for changing firms are only slightly correlated with wages.
In order to have an idea about the kind of bias that these correlations can induce, we have made supplementary regressions without the l1 i and l2 i
vari-Ž .
ables Table 3, Models 2 and 3 . Within this framework, the estimatedgs becomes
Ž .
positive, and is significantly different from zero about q7% . Using the same
6
When we add «time elapsed since training» as an additional explanatory variable for wages, we
Ž .
Table 3
The impact of firm-provided training on wages
a Ž . Ž . Ž .
Independent variable Model 1 Model 2 Model 3
Ž . Ž . Ž . Ž .
Firm-provided training Ti y0.057 0.068 0.066 0.020 0.071 0.020
Ž . Ž . Ž . Ž .
Post-training mobility Mi y0.117 0.084 y0.076 0.017 y0.075 0.017
Ž . Ž . Ž . Ž .
Interaction Training-Mobility Ti=Mi y0.013 0.047 y0.005 0.046 y0.008 0.046 Mean wage of the coworkers
Ž . Ž .
- mean wage)200,000 Francs 0.092 0.034 0.099 0.034 –
Ž . Ž .
- 170,000Fmean wageF200,000 Francs 0.033 0.033 0.038 0.033 –
Ž . Ž .
- 130,000Fmean wageF170,000 Francs 0.005 0.027 0.007 0.027 –
Ž . Ž .
- mean wageF130,000 Francs y0.048 0.028 y0.049 0.027 –
- mean wage unknown ref ref –
Profit per worker
- Op. Income per worker)100,000 Francs ref ref –
Ž . Ž .
- 50,000Fop. Income per w.F100,000 Francs 0.015 0.028 0.016 0.028 –
Ž . Ž .
- 20,000Fop. Income per w.F50,000 Francs 0.017 0.028 0.019 0.028 –
Ž . Ž .
- 0Fop. Income per w.F20,000 Francs 0.031 0.030 0.034 0.030 –
Ž . Ž .
- op. Income per w.F0 Francs 0.010 0.029 0.013 0.029 –
Growth rate of the number of employees
Ž . Ž .
- expanding firm y0.003 0.024 y0.002 0.024 –
- contracting firm ref ref –
Ž .
Number of parameters 453 451 442
Sample size 4333 4333 4333
Source: FQP survey, 1993, Insee.
Field: wage-earners in 1988 and in 1993, not civil servants.
a Ž .
Each model also includes also the following explanatory variables not reported in the table :
Ž . Ž .
experience in 1988 and seniority in 1988 14 dummies , nationality French, foreign , place of
Ž . Ž .
residence Paris, non-Paris , gender, industry of the employing firm 96-heading classification , 5 firm size dummies, 318 occupation type dummies, 8 educational-level dummies. Standard errors are in parentheses.
Ž .
To estimatel1and l2, we used the probit model presented in Table 2 see Appendix B .
Ž .
French survey and analysing standard OLS regressions, Hocquet 1997 has
reported similar estimates.
Thus, when we do not control for training and mobility selectivity, French data
Ž .
yield results which lie between those reported by Pischke 1996 for Germany and
Ž .
those reported by Blanchflower and Lynch 1994 for the United States, or by
Ž .
Groot et al. 1994 for the Netherlands. Using German panel data and individual
Ž .
fixed effect models, Pischke 1996 analysed a three-year period and reported a return to company-provided training programs of 2% for men and 5% for women.
Ž .
Blanchflower and Lynch 1994 report a return to company-training of around 12% in the United States, when analysing the earnings of non-college graduates at
Ž .
of Dutch workers with the same observed characteristics from 1953, Groot et al.
Ž1994 estimate that, in 1983, employees who had participated in company-train-.
ing programs earned around 11% more than the others.
5. Discussion
As it turns out, participation in firm-provided training has no real impact on wages. To what extent does this result reflect the special features of the French system? For instance, can we argue that this result reflects the French scheme as being peculiarly selective?
According to a recent survey conducted by Eurostat on the European Commu-nity, participation in firm-provided training is almost four times higher in firms
Ž
with more than 1000 employees than in those with 10–50 employees see Kerr,
.
1996 . The same survey shows that the incidence of firm-provided training in
Ž
Europe is six times higher in white-collar industries finance, insurance or energy
. Ž .
industries than in blue-collar industries consumer-product sector, construction .
Ž .
Knoke and Kallenberg 1994 report that the same results hold true for the United States. In particular, large US firms provide much more training than small ones. Thus, the strong variations in training practices across firms and industries do not seem to be a distinctive feature of the French system.7
De facto, the French scheme lowers the marginal training costs for all workers in firms with more than ten employees, regardless of their occupations. Firms receive no special incentive for training certain categories of workers over others.8 Furthermore, the same legal constraints are applied to all firms, whatever
their size or industry. The objective of this scheme is to encourage uniform increases in firm-provided training rather than to modify the distribution of training efforts across the different categories of firms and workers.
Concerning the zero-impact of training on wages, it can be argued that French firms are given incentive to provide cosmetic training scheme that have little impact on productivity. De facto, they lose money when they do not give the impression that they train their employees. The zero-impact would reflect the peculiarity of the French system that encourages training even when it is not needed.
7 Ž .
Kerr 1996 does not report specific figures about inequalities in training opportunities across
Ž .
occupations within the different industries. However, according to Pischke 1996 , the German white-collar workers receive a lot more training than German blue-collar. In France and Germany, the probability of being trained depends on the individual’s position in the occupational hierarchy as much as on the size of the firms.
8
In this respect, the French system is different from those whose training courses are directed
Ž .
It is somewhat difficult to follow this argument. First, about 28% of the workers from the French private-sector are in firms with less than ten employees. These firms are not bound by the legal constraints. Second, according to the French Labour Ministry, firms with more than ten employees that spend more than the legal 1.5% represent each year about 60% of the total number of workers in
firms with more than ten employees.9 Lastly, the firms with more than ten
employees that do not spend anything—and pay the 1.5% tax—represent about 5% of the same total. All in all, about 80% of the workers from the French
Ž
private-sector are either in firms that are not concerned by the law -10
.
employees or in firms with more than 10 employees that either spend more than required by law or nothing at all. Thus, each year, the vast majority of workers are in firms which training efforts are no doubt pertinent and certainly not cosmetic. The zero-return result is much more likely to be linked to selectivity than to the particularities of the French system and data. When we do not build upon the special features of our matched worker–firm database, we find that training has an impact on wages highly similar to those already found in other countries.
Ž .
From a theoretical standpoint, Becker 1964 shows that within a competitive context, firms are not likely to provide training programs that improve the market value of their workers: the more transferable the training investment, the more difficult it is to receive a return on it. Competitive firms are the most likely to sponsor training programs that increase non-transferable skills and have no impact on the workers’ market value and wages. Perhaps a more sophisticated model could explain that employer-provided training actually improves wages, but the basic human capital model does not seem to hold true for this hypothesis. A more surprising result would be to find that that firm-provided training has no real impact on the firms’ performance. Further research is still needed to explore this issue.
6. Conclusion
Concerning the impact of training on wages, our study yields three main
Ž .
results: 1 When we use the same kinds of data and models as the existing ones, we find that French workers earn about 5% more after a training period. This is a rather standard result.
Ž .2 When we build on the uniqueness of our French data and control for both
the selectivity of firms’ training practices and the selectivity of post-training mobility, our estimated returns to training fall close to zero. Most of the wage differential observed across trained and untrained workers reflects that workers who are the most likely to be chosen for training programs are also those who
9
have the highest unobserved abilities. This result holds true for both stayers and movers.
Ž .3 Firm-provided training lowers the probability of employees switching firms.
However, the net impact of training on mobility is small and not significantly different from zero.
These results do not mean that firm-provided training does not improve productivity. They only suggest that training mostly benefits employers. We need further research to analyse the firms’ performance and to test this hypothesis.
In this paper, we do not differentiate training programs according to the acquired qualifications. Further research is needed to further explore whether the selection process and the impact of training vary across the different training categories.
Appendix A
Ž
The respondents give their work address and its identification number if they
. 10
know it . The data are entered into a computer, then assembled at a computing
centre in Nantes for collation with the official national business register, SIRENE. In nearly 60% of the cases, the information gathered from the respondent offers an instant, straightforward match with a single establishment in the official register. For all these cases, the national centre extracts the relevant information on the employer from SIRENE which is then used to enhance the final FQP file. In other words, the information on establishments and companies that appears in the final
Ž .
file including location, industry, and SIRET number is taken from the legal register, not from survey respondents. In about 20% of the cases, the information obtained from the respondent matches two possible establishments in SIRENE. Typically, they are establishments from the same company with similar or identical addresses. For these occurrences, the coding centre lists the two possible responses; it is up to the INSEE survey local managers to choose the most likely case. Here as well, the employer’s information incorporated into the survey file is derived from the official register, not from the statements of the workers surveyed. In the 20% or so remaining cases, the address given by the respondent is incorrect or incomplete, preventing the work establishment from being identified. It should be noted that all the employer identification numbers chosen comply with a dual arithmetic constraint.11 No identification number can be transferred to the FQP
10
SIRET numbers appear on pay slips.
11 Ž .
The establishment identification number SIRET number comprises 14 digits, of which the first
survey file unless it meets that constraint, so coding errors are highly improbable. Concerning the firm in 1988, the identification stages for the 1988 work address are quite the same as for the current work address. During the interview, the respondents are asked the address of the establishment where they work in 1988.
Appendix B
First, using the same notations as in the text, we have:
E
Ž
´irF , Mi i.
su l1 1 iqu l2 2 iŽ
B1.
Second, if Djm i denotes the dummy variable whose value is one when
Žy1.mŽX a qu .is positive, we can write:
1; D21 is1 . The estimation of these variables is a joint-product of the bivariate-probit. We can use the following formula:
yyrx xyry
where w is the probability density function and f the cumulative distribution
function of the standard normal distribution, whilef2 is the cumulative distribu-tion funcdistribu-tion of the standard bivariate normal distribudistribu-tion.
References
Becker, G.S., 1964. Human Capital: a Theoretical Analysis with Special Reference to Education. Columbia University Press, New York, for NBER.
Blanchflower, D.G., Lynch, L.M., 1994. Training at Work: A Comparison of U.S. and British Youths.
Ž .
In: Lynch, L.M. Ed. , Training and the Private Sector: International Comparisons. University of Chicago Press, Chicago, for NBER.
Groot, W., Hartog, J., Oosterbeck, H., 1994. Returns to Within-company Schooling of Employees: The
Ž .
Netherlands. In: Lynch, L.M. Ed. , Training and the Private Sector: International Comparisons. University of Chicago Press, Chicago, for NBER.
Hocquet, L., 1997. Vocational Training and the Poaching Externality: Evidence from France. Oxford Institute for Economics and Statistics, Discussion Paper 12, January.
Ž .
Westergard-Nielsen, N. Eds. , Panel Data and Labour Market Dynamics. North Holland, Amster-dam.
Kerr, 1996. Continuous Vocational Training in Enterprises-An Essential Part of Life-long Learnings, Statistics in Focus 7, Eurostat.
Knoke, D., Kallenberg, A.L., 1994. Job training in U.S. organizations. American Sociological Review 59, 46–537.
Ž .
Lynch, L.M. Ed. , 1994. Training and the Private Sector: International Comparisons. University of Chicago Press, Chicago, for NBER.
Lynch, L.M., 1992. Private-Sector and the Earnings of Young Workers. American Economic Review 82, 299–312.