www.elsevier.com/locate/dsw
Constructing a correlated sequence of matrix exponentials with
invariant rst-order properties
Kenneth Mitchell
Computer Science Telecommunications Program, University of Missouri – Kansas City, 5100 Rockhill Road, 57OC STB, Kansas City, MO 64110, USA
Abstract
In this paper, we demonstrate a method for developing analytic Markovian trac sources in which the correlation structure can be arbitrarily constructed leaving the marginals invariant. We construct a simple model based on empirical data sets and show the eects of changing the autocorrelation on the behavior of network trac. c2001 Elsevier Science B.V. All rights reserved.
Keywords:Autocorrelations; Matrix exponential Distributions; Arrival processes; Communications networks; Markov modeling; Queueing theory
1. Introduction
Models of networks using the assumption of re-newal arrival trac frequently result in buer designs which may signicantly under-predict losses when compared with actual trac conditions [8,20]. Short-and long-range dependencies have been observed in LAN trac [8] as well as TCP applications over wide-area networks [6]. VBR video trac in particular has been shown to have strong correlations [1,19,21]. These correlations cause much higher buer over-ow than that predicted in most analytic models. The degree of such impact and how the autocorrelation structure can be incorporated into performance mod-els of these systems is not clear. Attempts to quantify the impact of autocorrelated network trac have been
E-mail address:[email protected] (K. Mitchell).
made dicult due to the fact that most analytic trac source models have not been able to isolate the eects of the autocorrelations from the marginals.
To shed some light on this important problem, we examined one of the Bellcore Ethernet traces produced by Leland and Wilson et al. In 1989 and 1990, Leland and Wilson [11] collected traces of several hundred million Ethernet packets from Bellcore’s Morristown Research and Training Center. These packet traces formed the basis of the conclusion in several papers [9,10,25 –27], that renewal models of network trac may poorly reect the actual trac in communications networks.
Eramilli [2] performed simulation experiments in which the inter-arrival times of the Bellcore data were shued, allowing him to isolate the eects of the near-range and long-range autocorrelations on buer occupancy. Shuing the data in dierent ways
destroys either the near-range or the long-range auto-correlations. The actual inter-arrival times, and there-fore the marginal distribution of the empirical trace, is not aected. These experiments, along with our own [14], demonstrate that it is the ordering of the inter-arrival times which aects the autocorrelation structure. With this in mind, we set out to develop analytical source models in which we can control the autocorrelations analytically while leaving the marginals invariant. The resulting process is similar to the discrete autoregressive (DAR) model discussed in Heyman et al. [3] and the transform expand sample (TES) process discussed in Jagerman [4]. This model, however, is a continuous time analytic model and lends itself readily to Markov chain analytic techniques [15].
In Section 2, we briey describe our techniques for creating correlated sequences of matrix exponential processes which leave the marginals invariant. In Sec-tion 3, we apply these techniques to construct a simple two state Markovian model of Ethernet trac. Section 4 shows some results of our studies and we conclude the paper in Section 5.
2. Constructing correlated processes
2.1. Matrix exponential distribution
A matrix exponential (ME) distribution is dened [12] as a probability distribution with representation (p;B;e), i.e.,
F(t) = 1−pexp(−Bt)e′
; t¿0; (1)
wherepis the starting operator for the arrival process, Bis the process rate operator, ande′
is a summing op-erator. The minus sign in exp(−Bt) represents a nat-ural generalization from a scalar exponential process to a vector process. The order of the representation is indicated by the dimension of the matrix B, and the degree of the distributionF(t) is the minimal order of all its representations. Thenth moment of the matrix exponential distribution is given by
E[Xn] =n!pVne′
; (2)
whereV is the inverse ofB.
The class of matrix exponential distributions is iden-tical to the class of distributions that possess a rational Laplace–Stieltjes transform. Matrix exponential
distri-butions are dense in the set of all distridistri-butions, soany distribution can be approximated arbitrarily close with a matrix exponential distribution. The class of ma-trix exponential distributions is closed under mixtures, convolutions, and order statistics of such distributions. A matrix exponential distribution may have an un-derlying probabilistic interpretation (i.e. a phase-type distribution), but is not necessarily limited to such an interpretation. Phase-type distributions form a proper subset of matrix exponential distributions.
A representation is not unique. If F(t) has repre-sentation (p;B;e) then (pX;X−1BX;X−1e) is also
a representation for any non-singular matrix X. The only limitations on (p;B;e) stem from the requirement that F(t) must form a distribution function. Conse-quently, (pe′
) is a real number between zero and one and the eigenvalues ofBmust either be positive reals or must come in complex conjugate pairs with a pos-itive real part. As there are no prescribed structural or domain restrictions on the components (p;B;e), one can choose a physically based representation (i.e. phase-type), or an algorithmic representation.
2.2. Matrix exponential sequence
A sequence of ME random variablesT1; T2; : : :such
that the joint probability density over any nite se-quence of consecutive inter-event times is given by
fT1;T2;:::;Tn(t1; t2; : : : ; tn)
=(0)exp(−Bt1)Lexp(−Bt2)L· · ·exp(−Btn)Le ′
;
(3)
where(t) is a vector representing the internal state of the process at timet. The matrixLis the (non-zero) event transition rate operator which generates an event and starts the next interval in the appropriate starting state. All matrices and vectors are assumed to be of nite dimension m. This process is interpreted as a stream of events (in this case, successive departures from a matrix exponential process) occurring at times
t1; t1+t2; t1+t2+t3; : : :, and inter-event timest1; t2; : : : :
Note that if the rank ofL is one, then the sequence (T1; T2; : : : ; Tn) is a renewal process. An innitesimal
characterization of the vector process(t) analogous to the Poisson process is given by Lee et al. [7].
t+hthe system will be in state vector(t+h) = (t)(I−Bh+ o(h))
• If at time t the system is in state vector(t) and a single event occurs between t and t +h, then at time t +h the system will be in state vector (t+h) =(t)(Lh+ o(h))
This allows the closed-form representation of the state of the system to be (t) =(0) exp(Q∗
t), for
t ¿0, whereQ∗
=L−B.
There are several ways in which such a sequence can be constructed. For illustrative purposes we use a “phase-type” viewpoint and review the construction of a Markov arrival process (MAP). We start with a continuous time Markov chain with rate matrix Q∗ and invariant steady-state vector,, with
Q∗=0; e′
= 1: (4)
Depending on the application, certain transitions rep-resent events of interest. By putting these in a matrix L, we can writeQ∗
Internal transition rates are represented by the progress rate operator B and represent transitions that arenot of special interest. The vector describing the state of the process immediately after a special event de-pendson the state immediately before the event and the transition which created the special event, thus (t+) =(t)L. The process just described is a MAP
withD0=BandD1=L, see Neuts [17,18].
A correlated sequence of matrix exponentials is more general than a MAP in that we allow imaginary phases to exist (i.e. Coxian distributions). The ele-ments of the vectors(t), and matricesBandLmay not have a probabilistic interpretation, but vector val-ued functions on the state(t) do. The matricesBand L which we construct are of the form which can be used directly in vector balance equations for Marko-vian queueing models. For details see [12,16,24]. The joint density function of the rst n-successive inter-arrival intervals is a sequence of matrix expo-nentials with representation given in Eq. (3).
We assume that the process is in equilibrium, the steady state being represented by the vector . In equilibrium, the starting vector (0) is the steady
state at embedded arrival points and is denoted by the vectorp,
p= L
Le′: (7)
The vectoris also the residual vector for the process till the next event and is related topby the expression
=pV; (8)
whereVis the inverse ofB, andis the mean arrival rate for the process.
The covariance of the sequence of matrix exponen-tials (3) is given as
cov[X0; Xk] =pV(VL)kVe ′
−(pVe′
)2: (9)
See Lipsky [13] for a complete derivation or [16,18] for a short review. If the process is assumed to be covariance stationary, the autocorrelation is obtained by dividing cov[X0; Xk] by the variance
var[X0] = 2pV2e
′
−(pVe′
)2: (10)
Dene the matrixY as
Y=VL (11)
and note that the autocorrelations decay matrix geo-metrically aspVYkVe′
. Note in particular thatLonly appears in the autocorrelation equation andnotin the moment equation (2). A renewal process can be ex-pressed as an uncorrelated sequence of matrix expo-nentials (3) by making the following assignments:
Lr:=Be ′
p; (12)
(0):=p: (13)
The rank of the Lr operator is 1 as a result of the
product of the column vectore′
and the row vectorp.
2.3. Constructing a correlated process with invariant marginals
Generally, we want to construct a correlated se-quence with varying autocorrelations from known point processes. Let a given matrix exponential distri-bution induce a renewal sequence (p;B;e) which can be represented as a sequence of uncorrelated matrix exponentials using (12) and (13). An autocorrelated process can then be constructed by introducing anL
First, nd the residual vector () for renewal ver-sion of the process using Eq. (8). Using Eqs. (6) and (12) constructQ∗
=Be′
p−B. Now consider the equa-tion Q∗
= 0. For a givenQ∗
its solution is unique, but for a given , the solution is not, and eachQ∗ which satises the equation results in a process with a dierent autocorrelation structure as it leaves ,p, andBinvariant.
We are interested in developing parsimonious mod-els, so we start with a single parameter, leading to a geometrically decaying covariance. Dene the opera-torLby
We now show that the marginal density of thekth ran-dom variablefTk(tk) at equilibrium remains invariant
for any; −16 ¡1. The expression for the marginal density of the kth random variable in a sequence of matrix exponentials from Eq. (3) is
fTk(tk) =
Using the denition ofY(16), the following
expres-sions are obtained:
Substituting expressions (18) and (19) into (17) yields
fTk(tk) =pexp(−Btk)Le
Therefore the marginal distribution is invariant with respect to.
For any value of−16 ¡1, the vectors,p, and the operatorBremain invariant. We callthe measure ofpersistenceof the process, and as→1, the slope of the decay of the autocorrelations decreases. Also, as
→1, the time spent in each state increases although theproportionof time spent in each state remains the same. When= 0, the process is a renewal process andY=Yr=e′p. For ¡0, the lag autocorrelations
alternate in sign.
The renewal operatorYr=e′p has a single
eigen-value of pe′
= 1 and an eigenvalue of 0 with mul-tiplicity m−1, wherem is the order of representa-tion. The correlated operator Y has a single
eigen-value of 1 and eigeneigen-valueof multiplicitym−1. Thus Yk
= (1−k)e ′
p+kI.
The expression for the lag-k autocorrelation be-comes
corr[X0; Xk] =ck; (21)
where the constantcis
c= (pV2e′
−(pVe′
)2)=(2pV2e′
−(pVe′
)2): (22)
The allowable values for are bound such that
−16 ¡1 and|c|61. In this paper we will assume 06 ¡1.
3. Constructing a two-state correlated process from empirical data
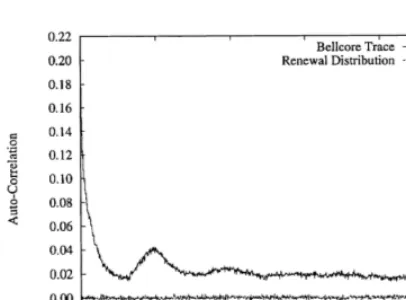
Fig. 1. Inter-arrival time autocorrelation comparison.
Fig. 1 shows the packet inter-arrival time autocor-relation in one of the Bellcore Ethernet traces. Packet inter-arrival time autocorrelation is plotted to lag-1000 together with that of a renewal stream constructed from the marginals. Clearly, an analytical model with a renewal arrival stream will not be an eective surro-gate for a system with autocorrelated arrivals such as those found in the Bellcore Ethernet packet trace, even if the renewal stream matches the rst-order statistics of the Bellcore trace.
The slow rate of decay in autocorrelations is sig-nicant. Erramilli [2] found the rate of decay in long-range-dependent trac to be a power of the lag time. This characteristic cannot be duplicated in any Markovian source model, but only approximated to some extent.
Recent papers however have shown that long-range dependency in trac does not always dominate per-formance. Jelenkovic [5] has observed what are called weakly stablesystems in which arrival processes have states which generate trac with mean inter-arrival times that are shorter than the mean system service time. In this scenario the short-range dependencies tend to dominate. Models which use heavy tailed dis-tributions to modulate sources exhibiting long-range dependency have also found these tendencies in what have been termed asblow uppoints [22,23]. Based on these observations, it may be possible to limit the den-sity of the tail (and thus the order of representation) in the modulating process. In this example we show that reasonable approximations can be constructed which perform well over a wide range of conditions.
Table 1
Autocorrelation lags and correspondingvalues
Model lag
1 0.58003
10 0.88248
100 0.96949
1000 0.99675
Using standard techniques, we computed a
phase-type hyper-exponential (H2) distribution taken
from samples of the Bellcore trace. For our example, we use a matrix exponential representation (p;B;e). Thus,
The renewal process represented by Eqs. (23) – (25) above has= 1:0 andC2
x = 3:223610. Now we want
to make a matrix exponential point process with a specic autocorrelation structure. Using Eq. (16), the expression forYis
Y= (1−)e By adjusting the values for, we obtain matrix ex-ponential point processes with varying autocorrelation structures. Since the Bellcore trace has been shown to exhibit long-range dependencies, the lag autocorrela-tion of our model will always drop below that of the empirical data at some point. Table 1 shows the val-ues for these varying autocorrelation lags at which our model intersects and falls below that of the empirical trace.
4. Numerical results
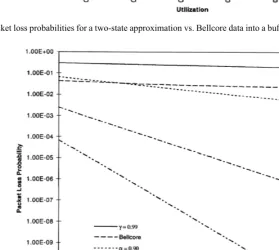
Fig. 2. Log. plot of packet loss probabilities for a two-state approximation vs. Bellcore data into a buer of size 100 with an exponential server.
trace. This gure shows that as the autocorrelation lag increases, losses from the G=M=1=k model increase. Losses from the renewal inter-arrival stream remain very low. It is important to note that when the analyti-cal model matches the lag-1 autocorrelation (=0:58), losses are still very low. For this particular trac it appears that matching the slope of the decay of the autocorrelations farther out in the tail are more im-portant than matching the lag-1 autocorrelation. Also, the range of losses experienced in the analytic model is the result of altering the autocorrelation structure only. The marginal distribution remains exactly the same.
Fig. 3 shows packet loss probabilities from a sim-ulation model of theG=M=1=ksystem and utilization
= 0:7 with our analytic model for buer sizes in the range of 50 –150. This gure shows that a value of
can be chosen such that the performance behavior can be closely modeled in the range of buer sizes under study. In fact, the decay of the autocorrelations in the analytical model can be made as arbitrarily close to 0 as possible, making the modeling of the behavior of large buers possible. For a value of= 0:99, packet loss probabilities are overestimated, but the slope of the decay in packet loss probabilities most closely matches that of the Bellcore Ethernet trace. Of course, as with any Markovian model which tries to approx-imate long-range-dependent behavior, the slope will eventually diverge from that of actual empirical data.
5. Conclusion
To be eective, models must incorporate the second-order statistics (autocorrelations) of the sys-tems they purport to emulate. We have developed techniques to allow correlated source models to be constructed which allow the autocorrelation structure to be modied while leaving the marginals invari-ant. The trac we have studied has been shown to have long-range dependencies and it is evident that matching the lag-1 autocorrelation is not enough. It appears that matching near-term autocorrelation is not as important as matching the slope of the decay of the autocorrelation structure at some point farther out in the tail.
References
[1] J. Beran, R. Sherman, M.S. Taqqu, W. Willinger, Long-range dependence in variable bit rate video trac, IEEE Trans. Comm. 43 (2=3=4) (1995) 1566–1579.
[2] A. Erramilli, O. Narayan, W. Willinger, Experimental queueing analysis with long-range dependent packet trac, IEEE=ACM Trans. Networking 4 (2) (1996) 209–223. [3] D.P. Heyman, A. Tabatabai, T.V. Lakshman, H. Heeke,
Modeling teleconference trac from VBR video coders, Conference Record of the International Conference on Communications (ICC), 1994, pp. 1744 –1748.
[4] D.L. Jagerman, B. Melamed, The transform and correlation structure of TES processes, Part 1: General theory, Stochastic Models 8 (2) (1992) 193–219.
[5] P. Jelenkovic, A. Lazar, N. Semret, The eect of multiple time scales and subexponentiality in mpeg video streams on queueing behavior, IEEE J. Selected Areas Comm. 15 (6) (1997) 1052–1071.
[6] S. Klivansky, A. Mukherjee, C. Song, On long-range dependence in NSFNET trac, Technical Report GIT-CC-94-61, Georgia Institute of Technology, Atlanta, GA, 1994.
[7] Y. Lee, A. van de Liefvoort, V. Wallace, Modeling correlated trac with a generalized IPP, Performance Evaluation 40 (2000) 99 –114.
[8] W.E. Leland, M.S. Taqqu, W. Willinger, D.W. Wilson, On the self-similar nature of Ethernet trac, SIGCOMM Symposium on Communications Architectures and Protocols, 1993, pp. 183–193.
[9] W.E. Leland, M.S. Taqqu, W. Willinger, D.V. Wilson, On the self-similar nature of Ethernet trac (extended version), IEEE=ACM Trans. Networking 2 (1) (1994) 1–15. [10] W.E. Leland, M.S. Taqqu, W. Willinger, D.V. Wilson, On
the self-similar nature of Ethernet trac, Proceedings of 14th International Teletrac Congress, 1994, pp. 319 –328. [11] W.E. Leland, D.V. Wilson, High time-resolution measurement
and analysis of LAN trac: implications for LAN interconnection, Proceedings of IEEE Infocom, 1991, pp. 1360 –1366.
[12] L. Lipsky, Queueing Theory: A Linear Algebraic Approach, MacMillan, New York, 1992.
[13] L. Lipsky, P. Fiorini, W. Hsin, A. van de Liefvoort, Auto-correlation of lag-k for customers departing from semi-Markov processes, Technical Report TUM-19506, Technical University Munich, 1995.
[14] K. Mitchell, Analytic models with correlated arrivals, Third IFIP Workshop on Trac Management and Synthesis of ATM Networks, London, UK, 1999.
[15] K. Mitchell, A. van de Liefvoort, Transient analysis of cell loss probabilities in buers with correlated arrivals, IFIP ATM 2000, 2000, pp. 32=1–32=12.
[16] K. Mitchell, A. van de Liefvoort, J. Place, Correlation properties of the token leaky bucket departure process, Comput. Comm. 21 (1998) 1010–1019.
[18] M. Neuts, Algorithmic Probability: A Collection of Problems (Stochastic Modeling), Chapman & Hall, London, 1995. [19] P. Pancha, M.E. Zarki, Variable bit rate video transmission,
IEEE Comm. 32 (1994) 54–66.
[20] B.E. Partuwo, R. Disney, The eects of correlated arrivals on queues, IIE Trans. 25 (1993) 105–110.
[21] D. Reininger, B. Melamed, D. Raychaudhuri, Congestion control in an ATM network, 14th International Teletrac Congress, 1994, pp. 295 –306.
[22] H.-P. Schwefel, L. Lipsky, Buer size issues in the presence of self-similar trac, Third IFIP Workshop on the Management and Design of ATM Networks, 1999, pp. 11=1– 11=12.
[23] H.-P. Schwefel, L. Lipsky, Performance results for analytic models of trac in telecommunications systems, based on multiple ON-OFF sources with self-similar behavior, 16th International Teletrac Congress, 1999.
[24] A. van de Liefvoort, The moment problem for continuous distributions, Technical Report CM-1990-02, University of Missouri-Kansas City, 1990.
[25] W. Willinger, Trac modeling for high-speed networks: Theory versus practice, in: F. Kelly, R. Williams (Eds.), Stochastic Networks, The IMA Volumes in Mathematics and its Applications, Springer, Berlin, 1995.
[26] W. Willinger, M.S. Taqqu, W.E. Leland, D.V. Wilson, Self-similarity in high-speed packet trac: analysis and modeling of Ethernet trac measurements, Statist. Sci. 10 (1) (1995) 67–85.