J.Food Pharm.Sci. 1 (2013) 5-9
Avalaible online at www. jfoodpharmsci.com
Research Article
Analysis of Canola Oil in Virgin Coconut Oil Using FTIR Spectroscopy and
Chemometrics
Yaakob B. Che Man1 and Abdul Rohman2*,
1Department of Food Technology, Faculty of Food Science & Technology, Universiti Putra Malaysia, 43400 Serdang, Selangor, Malaysia.
2
Department of Pharmaceutical Chemistry, Faculty of Pharmacy, Gadjah Mada University, 55281 Yogyakarta, Indonesia.
ARTICLE INFO ABSTRACT
Received 02/01/2012
Received in revised form 15/01/2012 Accepted 17/02/2012
Available online 20/02/2012
1. Introduction
Virgin coconut oil (VCO) is a vegetable oil that is extracted from the fresh coconut meat and is processed using only physical and other natural means (Dayrit et al., 2011). In recent years, VCO rapidly becomes valuable oil which can be attributed not only to its superior flavor, but also to the reports regarding to its potential health benefits (Manaf et al., 2007). Marina et al. (2009a) has
reviewed the physicochemical properties of VCO, authentication of VCO from selected vegetable oils, and evaluation of its antioxidant activity using several methods. Some biological activities have been reported for VCO. Zakaria et al. (2010) reported that VCO produced by Department of Agriculture of Malaysia (MARDI) appeared to possess great potentials as anti-
hypercholesterolemic agent in lipid serum using animal model. The dried and fermented processed VCO has also appeared anti-nociceptive and anti-inflammatory activities (Zakaria et al. 2011a) and hepatoprotective
toward rat’s liver (Zakaria et al. 2011b).
VCO is good raw materials in lipid-based foods such as ice cream (Choo et al., 2010). It is also used as aromatheraphy message oils (Songkro et al., 2010), and as vehicle in nano-cream (Al-Edresi and Baie, 2010). In retail market, the price of VCO is 10 – 20 times higher than that of common plant oils such as canola, palm, and corn oils. Therefore, this fact can attract unscrupulous VCO producers to blend VCO with other plant oils. Consequently, some analytical methods offering fast, reliable, and not excessive sample preparation are highly required.
Virgin coconut oil is a relative new oil comer in the industry of fats and oils, especially in tropical regions. In this study, we have investigated the possibility to use of Fourier transform infrared (FTIR) spectroscopy in combination with multivariate calibrations of partial least square (PLS) and principle component regression (PCR) as well as discriminant analysis (DA) for quantitative analysis and discrimination of canola oil (Ca-O) in virgin coconut oil (VCO). VCO, Ca-O, and the mixture of both oils was FTIR-spectroscopically scanned at mid infrared region (4,000 – 650 cm-1) using horizontal attenuated total reflectance. Several frequency regions as well as normal and derivative FTIR spectra were compared in order to obtain the best model for quantitative analysis. Finally, FTIR normal spectra at combined frequency regions of 1200-900 and 3027- 2985 cm-1 were selected for quantification of Ca-O due to their capabilities to provide the high correlation between actual and predicted values of CaO in VCO and low error values, either in calibration or validation models. Furthermore, DA was able to discriminate VCO and that adulterated with Ca-O. This result indicated that FTIR spectroscopy was possible to quantify and to discriminate Ca-O in VCO for authentication studies.
Keywords: FTIR spectroscopy, canola oil, virgin coconut oil, multivariate calibration,
discriminant analysis
*Corresponding author:
The fats and oils authentication, especially functional food oil such as cod liver oil, VCO, and olive oil, is of primary importance for consumers, food processors, and food industries (Rohman and Che Man, 2012). The adulteration frequently involved the replacement of high-cost ingredients with cheaper substitutes. VCO can be subjected to be adulterated with other vegetable oils of lower commercial value. Although the adulteration is done by economic reasons, the action can affect the quality of food, where VCO is one of the food components (Christy et al., 2004).
Some analytical techniques used for authentication of VCO are FTIR spectroscopy for detection and quantification of palm kernel oil (PKO) (Manaf et al., 2007), palm oil (Rohman and Che Man, 2009) as well as corn and sunflower oils (Rohman and Che Man, 2011), differential scanning calorimetry for analysis of PKO and soybean oil (Marina et al., 2009b), and electronic nose for detection of RBD palm kernel olein (Marina et al., 2010) as oil adulterants in VCO. However, using literature searching, there are no available results regarding the use of FTIR spectroscopy for analysis of Ca-O in VCO. Therefore, the objective of this study was to develop FTIR spectroscopy combined with chemometrics of multivariate calibrations (partial least square and principle component regression) as well as discriminant analysis for quantification and discrimination of Ca-O in VCO.
2. Materials and Methods 2.1. Materials
Canola oil (CaO) was bought from local market, in Serdang, Selangor, Malaysia. Meanwhile, virgin coconut oil (VCO) was prepared using cold extraction under supervision of Prof. Bambang Setiadji from Department of Chemistry, Gadjah Mada University. The brand name of used VCO is POVCO®. FA composition of both oils were quantitatively determined using gas chromatography coupled with flame ionization detection as described in Rohman and Che Man (2009). The FA composition of both oils was in accordance with that reported in Che Man et al. (2011). The standard of 37
2.2. Calibration and prediction samples for quantifi-cation of CaO in VCO using PLS model
For calibration, 20 samples consisting of Ca-O in binary mixtures with VCO in the concentration range of 0.5 – 50 % (volume/volume) were analytically prepared. To evaluate the capability of calibration samples to predict the unknown samples, the independent samples were also made. In order to ensure the homogeneity, these sample mixtures were vigorously shaken using vortex for 1 min. All samples were further analyzed using FTIR spectrometer.
2.3. Discriminant analysis (DA)
For DA, a training set was prepared using VCO samples containing Ca-O with different levels. These
mixtures were marked as adulterated samples ;
meanwhile, a series of pure VCO from different batch of
production was assigned as pure VCO . Both of classes
were subjected to DA using their FTIR spectra.
2.4. FTIR spectra acquisition
FTIR spectrometer of Nicolet 6700 (Thermo Nicolet, Madison, WI) was used during spectra acquisition. This instrument was equipped with a detector of deuterated triglycine sulphate and beam splitter of potassium bromide. The software of the OMNIC operating system (Version 7.0 Thermo Nicolet) included in the FTIR spectrometer was used to obtain the spectra and to manipulate them. Using a Pasteur pipette, an approximately of 1.0 mL of oil samples was properly placed on attenuated total reflectance (ATR) crystal. During measurement, FTIR spectra was obtained at
Chemometrics analysis, including quantification using PLS and PCR models as well as DA, was performed using the software TQ AnalystTM version 6 (Thermo electron Corporation, Madison, WI). The spectral regions where the variations were observed were chosen for developing PLS and PCR calibrations as well as for DA. The optimum number of PLS and PCR factors were determined using cross validation by plotting the number of factors against the root mean square error of cross validation (RMSECV) and determining the minimum factors. The predictability of the models was tested by computing root mean square error of prediction (RMSEP) as used by Gurdeniz and Ozen (2009).
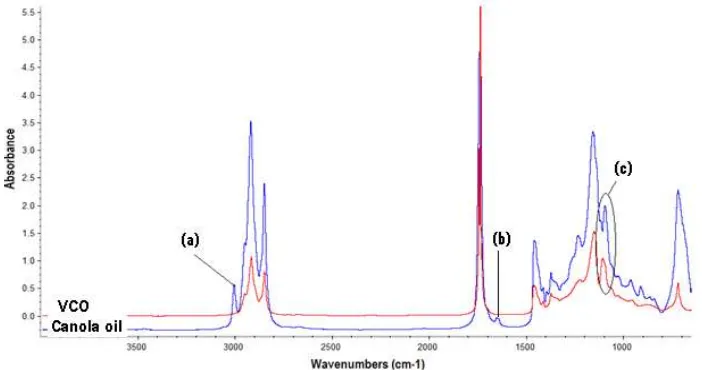
3. Result and Discussion 3.1. FTIR spectra of VCO and Ca-O
Compared with other edible fats and oils, VCO has unique FTIR spectra. The spectra of VCO revealed some differences to other vegetable oils including canola oil, especially in the regions around 3007 cm-1 (a) and 1654 cm-1 (b) and at frequency regions of 1120 - 1090 cm-1 (c). There was no band at frequencies of 3007 and 1655 cm-1 for VCO, and the otherwise was observed for Ca-O. Furthermore, at frequency region of 1120 - 1090 cm-1, VCO showed one peak; meanwhile Ca-O exhibited two peaks (Figure 1). For this reason, these differences in term of frequency regions of VCO and Ca-O can be exploited for optimization in order to quantify Ca-O in VCO.
Peaks at 3007 and 1655 cm-1 were attributed to cis =C-H stretch and cis –C=C- stretch and can be used as an indicative for the presence of unsaturated fatty acids in
vegetable oils. From our previous report (Che Man et al., 2011), VCO is rich in saturated fatty acid, especially lauric acid. In addition, VCO has low monounsaturated fatty acids (oleic acid) as compared Ca-O. As a consequence, there is no peaks at 3007 and 1655 cm-1 which are
indicative for the presence of unsaturated fatty acids. The functional groups responsible for IR absorption of other peaks can be found elsewhere (Rohman and Che Man, 2010; Vlachos et al., 2006).
Fig 1. FTIR spectra of virgin coconut oil (VCO) and canola oil (Ca-O) at mid infrared region (4000 – 650 cm-1)
3.2. Quantification of Ca-O in VCO
Quantification of Ca-O in VCO was performed using multivariate calibrations of partial least square (PLS) and principle component regression (PCR). PLS and PCR are one of the multivariate calibration models in which the concentration of analyte(s) is correlated with the principal components (PCs) or factors, which are linear combination of original variables (FTIR spectra), rather than with original variables. This technique can reduce the amount of data (FTIR spectra) which insignificantly contributed for PLS model (Miller and Miller, 2005).
For quantification, several frequency regions, namely 1200-900 cm-1, 3027- 2985 cm-1 and at combined frequency regions of 1200-900 and 3027- 2985 cm-1 were assessedin order to know the frequency regions giving the best model. Finally, the combined frequency regions of 1200-900 and 3027- 2985 cm-1 were selected for quantification of Ca-O due to their capabilities to provide the high value of correlation, expressed with coefficient
of determination (R2) between actual and predicted values of CaO in VCO and low error values, either in calibration or validation models. The next optimization was related to spectral treatment (normal spectra versus derivatives) as well as multivariate calibrations (PLS and PCR).
Table 1 exhibited the values obtained from PLS and PCR calibration models for analysis of Ca-O in VCO in terms of R2, root mean square error of calibration (RMSEC) and root mean square error of prediction (RMSEP) either for normal spectra or its derivatives. It is known that FTIR normal spectra along with PLS model give the highest R2 value and lowest errors either in calibration (RMSEC) or in prediction samples (RMSEP). As a consequence, PLS with FTIR normal spectra were selected for quantification of Ca-O in VCO. Based on RMSECV values, it is known that the number of factors to be used during PLS is 6.
Table 1.Some values obtained from PLS and PCR calibration models for analysis of Ca-O in VCO
Multivariate Calibration
Spectra Fac-
tor
Equation R2 RMSEC
(% v/v)
RMSEP (% v/v)
Calibration Prediction Calib-
ration
Predic- tion
PLS Normal 6 y = 1.012x - 0.251 y = 0.987x + 0.185 0.998 0.996 0.392 2.57
1st der 6 y = 0.999x + 0.055 y = 0.872x + 1.088 0.998 0.983 0.557 3.28
2nd der 6 y = 0.997x + 0.096 y = 0.802x - 0.198 0.996 0.932 0.835 6.71
PCR Normal 6 y = 0.990x + 0.173 y = 0.974x + 0.446 0.990 0.992 1.37 1.47
1st der 6 y = 0.978x + 0.323 y = 0.943x – 0.004 0.987 0.990 1.57 2.15
2nd der 6 y = 0.963x +0.592 y = 0.746x + 2.497 0.968 0.908 2.64 6.43
Figure 2 exhibited a scatter plot for the relationship between actual value (x-axis) and FTIR predicted value (y-axis) of Ca-O in VCO using PLS at the combined frequency regions of 1200-900 and 3027- 2985 cm-1. The developed model was further used to predict the independent samples which are different from calibration samples. Such relationship between actual and predicted values of Ca-O in VCO was shown in Figure 3. This result suggests that FTIR spectroscopy combined with PLS can be a promising method for quantification of Ca-O in VCO.
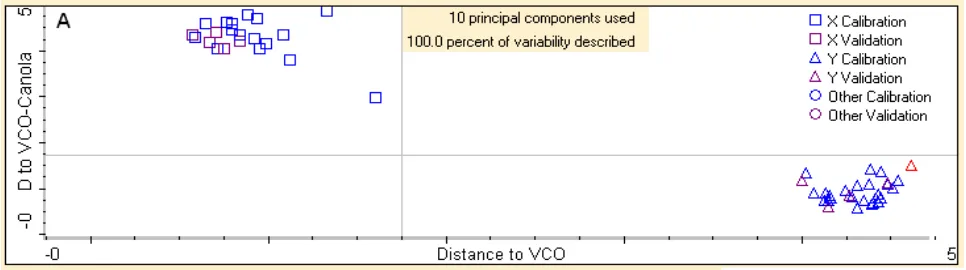
3.3. Discriminant analysis
Discriminant analysis (DA) can be used to determine the class of oils which is similar to oil adulterants by calculating the distance from each class center in Mahalanobis distance unit. Once classification model has been obtained, the membership of unknown oils to one of the defined classes can be predicted (Ballabio et al., 2009). For discrimination between VCO and VCO adulterated with Ca-O, DA was used. The pure VCO samples and those blended with adulterant (Ca-O) were classified into two groups known as pure VCO
and adulterated VCO . Both classes were classified
using DA and Coomans plot. The Coomans plot is useful for visualizing the classification results. It is formed by calculating two independent principal component models and plotting the residual distances of samples of each two model; meanwhile, the Mahalanobis distance obtained from the Coomans plot is useful to assign whether a set of unknown value samples is similar to a group of known measured samples (Ballabio et al., 2009).
Figure 4 exhibited the Coomans plot for classification of VCO and that adulterated with Ca-O. The Mahalanobis distance to VCO was shown in absis (x-axis), meanwhile the y-axis shows the distance to VCO blended with Ca-O. In this study, the DA model classified 100% of all samples accurately according to its group.
These results indicated that no samples are misclassified into the wrong group which sometimes could happen because of the similarities in the chemical compositions between two classes (Manaf et al., 2007).
Fig 2. PLS model for relationship between actual value and FTIR predicted value of canola oil in VCO using FTIR normal spectra at combined frequency regions of 1200-900 and 3027- 2985 cm-1 in calibration samples.
Fig 3. The relationship between actual and FTIR predicted values of Ca-O in VCO for prediction/validation samples.
Fig 4. The Coomans plot for discrimination of VCO and VCO adulterated with canola oil using FTIR normal spectra at combined frequency regions of 1200-900 and 3027- 2985 cm-1
4. Conclusion
It can be concluded that FTIR spectroscopy combined with chemometric analysis of PLS and DA have indicated useful tool for quantitative determination and classification of adulterated VCO with canola oil. DA can be perfectly used to classify VCO that adulterated with Ca-O. FTIR spectroscopic technique offers a fast, reliable and not expensive; therefore, this technique is suitable for authentication studies of high valuable fats and oils.
References
Al-Edresi, S.; and Baie, S. Formulation and stability of whitening VCO-in-water nano-cream. Int. J. Pharm. 2010. 373, 174-178.
Ballabio, D.; and Todeschini, R. Multivariate classification for qualitative analysis in Infrared spectroscopy for food
quality: Analysis and control.New York, USA: Elsevier pp.
83–104, 2008.
Che Man, Y.B.; Rohman, A.; and Mansor, T.S.T. Differentiation of lard from other edible fats and oils by means of Fourier transform infrared spectroscopy and chemometrics. J.
Am. Oil Chem. Soc. 2011. 88, 187-192.
Christy, A.A.; Kasemsumran, S.; Du, Y.; and Ozaki, K. The detection and quantification of adulteration in olive oil by near-infrared spectroscopy and chemometrics. Anal. Sci.
2004. 20, 935-940.
Choo, S.Y.; Leong, S.K.; and Henna Lu, F.S. Physicochemical and sensory properties of ice-cream formulated with virgin coconut oil. Food Sci. Technol. Int. 2010. 16(6), 531-541. Dayrit, F.M.; Dimzon, I.K.D.; Valde, M.F.; Santos, J.E.R.;
Garrovillas, M.J.M.; and Villarino, B.J. Quality characteristics of virgin coconut oil: Comparisons with refined coconut oil. Pure Appl. Chem. 2011. 83(9), 1789-1799.
Gurdeniz, G.; and Ozen, B. Detection of adulteration of extra-virgin olive oil by chemometric analysis of mid-infrared spectral data. Food Chem. 2009. 116, 519 – 525.
Manaf, M.A.; Che Man, Y.B.; Hamid, N.S.A.; Ismail, A.; and Syahariza, Z.A. Analysis of adulteration of virgin coconut oil by palm kernel olein using Fourier transform Infrared spectroscopy. J. Food Lipids. 2007. 14,111 – 121. selected vegetable oils using differential scanning calorimetry. J. Food Lipids. 2009b. 16, 50–61.
Marina, A.M.; Che Man, Y.B.; and Ismail, A. Use of the SAW sensor electronic nose for detecting the adulteration of virgin coconut oil with RBD palm kernel olein. J. Am. Oil
Chem. Soc. 2010. 87, 263–270.
Miller, J.N. and Miller, J.C. Statistics and Chemometrics for
Analytical chemistry. 5th Edition. Edinburgh Gate Harlow:
Pearson Education Limited, 2005.
Rohman, A.; and Che Man, Y.B. Monitoring ofvirgin coconut oil (VCO) adulteration with palm oil using Fourier transform infrared spectroscopy. J. Food Lipids. 2009. 16 (4), 618-628.
Rohman, A.; and Che Man, Y.B. Fourier transform infrared (FTIR) spectroscopy for analysis of extra virgin olive oil adulterated with palm oil. Food Res. Int. 2010. 43 (3), 886-892
Rohman, A.; and Che Man, Y.B. The use of Fourier transform mid infrared (FT-MIR) spectroscopy for detection and quantification of adulteration in virgin coconut oil. Food Chem. 2011. 129(2), 583-588.
Rohman, A.; and Che Man, Y.B. Authentication of functional food oils Fourier transformed infrared spectroscopy.
Appl. Spectros. Rev. 2012.47(1), 1-13.
Songkro, S.; Sirikatitham, A.; Sungkarak, S.; Buaking, K.; Wungsintaweekul, J.; Maneenuan, D.; and Oungbho, K. Characterization of aromatherapy massage oils prepared from virgin coconut oil and some essential oils. J. Am. Oil
Chem. Soc. 2010. 87(1), 93-107.
Vlachos, N.; Skopelitis, Y.; Psaroudaki, M.; Konstantinidou, V.; Chatzilazarou, A.; and Tegou, E. Applications of Fourier transform-infrared spectroscopy to edible oils. Anal.
Chim. Acta. 2006. 573–574, 459 – 465.
Zakaria, Z.A.; Ahmad, Z.; Somchit, M.N.; Arifah, A.K.; Khairi, H.M.; Sulaiman, M.R.; Teh, L.K.; Salleh, M.Z.; and Long, K. Antihypercholesterolemia property and fatty acid composition of mardi-produced virgin coconut oils. Afr. J.
Pharm. Pharmacol. 2010. 4(9), 636-644.
Zakaria, Z.A.; Somchit, M.N.; Mat Jais, A.M.; Teh, L.K.; Salleh, M.Z.; and Long, K. 2011. In vivo Antinociceptive and Anti-inflammatory Activities of Dried and Fermented Processed Virgin Coconut Oil. Med. Princ. Pract. 2011a. 20,
231-236.
Zakaria, Z.A. Rofiee, M. S. Somchit, M.N. Zuraini, A.; Sulaiman, M. R.; Teh, L.K.; Salleh, M.Z. and Long, K.. Hepatoprotective Activity of Dried- and
Fermented-Processed Virgin Coconut Oil. Evidence-Based