Relationship between Nutritional Status and Flat Foot in Children
Joyce Phua Pau Fung,1 Yoyos Dias Ismiarto,2 Wulan Mayasari3
1Faculty of Medicine Universitas Padjadjaran, 2Department of Orthopaedi and Traumatology
Faculty of Medicine Universitas Padjadjaran/Dr. Hasan Sadikin General Hospital Bandung, 3Department of Anatomy, Cell Biology and Physiology Faculty of Medicine Universitas
Padjadjaran
Abstract
Background: Pediatric flatfoot has been reported as the highest clinical complains for foot problems in
pediatric department. Nutritional status has showed great influence on the occurrence of flat foot. There are many debates regarding whether underweight or overweight children are more prone to flatfoot. The aim of this study was to analyze the relationship between nutritional status and flatfoot in children.
Methods: A cross sectional study was conducted from July to October 2015 in 3 primary schools in
Kecamatan Jatinangor. There were 259 children of grade 4 to 5 included in this study. Flatfoot screening
was based on measurement of footprint and calculation using Chippaux-smirak index (CSI). The height and weight of children were measured to obtain their Body Mass Index (BMI). Nutritional status was classified based on CDC BMI-for-age growth charts. Analysis was done using chi-square test.
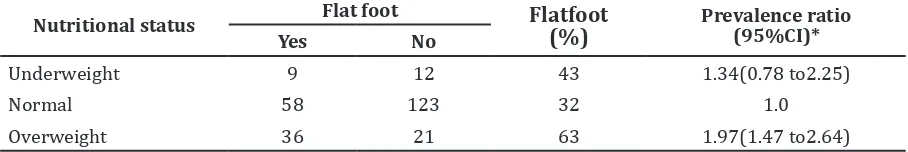
Results: There was significant association between nutritional status and flatfoot with p value<0.001.The
prevalence of flatfoot in children grade 4to5is40%. When compared to the normal weight children, the overweight children showed prevalence ratio of 1.97(95% CI:1.47 to 2.64) while the underweight children showed prevalence ratio of 1.34 (95% CI:1.78 to 2.25).This stated that the risk of developing flat foot was
higher in overweight children.
Conclusions: There is significant association between nutritional status with children grade4 to 5.
Overweight children are more prone to flat foot. [AMJ.2017;4(1):152–6]
Keywords: Chippaux-smirak index, nutritional status, pediatric flat foot
Correspondence: Joyce Phua Pau Fung, Faculty of Medicine, Universitas Padjadjaran, Jalan Raya Bandung-Sumedang Km.21, Jatinangor, Sumedang, Indonesia, Phone: +6281802263823 Email: [email protected]
Introduction
Flat foot has been reported as the highest clinical complain for foot problem in pediatric department.1 In 2005, the prevalence of flat foot in children aged 3 to 6 was more than 40%.2 Based on the Bio Med Central musculoskeletal disorder research, the prevalence of flatfoot in children of aged 2 to 6 years was between 21% to 57%.3 Flatfoot is a condition where the foot arch is collapsed with the entire sole touching the ground. There are 2 types so flatfoot. Flexible flatfoot is characterized by flattening of arch during weight bearing and rigid flat foot is characterized by stiff, fixed arch even without weight bearing. Many factors are associated with flatfoot. There are ligament laxity, collagen disorder, muscular and neurologic abnormalities.1
Foot arch is essential for human gait and
support. Physiologically, the foot arch not only serves as a shock absorber but it is also ideally distributes the bodyweight. Without an arch, the foot will be more rigid leading to a greater impact from our body weight to be transmitted to the skeletal system.4 As times go by, this will lead to the development of musculoskeletal disorders such as spine disorder.5
Furthermore, flat foot patient will suffer from pain in their foot, instability as well as limitation in traveling long journey.6 If there is no proper treatment towards this condition, a child might have delay in motor development.7
was one research conducted in Australia which stated that heavier children had less flatfoot.2,8
This study was carried out to analyze the relationship between nutritional status and flat foot in children.
Methods
A cross sectional study was conducted from July to October 2015 in 3 primary schools located in Jatinangor sub-district, Sumedang district,West Java Province, Indonesia. The target population was grade 4 to 5 primary school children in Kecamatan Jatinangor. The samples were selected by multistage sampling method. In the first stage, 3 primary schools were randomly selected from a total of 29 primary schools in Kecamatan Jatinangor. The selected primary schools were SDN Jatiroke 1, SDN Paripurna and SDN Cikeruh 1. From each selected schools, only children from grade 4 and 5 ranging from 9 to 12 years old were chosen. At this range of ages, the development of foot arch almost reach edit speak and the flatness of foot arch will be more remarkable. Lastly, all the children from grade 4 and 5 were included as the research sample, which consist of 288 children.
The inclusion criteria in this study were primary school children of grade 4 to 5 in Kecamatan Jatinangor children who were present in class during data collection, willing to participate and had their parents signed the inform consent form. Children who were not in grade 4 to 5 and had any abnormalities in foot besides flatfoot are excluded. All the subjects must fulfill the inclusive and exclusive criteria before being selected as research subject. The study was conducted after obtaining clearance from the health research ethical committee. Prior to data collection, informed consent was carried out by explaining the procedure, benefit and risk of this research.
Clinical diagnosis of flat foot was based on the measurement of footprint obtained and calculation of Chippaux-smirak index (CSI). Foot print method is a standardized method used for flat foot screening.9 In this method, a child was asked to stepped on an ink print mat (podograph) and after a few minutes the child was asked to step on a paper. This was followed by calculation of Chippaux-smirak index to determine the percentage of foot arch. Chippaux-smirak index is a highly sensitive foot print measurement, having a predictive probability of more than 90%.9 The CSI was defined as ratio of the length of line B (narrowest point on foot arch) divided by
the length of line A (maximum width at the metatarsals) (B/A×100%).10 CSI consist of five categories which were 0%: high arch foot; 0.1% to 29.9%: normal arched foot; 30% to 39.9%: intermediate foot; 40% to 44.9%: low arch foot;>45%:flatfoot.11 In this study, flat foot was diagnosed when either side of the foot had an abnormal depression of the foot arch.
The height and weight of the children were measured according to standard procedure.12 The height was measured to the nearest 0.1cm with a calibrated stadiometer (Model APAHW002) and the weight was measured to the nearest 0.01kg with a calibrated electronic scale. The Body Mass Index was then calculated by dividing weight (kg) by the square root of height. The classification system for children nutritional status according to the CDC BMI- for-age growth charts were underweight (<5th percentile), normal (5th percentile to< 85th percentile) and Overweight (>85th percentile).13
The data was analyzed using computer. All the data collected were cross checked for completeness and accuracy. Chi square test was used to determine the relationship of nutritional status and flat foot in children. The assumption of chi-square must be fulfilled.14 The risk of difference group of nutritional status in developing flat foot is determined by calculating the prevalence ratio. The result is statistically significant when the p value is <0.05.
Results
In this study, the amount of subjects from grade 4 to 5 was 288 children. However, there were 29 children who failed to fulfill the inclusion criteria. Thus, only 259 children were included in this study. Among the 259 children ranging from 9-12 years old, 103 children were diagnosed to have flat foot. The prevalence of flat foot in this study was 40%.
The demographic characteristics of the subjects were shown in Table 1. Based on the results in Table 1, there was no difference in the prevalence of flat foot in male and female children. The median age was homogenous for flatfoot and non flat foot children. The three selected schools have also showed not much difference in the proportion of flat foot in children.
highest prevalence among the children with flat foot.
The results of prevalence ratio were showed in Table 2. The normal weight children were used as a control for underweight and overweight children to determine the risk of malnutrition in developing flatfoot. The comparison between normal weight and overweight children were found to be significant with p value <0.001 but the results for comparison between underweight and normal weight children were not significant as the interval crossed.1 This stated that overweight children had a higher risk of developing flatfoot compared to underweight and normal weight children.
Discussion
In this study, the results revealed that there was no difference in the proportion of flatfoot in male versus female children. In most researches, boys were claimed to have a higher prevalence of flatfoot than girls. Hazzaa et al.15 reported that the proportion of flatfoot in male was 52% and female was 49%.
However, there were also some researches that stated female children had higher
prevalence of flatfoot compare to male. This is showed in Kachoosangy et al.16 study where the prevalence of flat foot in female was 75.2% male was 72.6%.
However, the mechanism that differ the proportion of flatfoot in both sex is not well understood.2,17
The main findings of the study are nutritional status is strongly associated with pediatric flat foot with overweight children as the highest risk of developing flat foot compared to normal weight and underweight children. In this study, the risk of developing flatfoot in overweight children is almost twice higher than underweight children. This finding is consistent with the previous research that reported overweight children had flatter foot compare to normal and underweight children. For example, Pfeiffer et al.2 demonstrated that the probability of flatfoot in overweight and obese children were 3 times more than normal weight children.
There was a study conducted in Spain which reported that the arch height in obese children increased at the rate of 3.7% which is 1.1% slower than the normal weight children.10 However, findings from Evans8 demonstrated that flat foot was lesser in heavy children. This
Table 1 Characteristic of subjects
Characteristics
Flat foot
Total
Yes No
(n=103) (n=156)
Gender,(%)
Male (53)40 % (81)60 % 134
Female (50)40% (75)60% 125
Age,years,median(range) 10(9–12) 10(8–12) 10(8–12)
School,(%)
SDNCikeruh1 (27)40% (40)60% 67
SDNParipurna (44)38% (72)62% 116
SDNJatiroke1 (32)42% (44)58% 76
Table 2 Association between nutritional status and flatfoot in children
Nutritional status Flat foot Flatfoot
(%)
Prevalence ratio (95%CI)*
Yes No
Underweight 9 12 43 1.34(0.78 to2.25)
Normal 58 123 32 1.0
Overweight 36 21 63 1.97(1.47 to2.64)
is because the results between flatfoot and anthropometric factors in Evans’8 study were not significant.
There were a few theories that supported the result of this study which stated that overweight children had a higher risk of developing flatfoot. One of them were obese children had higher adiposity underneath the foot, which lowers the height of the foot arch leading to the development of flatfoot.18
According to Chougala et al.19, obese children showed higher dynamic and static plantar pressure. This results in structural changes and increase in surface contact between the sole and the ground.19 Another theory is that the increased amount of fats in belly contribute to the weakening of surrounding muscles of the foot which can deviate the line of gravity, thus applying greater force on the foot.19 In long term, the internal structure of the foot might develop pathologies and injuries.17 This will predispose to clinical disorder like foot pain, instability, spine injury and scoliosis.5 Physicians should be aware that reduction in body weight in overweight children can be effective in management of flat foot. Additional research is recommended to study the effect of weight towards flatfoot as part of the management.
There were a few limitations in this study. First, this study used a cross sectional design and were unable to prove the causal relationship between the variables. A new prospective study to determine the causal relationship between the variable is recommended. Furthermore, this study did not control for genetic and physical activity which are confounding to the results.20
In conclusion, overweight children have greater risk of developing flatfoot than underweight children and normal weight children.
References
1. Halabchi F, Mazaheri R, Mirshahi M, Abbasian L. Pediatric flexible flatfoot; clinical aspects and algorithmic approach. Iran J Pediatr. 2013;23(3):247 –60.
2. Pfeiffer M, Kotz R, Ledl T, Hauser G, Sluga M. Prevalence of flat foot in preschool-aged children. Pediatrics. 2006;118(2):634 –9. 3. Shih YF, Chen CY, Chen WY, Lin HC. Lower
extremity kinematics in children with and without flexible flatfoot: a comparative study. BMC Musculoskeletal Disorders. 2012;13(1):31– 40.
4. Tortora GJ, Nielsen MT. The skeletal system:
the appendicular skeleton. In: Principles of human anatomy. 12th ed. New Jersey: John Wiley & Sons, Inc; 2014. p. 258
5. Taylor ED, Theim KR, Mirch MC, Ghorbani S, Tanofsky-Kraff M, Adler-Wailes DC, et al. Orthopedic complications of overweight in children and adolescents. Pediatrics. 2006;117(6):2167–74.
6. Trattler R, Trattler S. Flat feet: pes planus, fallen arches. In: Trattler R, Trattler S. Better health through natural healing: how to get well without drugs or surgery. 3rd ed. California: North Atlantic Books; 2013. p. 264 – 5
7. Chen KC, Tung LC, Tung CH, Yeh CJ, Yang JF, Wang CH. An investigation of the factors affecting flatfoot in children with delayed motor development. Res Dev Disabil. 2014;35(3):639–45.
8. Evans AM. The paediatric flat foot and general anthropometry in 140 Australian school children aged 7-10 years. J Foot Ankle Res. 2011;4(1):12 –19
9. Chen KC, Yeh CJ, Kuo JF, Hsieh CL, Yang SF, Wang CH. Footprint analysis of flatfoot in preschool-aged children. Eur J Pediatr. 2011;170(5):611–7.
10. Pita-Fernández S, González-Martín C, Seoane-Pillado T, López-Calviño B, Pértega-Díaz S, Gil-Guillén V. Validity of footprint analysis to determine flatfoot using clinical diagnosis as the gold standard in a random sample aged 40 years and older. J Epidemiol. 2015;25(2):148 – 54.
11. Sacco ICN, Noguera GC, Bacarin TA, Casarotto R, Tozzi FL. Alteração do arco longitudinal medial na neuropatia periférica diabética. Acta ortop bras. 2009;17(1):13 – 6.
12. CDC. National health and nutrition examination survey: anthropometry procedures manual: national center for health statistics; 2007 [cited 2015 11 November]. Available from: http:// w w w. c d c . g o v / n c h s / d a t a / n h a n e s / nhanes_07_08/manual_an.pdf.
13. Chung S. Body mass index and body composition scaling to height in children and adolescent. Ann Pediatr Endocrinol Metab. 2015;20(3):125– 9.
14. McHugh ML. The chi-square test of independence. Biochem Med (Zagreb). 2013;23(2):143–9.
16. Kachoosangy RA, Aliabadi F, Ghorbani M. Prevalence of flat foot: comparison between male and female primary school students. IRJ. 2013;11(2):22–4.
17. Dowling AM, Steele JR, Baur LA. What are the effects of obesity in children on plantar pressure distributions? Int J Obes Relat Metab Disord. 2004;28(11):1514– 9. 18. Mickle KJ, Steele JR, Munro BJ. The feet of
overweight and obese young children: are they flat or fat? Obesity (Silver Spring).
2006;14(11):1949–53.
19. Chougala A, Phanse V, Erohit Khanna E, Panda S. Screening of body mass index and functional flat foot in adult: an observational study. Int J Physiother Res. 2015;3(3):1037–41.