Full Terms & Conditions of access and use can be found at
http://www.tandfonline.com/action/journalInformation?journalCode=cbie20
Download by: [Universitas Maritim Raja Ali Haji] Date: 17 January 2016, At: 23:40
Bulletin of Indonesian Economic Studies
ISSN: 0007-4918 (Print) 1472-7234 (Online) Journal homepage: http://www.tandfonline.com/loi/cbie20
Manufacturing in India and Indonesia:
performance and policies
Vikram Nehru
To cite this article: Vikram Nehru (2013) Manufacturing in India and Indonesia: performance and policies, Bulletin of Indonesian Economic Studies, 49:1, 35-60, DOI: 10.1080/00074918.2013.772938
To link to this article: http://dx.doi.org/10.1080/00074918.2013.772938
Published online: 21 Mar 2013.
Submit your article to this journal
Article views: 723
View related articles
ISSN 0007-4918 print/ISSN 1472-7234 online/13/010035-26 © 2013 Indonesia Project ANU http://dx.doi.org/10.1080/00074918.2013.772938
‘Indonesia in Comparative Perspective’ Series
MANUFACTURING IN INDIA AND INDONESIA:
PERFORMANCE AND POLICIES
Vikram Nehru*
Carnegie Endowment for International Peace, Washington DC
Since the global inancial crisis of 2008, the world has been riveted by China’s rapid
growth and its contribution to the global recovery. But less attention has been paid
to India and Indonesia – Asia’s two other giants – which also displayed resilience
during the crisis and show promise of sustaining this performance. Also
remark-able are their geographical, historical and cultural proximity; notwithstanding their
differences, these two countries are alike in many respects and face similar
chal-lenges, as relected in their emerging policy priorities. China’s large size and rapid
growth may have absorbed the attention of Indian and Indonesian policy makers, but this paper argues that a comparative approach to the issues that both countries face can yield interesting insights and provide potential solutions to their develop-ment challenges.
Keywords: Manufacturing, industrial development, India, Indonesia
INTRODUCTION
India and Indonesia are, respectively, the world’s second and fourth most populous countries and, alongside the US, among its three largest parliamentary democra-cies. Together, they are home to more Muslims than the Middle East, North Africa,
Europe and the Americas combined;1 they are also known for their diverse ethnic, linguistic and religious mix.2 They proclaimed independence from their colonial
* Senior Associate and Chair in Southeast Asian Studies. Van Tran, Junior Fellow, provided
research assistance. I am grateful to the three anonymous referees for their thoughtful and helpful responses.
1 Indonesia and India have a total Muslim population of about 380 million; the Middle East, North Africa, Europe and the Americas have about 370 million (Pew Research Center
2011).
2 If languages relect ethnic diversity, then India and Indonesia are remarkably diverse.
The Indian constitution recognises 22 languages, 30 are spoken by more than a million native speakers each and 122 are spoken by more than 10,000 native speakers each (2001
Indian Census). While virtually every Indonesian speaks Bahasa, more than 700 languages
are still used in different parts of the country.
masters within two years of each other – Indonesia in 1945, India in 1947.3 At that time, their per capita incomes were similar,4 and their average growth in per capita income was virtually identical between 1949 and 1968 (1.4% a year). Both countries
followed quasi-socialist economic policies in their early post-independence years, only to abandon them later in favour of market-oriented policies. Prime Minis-ter Nehru and President Sukarno were leaders in their independence struggles, nationalists in their domestic and foreign policies (both sought economic
self-suf-iciency and were among the ive political leaders in the developing world who
established the non-aligned movement5) and socialist in their approach to devel-opment.
Yet India’s and Indonesia’s journeys have diverged over the last half-century,
and especially in the past decade. Indonesia was the irst of the two to initiate economic reforms (in 1967) and experienced an immediate acceleration in growth,
which it then sustained for the next 30 years. India followed a quarter-century later, and while it also enjoyed a surge in productivity, its per capita income is now
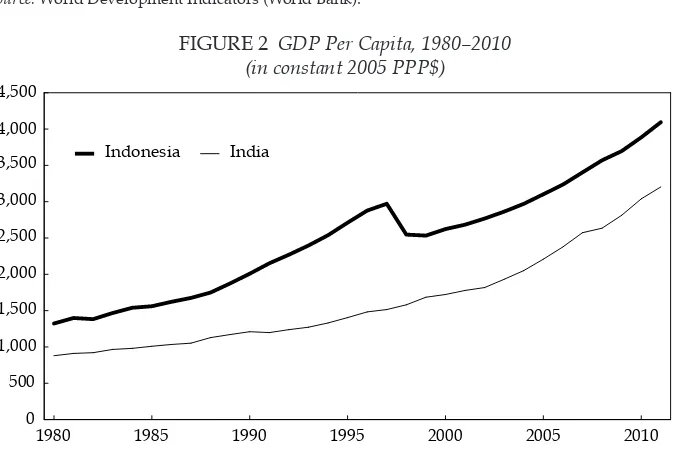
less than half Indonesia’s (but more than three-quarters if measured in 2005 pur -chasing-power-parity (PPP) dollars).6 Indonesia’s export strength now appears to lie more in commodities and processed raw materials than in manufacturing;
India’s appears to lie in services exports, particularly those related to software development and business-process outsourcing. India has a federal government,
although its public inances are largely centralised; Indonesia is a unitary state, but its public inances are substantially decentralised. India lags behind Indonesia
in several social areas, but, unlike Indonesia, it has a few centres of excellence in education, research and medicine that are near world-class. And Indonesia
devel-oped a robust democracy after President Soeharto’s departure, in 1998, whereas India’s democracy – albeit noisy and chaotic – lourished throughout its entire post-independence history (except during the ‘emergency’ of 1975–77).
Today, both economies enjoy robust growth, are members of the G20 and, together with China, are shifting the global centre of gravity towards Asia.7 But both also face the common challenge of sustaining rapid growth at a time of slow and uncertain global recovery and elevated and volatile commodity prices. Nei-ther country can afford growth to slow, because of their need to create jobs and reduce poverty. Although the poverty rate has been declining in both countries, it
3 Indonesia proclaimed independence on 17 August 1945, although the Dutch did not recognise this until 27 December 1949. See < http://www.indonesia.go.id/en/indonesia-glance/geography-indonesia>.
4 In 1990 international Geary–Khamis prices, India’s per capita income in 1949 was $624 and Indonesia’s was $763 (Maddison 2008).
5 The other leaders of the non-aligned movement were Nasser of Egypt, Tito of Yugoslavia
and Nkrumah of Ghana.
6 India’s gross national income per capita in 2011 was $1,410, compared with Indonesia’s
$2,940; India’s GDP per capita in 2011 was $1,489 ($3,652 in PPP terms) whereas Indone
-sia’s was $3,495 ($4,668 in PPP terms).
7 For comparisons of India and China, see Bardhan (2010), Gulati and Fen (2007), Smith (2007), and Winters and Yusuf (2007). For a comparison of China and Indonesia, see Hof
-man, Zhao and Ishihara (2007). For a comparison of India and Indonesia, see Lankester
(2004) and Thee (2012).
remains high. More important, the near poor – those with an income within 20% of the poverty line – represent 12% of Indonesia’s population and 15% of India’s.8 The near-poor are a small income shock away from falling into poverty. Not only is rapid growth critical in reducing poverty, but with rapid growth comes
struc-tural change – enabling those in low-productivity jobs to move into more-produc -tive, better-paid jobs.
This paper contends that both India and Indonesia have considerable poten-tial to become more productive by facilitating changes in the structure of the economy. Increasing the share of manufacturing in GDP, in particular, is likely to stimulate growth and create jobs, in part because it is relatively under-devel-oped in both economies, and also because it is uniquely capable of expanding output and employment. But rapid growth in manufacturing requires the trans-fer of resources, especially labour, from less productive areas of agriculture and services. This paper focuses on how the policies of the two countries compare in achieving this objective.
The irst section of this paper examines why the current pattern of growth in
output and employment in both India and Indonesia is unsustainable, and why manufacturing will be important in the decades ahead. The second explores how the two countries compare in four policy areas necessary for sustainable growth
in manufacturing: the trade, investment and macroeconomic framework; infra
-structure development and the primacy of healthy urban areas; human-capital development; and lexibility in factor markets. These may be economy-wide pol -icy areas, but they are critical for growth in manufacturing (Aswicahyono, Hill and Narjoko 2011). The third section reviews the political-economy dimensions impeding reforms. The fourth section concludes.
WHY MANUFACTURING IS IMPORTANT
One may ask why manufacturing should be important in India and Indonesia when overall growth has been rapid and robust in both countries over the last
decade (igures 1–4). India’s GDP growth has averaged 7.8%, Indonesia’s 5.5%. This growth has increased average living standards signiicantly in both coun -tries, particularly in Indonesia (table 1).9
Notwithstanding their impressive economic performances, both economies
have seen a relative decline in manufacturing (table 2) – their share of manufac -turing in GDP and exports has slipped in recent years. In India, growth has been
propelled by services; in Indonesia, by higher commodity prices.
In neither case was manufacturing the primary driver of growth. This matters,
for two reasons. First, labour productivity in manufacturing displays uncondi
-tional convergence – that is, it tends to converge towards the technology fron
-tier irrespective of country-speciic conditions (Rodrik 2012; Bénétrix, O’Rourke
8 Author’s calculation, using Povcal <http://iresearch.worldbank.org/PovcalNet/>.
9 The elasticity of poverty reduction and GDP was –0.26 for Indonesia (for 1984–2010) and –0.12 for India (for 1978–2010), using an estimate of $1.25 per day (in 2005 PPP terms) for
the head-count poverty rate and GDP at constant prices in local currency units (author’s estimates, based on data from the World Bank’s World Development Indicators, available at <http://data.worldbank.org/data-catalog/world-development-indicators>).
and Williamson 2012; McMillan and Rodrik 2011). Moreover, the lower the
productivity, the faster tends to be its growth. One estimate shows that
indus-tries with labour productivity at 10% of those at the technology frontier can expect to achieve an incremental 6.7 percentage points in growth a year, all else
remaining equal (Rodrik 2012). The challenge, then, is to develop a critical mass in manufacturing, so that convergence in manufacturing drives convergence in
FIGURE 1 Annual GDP Growth, 1960–2010
(%)
Source: World Development Indicators (World Bank).
FIGURE 2 GDP Per Capita, 1980–2010
(in constant 2005 PPP$)
Source: World Development Indicators (World Bank).
FIGURE 3 Gross Capital Formation as a Share of GDP, 1960–2010
(%)
Source: World Development Indicators (World Bank).
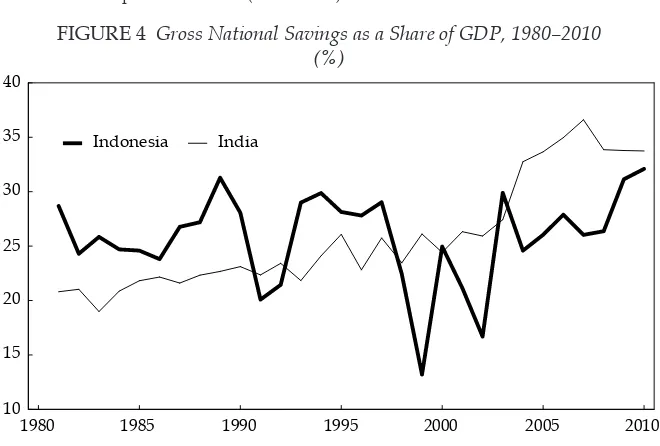
FIGURE 4 Gross National Savings as a Share of GDP, 1980–2010
(%)
Source: World Development Indicators (World Bank).
per capita incomes. Of course, successful manufacturing depends on healthy agriculture and services, which provide key inputs and complementary outputs
and whose eficiency releases resources for manufacturing.10
10 No country has developed since 1950 without industrialisation (Szirmai 2009). The ex -periences of Japan, South Korea, Taiwan and now China demonstrate that manufacturing can increase labour productivity by an extraordinary amount. Such increases are not auto-matic, however, and rely on a country’s policies and institutional environment.
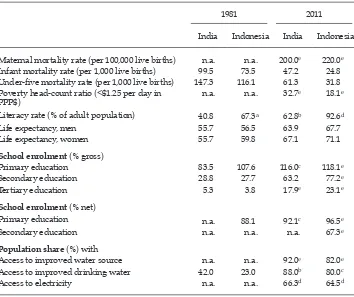
TABLE
1 Social Indicators for India and Indonesia
1981 2011
India Indonesia India Indonesia
Maternal mortality rate (per 100,000 live births) n.a. n.a. 200.0e 220.0e
Infant mortality rate (per 1,000 live births) 99.5 73.5 47.2 24.8 Under-ive mortality rate (per 1,000 live births) 147.3 116.1 61.3 31.8 Poverty head-count ratio (<$1.25 per day in
PPP$) n.a. n.a. 32.7
e 18.1e
Literacy rate (% of adult population) 40.8 67.3a 62.8b 92.6d
Life expectancy, men 55.7 56.5 63.9 67.7
Life expectancy, women 55.7 59.8 67.1 71.1
School enrolment (% gross)
Primary education 83.5 107.6 116.0c 118.1e
Secondary education 28.8 27.7 63.2 77.2e
Tertiary education 5.3 3.8 17.9e 23.1e
School enrolment (% net)
Primary education n.a. 88.1 92.1c 96.5e
Secondary education n.a. n.a. n.a. 67.3e
Population share (%) with
Access to improved water source n.a. n.a. 92.0e 82.0e
Access to improved drinking water 42.0 23.0 88.0b 80.0c
Access to electricity n.a. n.a. 66.3d 64.5d
n.a. = not available. PPP$ = purchasing-power-parity dollars.
a 1980. b 2006. c 2008. d 2009. e 2010.
Sources: World Development Indicators and Global Development Finance Databases (World Bank); Millennium Development Goals Database (UN); ‘Access to improved drinking water’ from the World Water Series by the Paciic Institute: <http://www.worldwater.org/data.html>.
TABLE 2 The Relative Decline of Manufacturing in India and Indonesia (%)
2001 2011
Manufacturing value added as a share of GDP
India 14.7 13.9
Indonesia 29.1 24.3
Share of manufactures in merchandise exports
India 74.8 62.2
Indonesia 56.4 34.2
Source: World Development Indicators (World Bank).
Second, both India’s and Indonesia’s economies have a young population and a labour force expected to grow rapidly in the coming decade11 – by 130 million in India and by 20 million in Indonesia (UNDESA 2011).12 Furthermore, neither country shows evidence of being near the Lewis turning point.13 The pace of man-ufacturing growth is important for generating employment, but so is its pattern. Manufacturing’s share of the economy is twice as large in Indonesia as in India
(24.7% of GDP, compared with 14.5%), but its share of employment is similar in both countries. In Indonesia, it has barely increased since 2004;14 in India, it has declined.15 Indonesia’s dependence on commodities and resource-based indus-tries that rely on capital-intensive technologies risks inhibiting structural change, preventing it from moving towards more labour-intensive technologies, while
India’s recent success in high-end services has contributed signiicantly to GDP
and export growth but has generated little employment, especially for unskilled labourers.
Labour-intensive manufacturing holds the best chance for both countries to
increase GDP growth as well as generate employment, but it cannot respond to both challenges alone. Manufacturing generates demand for inputs and
com-plementary outputs from other sectors such as agriculture and services – which,
in turn, boosts growth and employment. Agriculture, for example, apart from playing a valuable independent role in providing food security and generating income and jobs, can also generate manufacturing jobs through close links with downstream processing industries. India’s global competitive advantage in high-end services provides a similar example of driving growth while at the same time providing critical inputs into domestic manufacturing.
COMPARING SELECTED POLICIES SUPPORTIVE OF MANUFACTURING GROWTH
The previous section made the case that manufacturing is important for growth in India and Indonesia. This section compares four policy areas (in both coun-tries) that support structural change in the economy and encourage productivity in manufacturing to converge with international levels. These policy areas have a common goal: to move labour out of low-productivity agriculture and informal services and into higher-productivity manufacturing.
The irst policy area encourages the transmittal of new ideas, technologies and markets to domestic entrepreneurs, and provides appropriate incentives to irms
to close the productivity gap with their international competitors. Individual
11 The median ages of the populations of India and Indonesia were 25.1 and 27.8, respec -tively, in 2010 (UNDESA 2011).
12 The numbers taken were for the probabilistic median.
13 The Lewis turning point is when agriculture and informal services cease to have sur -plus labour and the real wage of unskilled labour rises rapidly. Agriculture includes isher
-ies, and ‘informal services’ includes wholesale and retail trade; hotels and restaurants; and
community, social and personal services.
14 It increased from 12.3% to 13.9% between February 2005 and August 2012 (BPS 2012). 15 It declined from 12.2% in 2004–05 to 11.4% in 2009–10 (Government of India 2012): 212 (tables 9–11).
policies in this area focus on trade, foreign investment and innovation. The second
aims
to make public infrastructure – especially transport infrastructure – more
available, recognising that manufacturing is particularly infrastructure-intensive. The third seeks to develop human capital, so that skills shortages do not con-strain manufacturing growth. And the fourth smooths the process of structural change and reduces transactions costs associated with the factors of production moving from low- to high-productivity activities. Such policies include
regula-tory arrangements that keep factor markets lexible and allow resources to move eficiently across irms, industries and sectors. In each of these policy areas, I iden -tify similarities and differences in the approach of both countries and ask what each can potentially learn from the other.
Trade and foreign investment policies
In assessing trade and foreign investment policies in India and Indonesia, one must consider the extent to which these policies support the growth of
manufac-turing and productivity convergence and employment generation. From this per
-spective, the evidence points to four key observations. First, India and Indonesia have signiicantly reduced the level of protection by lowering at-the-border and
behind-the-border trade barriers. Second, protection in India, although declin-ing, remains at a higher level than that in Indonesia. Third, protection tends to be higher for agriculture than for manufacturing, impeding structural change away from low-productivity agriculture and towards higher-productivity ing. And fourth, protection appears to be higher for capital-intensive manufactur-ing industries than for those that are labour-intensive, which tends to limit the sector’s capacity to generate employment.
India and Indonesia use tariff and non-tariff barriers for imports of manufac-tured products at the border and apply behind-the-border barriers that also tend to restrict trade. To compare the restrictiveness of trade barriers, I use here the
overall trade restrictiveness index (OTRI) – associated with all at-the-border trade barriers, including non-tariff barriers – a measure that the World Bank updates
regularly (World Bank 2012a; Anderson and Neary 2005). The OTRI is the equiva -lent uniform tariff ‘that if imposed on imports instead of the existing structure of protection would leave aggregate imports at their current level’ (Kee, Nicita and
Olarreaga 2009: 174).
Of the 105 countries for which OTRI estimates are available, only 22 are more
restrictive than India, including Brazil, Colombia, Malaysia, Mexico, Nigeria, the
Philippines and Russia (World Bank 2012a). Indonesia ranks 80th, which makes its trade regime far less restrictive than India’s.16 At the same time, Indonesia is a bigger user than India of non-trade measures that potentially restrict trade. Indonesia employed about 40 major non-trade measures in 2011, compared with India’s 14 (European Commission 2011). Examples of non-trade barriers in
Indo-nesia imposed at the border include the more than 500 manufactured products
that are subject to licences and pre-shipment inspection, or the 200 iron and steel
16 India’s OTRI for manufactured imports is 13.1%, compared with Indonesia’s 3.9% (World Bank 2012a). Data are for 2009, the latest year for which updates are available. The trade barriers that Indonesia faces in export markets are roughly twice as high in aggregate as those it imposes at its own borders, whereas for India they are only half as high.
products that can be imported only by licensed importers and are also subject to
pre
-shipment inspection. Further examples include behind-the-border measures such as restricting public procurement to domestic products for 558 sub-sectors,
or restricting drug imports to those not produced locally but produced abroad by companies that have local facilities.
In some instances, these measures have been introduced to stem illicit trade; in others, to encourage the transfer of technology to Indonesian irms. But irrespec -tive of the mo-tive, they tend to restrict trade and potentially protect domestic
producers, who beneit from the resulting increase in domestic prices.
In both India and Indonesia, agriculture tends to be more protected than manu-facturing, in part to promote food security and employment objectives. But protec-tion of agriculture impedes structural change in favour of manufacturing, which exhibits more rapid global convergence in productivity levels. In Indonesia, the
OTRI for agriculture is almost four times that for manufacturing (15.1%, com
-pared with 3.9%). In India, it is more than ive times as large (69.5%, com-pared with 13.1%) (World Bank 2012a). Agriculture in India also beneits from a range
of domestic subsidies for electricity, fertiliser and water, normally in the form of price ceilings that are well below opportunity cost.
A country’s effective rate of protection (ERP) captures the protective conse-quences of at-the-border and behind-the-border policies. In essence, it compares the domestic value added at domestic and international prices. One recent study of Indonesia’s ERP applies marginal and effective nominal tariffs, as listed in the tariff schedule and multiple free-trade agreements with partner countries, and combines these with price comparisons where non-tariff barriers apply (Marks and Rahardja 2012). The estimates show that the effective rates of protection in
Indonesian manufacturing are relatively low – between 5% and 9% (depending on the methodology) – which is in line with expectations, given Indonesia’s rela -tively low OTRI. The ERP calculations assume that exporters fully avail
them-selves of duty drawback schemes that signiicantly reduce the anti-export bias
of tariff-based protection (Marks and Rahardja 2012). While the study is a useful and timely update to the literature, its calculations are based on nominal tariff data rather than on price comparisons. It therefore captures neither the effect of behind-the-border measures that restrict trade nor the possibility of ‘water under
the tariffs’ occurring in sectors that experience ierce domestic competition.
Although there is no recent comprehensive study of ERP in India, it is reason-able to conclude that India’s ERP levels are, on average, higher than Indonesia’s.
Fernandes and Sharma (2012: 50) show that India’s average ERP declined by two-thirds between 1980 and 2000 but was still around 30%. Banga and Das (2010) con
-irm this, estimating the average ERP in India between 1996 and 2000 to be 40%, down from 125.9% between 1986 and 1990 (when protection was at its peak). It is
almost certain that the effective rate of protection declined between 2000 and 2012 as further reforms were introduced. Import tariffs on manufactures, for example,
fell from an average of 33% in 1999 to 9% in 2009, and the authorities had removed most quantitative restrictions by 2001 (WTO 2011: 57).
Indonesia announced export restrictions on 65 ores and the introduction of an export ban on these ores in 2014 (Burke and Resosudarmo 2012: 307). This will
raise the effective rate of protection for downstream smelting industries, with the intention of encouraging industries to move up the value chain. India’s highly
protected sub-sectors include automobiles, iron and steel, and food manufactur-ing (UNDESA 2011). Most highly protected sub-sectors in India and Indonesia tend to be capital-intensive and generate relatively little employment. The pro-posed increase in protection of the downstream smelting industry in Indonesia is a case in point, as is the high effective protection of automobile assembly in India (Narayanan and Vashisht 2008). There is no evidence that productivity conver -gence is necessarily faster in these sectors than in others. If anything, the lower
the anti-export bias, the greater is the pressure on irms to achieve international
competitiveness, acquire new technologies, and introduce innovative processes
and products. Industries with signiicant protection and a heavy anti-export bias
tend to have fewer competitive pressures, and the size limitations of the domestic market tend to inhibit the achievement of internal or external scale economies.
From a manufacturing perspective, India’s and Indonesia’s foreign-investment regimes have improved signiicantly over the last few decades. Indonesia has been fairly open to foreign investment since 1985, when it liberalised policies affecting
the manufacturing sector. India liberalised its foreign-investment policies in the early 1990s and has since improved them. Today, both countries have only a
rela-tively small list of sectors that are closed to foreign direct investment (FDI). Even
so, this has occasionally created problems. Indonesia, for example, enacted a new
investment law in 2007 that provides national treatment to foreign irms. But it
also contains a negative list for foreign investment, which, in the absence of asso-ciated regulations and the seeming ease with which ministerial decrees ignore the list, has increased uncertainty among foreign investors. In India, a number of measures have had the same effect, the latest of which are policy U-turns related
to FDI in multi-brand retailing and an amendment to the income tax law, which
allows changes in the tax structure to apply retrospectively to foreign investors (Hindu, 31/3/2012).
Both countries restrict most sectors to foreign-investment ceilings and apply
other sector-speciic conditions. In India, however, irms in an increasing number of sectors are allowed to be 100% foreign owned, and foreign investors require no
approvals from the government or the central bank (but they must notify the local
ofice of the central bank) (WTO 2011: 32). Where ceilings apply and the foreign investment is less than $240 million (Rs 12 billion), the Foreign Investment Policy Board has approval authority; investments above that amount require approval
from the Cabinet Committee for Economic Affairs. In Indonesia, responsibilities
are divided across different agencies, depending on the sector. Approval for FDI in inancial services is the responsibility of Bank Indonesia, licences for mining
and power projects are the responsibility of the Ministry of Mines and Energy,
and industry and non-inancial services come under BKPM (the Investment Coor
-dinating Board) (WTO 2007: 33).
Unfortunately, neither country does particularly well in the rankings of
indica-tors relecting the policy environment for invesindica-tors. Of the 56 countries assessed by the OECD (2012) for restrictiveness against FDI, India and Indonesia rank among the four most restrictive. Similarly, out of 185 countries assessed in the Doing Business Indicators prepared by the International Finance Corporation, India is ranked 184th (second to last) for ‘enforcing contracts’, just above East Timor (Indonesia is ranked 144th); both are tied at 49th for investor protection. In
the World Economic Forum’s Global Competitiveness rankings, Indonesia is 50th and India 59th out of 144 countries (WEF 2012).
These rankings do not appear to have dampened FDI in either country (igure 5). India saw a steady increase in FDI from the early 1990s until the global inan
-cial crisis of 2008. FDI has mainly been in manufacturing, with output destined for the large domestic market. FDI in Indonesia bounced back strongly from the 1997–98 inancial crisis and has accelerated in 2011 and 2012 (World Bank 2012b
and BKPM 2012). This robustness stems largely from foreign-investor interest in the domestic market and the commodity sector (including resource-related man-ufacturing).
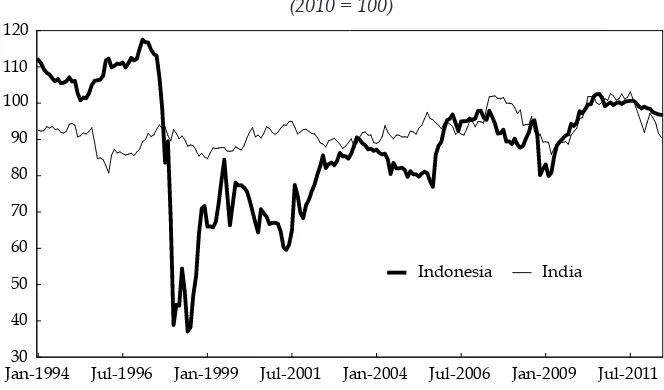
Indonesia’s strength in commodity exports and its attractiveness to foreign investors have, in one respect, also been its weakness. The real exchange rate has
appreciated strongly since the 1997–98 crisis, relecting economic recovery and restored conidence, although it is still below pre-1998 levels, when the exchange rate supported a bubble in domestic asset prices. Further real appreciation could
potentially be harmful. An overvalued currency tends to discourage tradables production, particularly in manufacturing (commodities are tradables, too, but high international commodity prices compensate for currency appreciation). The fact that in 2011 and 2012 an increasing amount of foreign investment entered
non-tradables – wholesale and retail trade, transport, and telecommunications – possibly relects the shift in relative prices away from tradables and towards
non-tradables (BKPM 2012). In addition, Indonesia’s real exchange rate is volatile
in comparison to India’s (igure 6). Evidence suggests that such volatility could
not have been conducive to growth in Indonesian manufacturing in non-resource sub-sectors (Haddad and Pancaro 2010).
Researchers such as Rodrik (2008) and Korinek and Servén (2010) contend that manufacturing in both countries could beneit from undervalued curren -cies, which can overcome government and other externalities, promote structural change, and boost tradables production, including of manufactures. This, in turn, can increase international competitiveness, encourage more learning-by-doing, and achieve greater economies of scale.17 Such a strategy also helps provide a buffer of large foreign-exchange reserves to absorb exogenous shocks. It is not costless, but, as China’s experience suggests, dynamic gains tend to exceed static
losses. Conversely, it is unlikely that India and Indonesia – two large economies – could follow an exchange-rate strategy similar to that of China without causing
friction with trading partners or potentially triggering similar mercantilist strate-gies among their competitors.
Infrastructure and urban development policies
Abundant evidence suggests that infrastructure constraints in Indonesia and
India – especially in urban areas – are hindering growth, development and inno
-vation (OECD 2007: 56; 2010a: 91). A 1% increase in physical infrastructure stock
raises growth rates by one to two percentage points in the short term (but this gradually decays with time as output reaches its potential) (Calderón,
Mor-al-Benito and Servén 2011). Recognising the importance of infrastructure for
growth, both India’s and Indonesia’s governments have made it a priority to
17 See also Berg and Miao (2010) andNouira, Plane and Sekkat (2010).
FIGURE
5 Foreign Direct Investment as a Share of GDP, 1980–2010
(%)
Source: World Development Indicators (World Bank).
alleviate infrastructure bottlenecks as a way to boost productivity growth, espe-cially in manufacturing. In Indonesia, the Master Plan for the Acceleration and
Expansion of Indonesian Economic Development calls for a signiicant expansion in infrastructure investment in 2011–25 – including more than $200 billion for the plan period 2010–14 (an annual rate equivalent to 5% of 2011 GDP) (Alijsahbana 2012; Coordinating Ministry for Economic Affairs 2011). In India, the Approach Paper to the Twelfth Five Year Plan (2012–17) targets infrastructure investment of $1 trillion, or an average of $200 billion a year (slightly more than 10% of 2011 GDP) (Khan 2011); but the government has since backed off this target, owing to
slower-than-expected growth (Ahluwalia 2012).18
The reality, however, is that infrastructure development in both countries has
consistently fallen short of plans. In India’s Eleventh Five Year Plan (2007–12), for example, total infrastructure investment reached $425 billion, failing to meet its $500 billion target. In Indonesia, actual budgetary spending on infrastructure has
fallen persistently short of its allocations. The Indonesian government also has
the complex and dificult task of connecting the country’s scattered archipelago,
which is a challenge not just of building infrastructure but also of revamping reg-ulations governing interisland shipping.
Both governments have been trying to address the many underlying
impedi-ments to infrastructure development. Here I examine three: shortage of inance,
land acquisition, and shortage of capacity and skills.
18 See statement by Montek Singh Ahluwalia, Planning Commission Deputy Chairman, on
16 July 2012, available at
<http://www.moneycontrol.com/news/economy/india-wont-meet-361trillion-infra-investment-target-montek_731016.html>. For the approach paper to the Twelfth Five Year Plan, see Government of India (2011). A inal target has yet to be
issued.
Shortage of inance and the role of the private sector
In India and Indonesia, the need for national infrastructure investment signii
-cantly exceeds iscal capacity. Both governments have turned to the private sec
-tor to partner in inancing, constructing and operating infrastructure projects. In India, a public–private partnership (PPP) can receive a grant from the central government of up to 20% of a project’s cost through a government infrastructure inancing facility.19 PPP projects in many infrastructure sub-sectors can also be inanced entirely by foreign investors, without government approval.20 The Indo-nesian government has established the Indonesia Infrastructure Guarantee Fund (IIGF), to guarantee government obligations under PPP contracts and to protect
it against contingent liabilities.21 Following India’s example, it has also set up an infrastructure inance institution, backed by international and bilateral inance
institutions, to channel long-tenor local currency debt from the private sector. India’s record in the last two decades illustrates its success, compared with
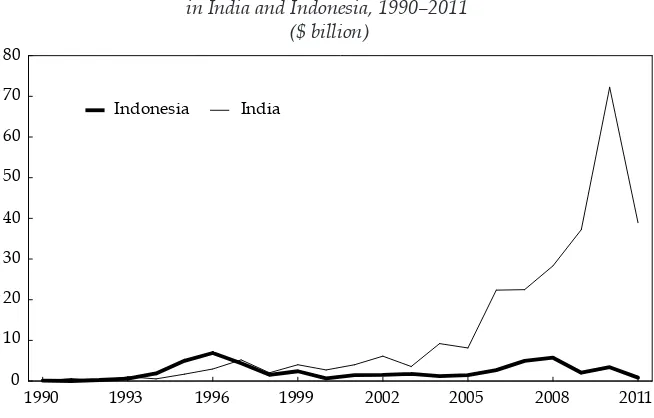
Indonesia’s, in attracting private participation in infrastructure projects (igure 7). Indonesia was perhaps slightly ahead of India’s trajectory in the years prior to the 1997–98 crisis, but it has since languished. In the most recent year for which data is available, 2010–11, India implemented 95 PPP projects, worth $72 billion;
Indonesia implemented only two, worth $3.4 billion.
19 The India Infrastructure Finance Company Ltd can inance projects itself or re-inance banks and other inancial institutions.
20 Infrastructure sub-sectors permitted to have 100% FDI are power, aviation, construc -tion and development, industrial parks, telecommunica-tions, and special economic zones.
21 The IIGF appraises the viability and risks of projects, structures the guarantees, and
charges the PPP operator a fee for covering the government’s obligations.
FIGURE 6 India and Indonesia: Real Effective Exchange Rates, 1994–2011 (2010 = 100)
Source: Bank for International Settlements Database.
PPPs are expected not only to accelerate infrastructure development, by
bridg-ing
the inancing gap, but also to subject project construction and operation to
more competition. In sub-sectors where regulations have been liberalised in India, such as civil aviation and telecommunications, the private sector has acquired in excess of three-quarters of the market share. Indeed, India’s telecommunications
network has become the third largest in the world, having signiicantly improved
the coverage, quality and reliability of telecommunications at a fraction of the cost of similar services in other countries. In contrast, the massive blackouts that swept through most of India in July 2012 provide an example of the other extreme. The
power sector is still dominated by state enterprises and riddled with ineficien -cies, corruption and inadequate capacity. Indonesia has some parallels. The pri-vate provision of telecommunications has expanded rapidly, although a few large
operators still dominate the market; but in many other sectors, electricity and
transportation in particular, much more can be done to increase private-sector participation.
Land acquisition
Bottlenecks in land acquisition are another reason why infrastructure
devel-opment – especially of transport infrastructure – continues to lag in India and
Indonesia. Indonesia’s decentralisation since 2001 has complicated an already complex acquisition process, and India has outdated acquisition laws. But on bal-ance it appears India is making some headway. Indonesia has built an average of
23 kilometres of toll road a year since 1978 (OECD 2010b); India was adding 11
kilometres a day as of October 2011, and aims to raise this to 20 kilometres a day by 2014 (Times of India,17/10/2011).
FIGURE 7 Volume of Private Provision of Infrastructure (PPI) Projects
in India and Indonesia, 1990–2011
($ billion)
Source: World Bank and PPIAF, PPI Project Database.
In both countries, delays in land acquisition lead to cost overruns. In Indonesia,
the
current law requires that land be acquired at fair market value; but since there
is no legal process to determine fair market value, most land-acquisition trans-actions go to court, where they tend to languish for years. Moreover, speculators often buy land earmarked for acquisition and then use delaying tactics and legal
procedures to maximise their returns. Finally, land titling and registration remain
incomplete, which adds uncertainty.
India faces similar problems. Its government recently stepped up efforts to acquire land for companies, such as for Tata Motors’ Nano project in West Bengal, in 2006, arguing that these were for a public purpose.22 Its acquisition of land for the Nano project was strongly opposed by landholders and politicians, however, and eventually had to be abandoned. Moreover, India’s prevailing land-acquisi-tion law does not menland-acquisi-tion the rehabilitaland-acquisi-tion or resettlement of those evicted from land acquired for public purposes, and this has often led to court proceedings.
Both countries have since drafted new land-acquisition laws. Indonesia’s was
passed by parliament in December 2011, and the National Land Agency (Badan Pertanahan Nasional, BPN) has issued the implementing regulations. The new law imposes time limits on different phases of the land-acquisition process and
clariies the rights and responsibilities of the different agencies involved. Provin
-cial governors are now responsible for inalising land-acquisition plans (which
means that more than one governor may be involved in interprovincial projects) and that BPN, not local governments, will be responsible for implementation
(Mahi and Nazara 2012: 27–29).
The draft of India’s new land-acquisition law was prepared well before
Indo-nesia’s, but it has still to be approved by parliament. Called the Land Acquisi
-tion, Rehabilitation and Resettlement Bill, it includes greater speciicity on key
aspects of land acquisition and, if approved, would give land-owners leverage when dealing with government.23 It would also give the government the right to acquire land for PPP projects designed to deliver a public good or public ser-vice, which would clarify the confusion surrounding current laws. There is little prospect, however, of the law’s rapid passage, given the fragility of the political coalition at the national level in New Delhi and the fraught political sensitivities surrounding land acquisition.
Shortage of capacity and skills
Infrastructure PPPs often face complex issues of pricing, inancing, risk shar -ing, risk management and regulatory oversight. PPP contracts differ from stand-ard engineering, procurement and construction contracts, which are so familiar to governments. Properly identifying, designing and managing PPP projects
requires certain skills, knowledge, experience and institutional arrangements. For
example, India and Indonesia need systems to assess unsolicited PPP proposals from the private sector, as well as communications and consultation strategies
22 India’s land-acquisition law dates back to 1894, but it was amended in 1962 to include
the acquisition of land for companies involved in a ‘public purpose’.
23 A draft of the bill can be seen at <http://rural.nic.in/sites/downloads/general/LS%20 Version%20of%20LARR%20%20Bill.pdf>.
that
take into account the views of all stakeholders – clients, service providers, civil society and the private sector – before projects commence.
In India, many PPP projects prepared by states tend to be unrealistic and ‘unbankable’ (World Bank 2006). To inform pricing, governments must analyse consumers’ ability and willingness to pay for public services. They must also
identify any risks (whether related to inlation, interest rates, politics, construc -tion, foreign-exchange rates, payments or regulations) before projects commence,
and develop strategies to manage them. For example, budgets, long-term expend -iture frameworks and any calculations of the sustainability of public debt must incorporate contingent state liabilities from PPP projects.
India’s increasingly large pipeline of PPP projects and its growing experience in infrastructure development are reducing delays in design and implementation. But PPP contracts can extend for 20 to 30 years, and it is still too early to say whether they will withstand the test of time. Indonesia is only now beginning to expand its PPP program and could learn much from India.
Human-capital development
Much evidence points to educational attainment’s association with subsequent
higher growth rates per capita (Barro 1991; Benhabib and Spiegel 1994; Bils and Klenow 2009; Sala-i-Martin 1997). Education ampliies one’s ability to absorb new information, solve problems independently and acquire technical proiciency.
This is particularly true for manufacturing. Of course, India and Indonesia have improved their educational standards over the last three decades, but investors still consider skilled manpower one of the main constraints to future develop-ment, especially in manufacturing.
Educational attainment in both countries compares poorly internationally, and India’s record is weaker than Indonesia’s. In its education index for 2011, the United Nations Development Programme (UNDP) ranks Indonesia 120th and India 146th of 188 countries (lower than Sao Tome and Principe, Togo, Cambodia, and Congo).24 Indonesia’s adult literacy rate is 92% (ranked 49th of 103 develop-ing countries); India’s is 63% (ranked 85th). Indonesia does better when it comes to expected years of schooling, with 13.2 years, ranking 78th out of 192 countries; India, with 10.3 years, ranks 148th (igure 8).25 The average Indonesian adult had attained 5.8 years of schooling by 2011 (132nd of 187 countries), the average Indian adult only 4.4 years (152nd).26
Importantly, outcomes differ from inputs. Gross and net enrolment ratios in India and Indonesia at the primary, secondary and tertiary levels have improved
steadily since the mid-1970s. But they bear little relation to educational outcomes.
The OECD’s Program for International Student Assessment (PISA) provides inter-nationally comparable measures of educational outcomes.27 Its assessments of
24 See <http://hdr.undp.org/en/statistics/>.
25 UNDP (2011) deines expected years of schooling as ‘the number of years of schooling that a child of school entrance age can expect to receive if prevailing patterns of age-speciic
enrolment rates persist throughout the child’s life’.
26 UNDP (2011) deines the mean years of schooling as ‘the average number of years of education received by people 25 years and older’.
27 See <http://www.oecd.org/pisa/>.
Indonesia, in 2009, and of two Indian states (Himachal Pradesh and Tamilnadu),
in 2010, yield sobering results. The two Indian states rank lower than all the 74 countries (except for Kyrgyzstan) in the 2009–10 PISA; Indonesia does better, but still ranks 56th out of 65 countries. About a quarter of Indonesian and about half of Indian 15-year-olds were not proicient at the most basic level of science. As one researcher put it, their knowledge of science shows ‘so little proiciency …
it is impossible to distinguish from not knowing anything at all’ (Pritchett 2012). Improving primary and secondary education is a clear priority in India and Indo-nesia. Both countries need to attract high-quality teachers, increase school budg-ets and reduce teacher absenteeism.
Tertiary education in India and Indonesia has also expanded. Indonesia’s gross
enrolment in tertiary education institutions in 2010 was 23%, compared with 18% in India, and its drop-out rates were lower (World Bank 2012b; Hill and Thee 2012). Today, around ive million students attend tertiary education institutions
in Indonesia, compared with 16 million in India (Times, 16/8/2012). Both coun -tries have a heterogeneous mix of institutions to accommodate this large student
population – central, provincial, public, private, specialist, conventional, multi
-disciplinary, vocational, professional and research – but weak regulations and lit -tle government oversight have produced weak quality control and graduates of variable quality. In India, a massive private coaching industry has mushroomed, helping students gain entry into credible educational institutions. Most formal-sector employers, including the government itself, run their own examinations
for new employees, since the pedigree of tertiary qualiications cannot be trusted. FIGURE 8 India and Indonesia: GNI Per Capita and
Expected Years of Schooling, 1980–2011a
a GNI = gross national income. The vertical axis indicates the number of years of schooling that a child can expect to receive, while the horizontal axis (note the logarithmic scale) indicates GNI per capita in 2005 purchasing-power-parity dollars.
Source: Human Development Index Database (United Nations).
As a result, only one Indian university (and no Indonesian university) is in the top 400 world universities ranked by the Times Higher Education World
Univer-sity
Rankings in 2011–12. 28 The Academic Ranking of World Universities29 ranks the Indian Institute of Science and two of India’s institutes of technology in the
top 150 universities in computer science and also ranks the Indian Institute of
Science in the top 100 universities in engineering/technology and computer sci-ences, but they are islands of excellence in a sea of mediocrity. In previous years, some of Indonesia’s top four universities have made it into these rankings, but they, too, are surrounded by a tertiary system with low standards and poor qual-ity control.
Both India’s and Indonesia’s tertiary systems have few links with universities abroad and weak links with international research networks. Peer review of
aca-demic work is rare. Low salaries force faculties to shoulder heavy teaching loads
or increase administrative assignments to boost salaries, so there is little time for research. Poor incentives contribute to poor performances, and strong vested
interests make reform dificult.
In sum, India and Indonesia suffer from severe shortages in human capital. Indonesia, though, seems to be more willing to make the tough reform decisions.
Its constitutional amendment requiring 20% of budgetary expenditure for edu -cation has diverted more resources to the sector, including to tertiary edu-cation institutions. It is also seriously considering a variety of reforms, such as opening tertiary education to foreign universities. India, in contrast, seems to have made little progress. The government’s recent bold effort to pass a law permitting for-eign universities to grant degrees independently and to set up campuses in the country was thwarted by minority members of the governing coalition, and, like other important reforms, this has been placed on the backburner.
Policies promoting factor-market lexibility
This section examines policies in India and Indonesia that facilitate (or impede)
the low of resources from low-productivity agriculture and informal services to
high-productivity manufacturing. Such policies have two intertwined and insep-arable dimensions: one affecting the Schumpeterian process of creative
destruc-tion, whereby capital and labour are constantly reorganised and reconigured within irms, industries, sub-sectors and sectors as competition and technology shape rates of return; and the other inluencing the operation of factor markets themselves – labour, inance and land – which allow factors to low eficiently in
response to these changing incentives.
Neither India nor Indonesia performs well in international comparisons of
fac-tor-market lexibility (International Finance Corporation 2012). Of 185 economies,
Indonesia ranks 161st and India 169th for policies related to starting a business. While it takes more time to get a business permit in Indonesia (45 days on aver -age, compared with 29 in India), the associated fees and professional services cost
less (18% of per capita income on average, compared with 47% in India) and the
28 See <http://www.timeshighereducation.co.uk/world-university-rankings/>. 29 See <http://www.arwu.org/index.jsp>.
paid-in minimum capital requirement is less onerous (47% of per capita income, compared with 150% in India).30
Starting a business may be dificult in India, but obtaining a construction permit seems almost impossible. On average, it takes an Indian entrepreneur 227 days to receive a construction permit (158 days in Indonesia), of which it takes 30 days, on average, to obtain a no-objection certiicate from the Tree Authority. India’s fees to obtain a construction permit are correspondingly astronomical – more than 1,650% of per capita income (compared with 105% in Indonesia). No surprise, then, that India ranks 183rd out of 185 economies for obtaining a construction per -mit, just ahead of Albania and Eritrea, whereas Indonesia ranks 72nd). Declaring insolvency in the two countries is also dificult. It takes roughly seven years for an Indian entrepreneur to go through complete insolvency proceedings (5.5 years in
Indonesia). The entrepreneur can then look forward to recouping 20 cents in the dollar (14 cents in Indonesia).
It doesn’t have to be this way. In Singapore, it takes three days to register a
business, 28 days to get a construction permit and less than 10 months to complete
insolvency proceedings. Red tape breeds corruption and undermines the very
laws that such regulations are meant to support. Of 176 countries, India ranks 94th and Indonesia 118th in Transparency International’s Corruption Perceptions Index (2012), in which higher rankings relect lower levels of corruption.31 Lax imple -mentation of laws reduces the cost of louting them and gives rise to a bimodal distribution of irm size: large irms able to navigate their way through the thicket of regulations; and small irms that survive below the government’s radar screen, as part of a large informal sector (Dabla-Norris, Gradstein and Inchauste 2005; Dutta, Kar and Roy 2011; Marjit, Ghosh and Biswas 2007; Mishra and Ray 2010).
Employment regulations in both countries have segmented their respective labour markets, which, in turn, has affected economic performance and impeded
structural change. India’s laws, for example, make it dificult to dismiss employees with ixed-term or open-ended contracts. As a result, about 86% of its labour force
is employed in the informal sector, and almost two-thirds of those in the formal
sector are daily labourers who receive none of the insurance or pension beneits
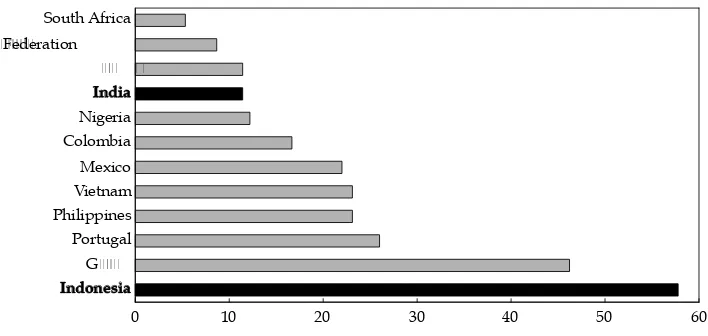
of formal employment. Indonesia’s labour law also places tight constraints on the dismissal of workers, requiring one of the world’s highest severance payments
and more than ive times that of India (igure 9). Ironically, these constraints are
intended to protect workers and reduce poverty but do little of either
(Alijsah-bana and Manning 2006). The costs of informality are high – the median informal wage is 30% below the formal sector wage, and even informal workers in the formal sector earn 25% less than their formal-sector colleagues with employment
contracts (World Bank 2010).
The explicit and hidden costs of employment arguably discourage labour-intensive production in the formal sectors of both countries and consequently favour capital-intensive industries. They also discourage small, competitive,
labour-intensive irms from growing, acquiring economies of scale and becom -ing even more competitive. Mengistae et al. (2006) suggest that labour-market
30 The paid-in minimum capital requirement is the amount an entrepreneur needs to de-posit in a bank.
31 Note that in 2001, India ranked 71st and Indonesia 88th out of 91 countries.
inlexibility
in India has contributed to its poor economic performance compared
with China’s, in part because Chinese irms (unlike Indian irms) have been able
to achieve economies of scale in labour-intensive manufacturing and thereby suc-ceed in world markets.
Two factors mitigate the distortive impact of labour regulations in both
countries. First, the use of informal labour in formal-sector manufacturing bends
labour-market regulations in both countries but does not break them. And, sec-ond, authorities have avoided implementing such regulations, having recognised their distortive effect.32 India, for example, which has had a powerful trade-union movement since independence, has seen a large decline in the number of strikes. The reasons are many: the number of casual labourers has reduced the share
of unionised labour in the workforce; the public has become increasingly dis-enchanted with union militancy; state governments increasingly promote growth over wage demands by unionised labour; employers are more willing and able to replace striking workers with replacements; and there has even been a discern -ible change in the attitude at the Supreme Court (previously a strong supporter of labour rights), which declared in a 2003 decision that there is ‘no fundamental right to strike’ (Papola 2012).
Indonesia appears to be going in the opposite direction. The recently
intro-duced (2012) annual rite of minimum-wage negotiations has provided a lashpoint
for labour unrest, and its increasing politicisation is leading to minimum-wage
demands that have little relation to growth in labour productivity. Furthermore, the government’s decision to ban the outsourcing of labour contracts beyond ive
ancillary activities and a strong, union-led push to restrict formal-sector employ-ers from hiring workemploy-ers without long-term contracts will deepen segmentation
32 A less charitable explanation involves the ability of businesses to bribe oficials tasked
with implementing the law.
FIGURE 9 Severance Pay for Redundancy Dismissal, Selected Countries, 2013a
a Average number of salary weeks for workers with 1, 5 and 10 years of tenure.
Source: Doing Business Indicators (International Finance Corporation).
in the labour market, drive a bigger wedge between wages in the formal and informal sectors, discourage scale economies and labour-intensity in manufactur-ing, and impede structural change.
THE POLITICAL ECONOMY OF POLICY MAKING
The political economies governing manufacturing in India and Indonesia have striking similarities and differences. Both countries, for example, have fragile coa-lition governments that appear to be bound more by expedience than by ideology. Parties within Indonesia’s governing coalition, for example, are easier to tell apart by the personalities that lead them than by the political philosophies that guide them. In India, the current minority government, like ones before it, includes a governing coalition that is short of a parliamentary majority and so depends on ad hoc support from parties external to the government.
As a result, policy making displays the usual characteristics of coalition
gov-ernments. On the negative side, consensus on reforms is dificult to reach, which
rules out bold initiatives. Marginal parties have more power than their electoral strength would indicate, and special interests (regional, business or religious) dilute, and sometimes even divert, the dominant party’s intention. Populist poli-cies are more likely to prevail, because they tend to appeal to a broad spectrum of coalition interests. A party’s dependence on big business and other powerful
interests for campaign inance can also inluence their policy decisions. On the positive side, the absence of signiicant legislative action provides policy stability
and minimises the risk of unilateral action by minority interests or by any one
party. Laws need to be discussed threadbare and satisfy a broad range of interests
before having a good chance of being approved.
These characteristics have shaped policy action (or inaction) in both countries. Neither government has succeeded in reducing energy and fertiliser subsidies that starve other, higher-priority programs of funding, or in taking bold measures when it comes to reforming trade and foreign-investment policies.
There are, however, two ways in which economic governance is different in
India and Indonesia. The irst is Indonesia’s presidential system of government,
in which parliament and the judiciary can check and balance the power of the
president. Its legislature has the authority to revise laws – including the budget –
submitted by the executive, which gives parliamentarians the incentive to revise
laws for the beneit of their constituencies ahead of the national interest. In con -trast, India’s parliamentary system gives the prime minister considerable author-ity to advance an agenda, since parliament can vote for or against a bill but cannot revise it.33
The second is the role of sub-national government in both countries. Indone-sia’s decentralisation laws give local governments public-expenditure responsi-bilities, but districts tend to be small and do not have the economic strength to craft economic policies independently. At the same time, provinces do not have
iscal authority. India, in contrast, has a federal structure in which the constitution
gives states the responsibility for much of the public service, including the legal
33 Of course, bills are revised frequently to obtain a majority vote in parliament, but the process is controlled by the executive and not by the legislature.
framework governing most manufacturing (as well as agriculture, mining and services). As a result, although coalition politics at a national level may hamper bold legislative action, the states have the constitutional authority and the critical mass to adopt many policies that can help spur manufacturing growth, including those governing the availability of local infrastructure, water and electricity. This independence of action, coupled with good leadership, has recently contributed to accelerating growth in some states, even as national GDP growth has slowed.
India’s and Indonesia’s commitment to democracy and decentralisation is impressive and needs to be nurtured and sustained. At the same time, their politi-cal and democratic systems need to evolve in ways that balance the freedoms and rights of individuals and the ability of society and the government to act in the national interest. That balance has yet to be achieved.
CONCLUSION
India and Indonesia are at different stages of development, but they confront
almost
identical challenges – including the need to encourage rapid manufactur -ing growth. Their trade, foreign investment and infrastructure policies, while not perfect, are on the right track, although both countries need to guard against pop-ulist protectionist tendencies. Educational opportunities have expanded in both countries, yet educational outcomes remain well below international standards. Unless these outcomes improve, and compare favourably with other emerging
market economies, India and Indonesia will ind it increasingly dificult to com -pete internationally.
There are striking differences, too. India, for example, can learn from Indonesia and go further in liberalising trade, to reduce the effective protection rate afforded to manufacturing and to lower the anti-export bias embedded in trade incen-tives. India can also learn from Indonesia’s experience with multi-brand retailing, which has demonstrated that an openness to foreign investment can complement
and augment domestic capabilities and signiicantly improve the eficiency of the
value chain in retail. And although Indonesia’s primary and secondary education
sectors can beneit from quality improvements, they have been far more successful
than India’s in increasing both literacy and the marginal productivity of labour. At the same time, Indonesia can learn from India’s experience. In particular, it would be worth studying how India has been able to increase the number of PPP projects and considering whether those lessons could apply to Indonesia.
Similarly, Indonesia must ind a way to depoliticise annual increases to minimum wages – India could provide an example of how this could be accomplished.
Indonesia may also wish to learn from India’s federal structure, which encour-ages economic competition among sub-national entities, drives economic growth and adds an additional layer of resilience to the economic system.
Complex political structures complicate reform and decision-making processes in both countries, and democratic institutions remain imperfect and are still evolv-ing. But as they evolve, they must balance the importance accorded to individual freedoms and human rights with the necessity for collective action in support of manufacturing when the national interest demands it. Both will be needed for the daunting development challenge that lies ahead.
REFERENCES
Alijsahbana, A. (2012) ‘Effective public spending: the case of infrastructure’, Paper
pre-sented at the 2012 OECD Global Forum on Development, Paris, 29 February, available
at <http://www.oecd.org/site/oecdgfd/49793186.pdf>.
Alijsahbana, A. and Manning, C. (2006) ‘Labour market dimensions of poverty in Indone -sia’, Bulletin of Indonesian Economic Studies 42 (2): 235–61.
Anderson, J. and Neary, P. (2005) Measuring the Restrictiveness of Trade Policy, MIT Press, Boston.
Aswicahyono, H., Hill, H. and Narjoko, D. (2011) ‘Indonesian industrialization: a
late-comer adjusting to crises’, UNU-WIDER Working Paper No. 2011/53.
Banga, R. and Das, A. (2010) ‘Role of trade policies in growth of Indian manufacturing sec-tor’, UNCTAD, Centre for WTO Studies, December, available at
<http://mpra.ub.uni-muenchen.de/35198/1/MPRA_paper_35198.pdf>.
Bardhan, P. (2010) Awakening Giants, Feet of Clay, Princeton University Press, New Jersey. Barro, R.J. (1991) ‘Economic growth in a cross section of countries’, Quarterly Journal of
Economics 106 (2): 407–43.
Bénétrix, A.S., O’Rourke, K. and Williamson, J. (2012) ‘The spread of manufacturing to the periphery, 1870–2007: eight stylized facts’, NBER Research Working Paper 18221, avail -able at <http://www.nber.org/papers/w18221>.
Benhabib, J. and Spiegel, M.M. (1994) ‘The role of human capital in economic develop-ment: evidence from aggregate cross-country data’, Journal of Monetary Economics 34
(2): 143–74.
Berg, A. and Miao, Y. (2010) ‘The real exchange rate and growth revisited: the Washington
consensus strikes back?’, International Monetary Fund, Research Department and Afri
-can Department, IMF Working Paper WP/10/58.
Bils, M. and Klenow, P. (2009) ‘Does schooling cause growth?’, American Economic Review
90 (5): 1160–80.
BKPM (Indonesia Investment Coordinating Board) (2012) Indonesia Investment Coordi-nating Board Press Release, 22 October 22, available at <http://www3.bkpm.go.id/
contents/news_detail/114801/Domestic+and+Foreign+Direct+Investment+Realizati on++Quarter+III+and+January+%E2%80%93+September+of+2012>.
BPS (Badan Pusat Statistik) (2012) ‘Population 15 years of age and over who worked by main industry 2004–2012’, National Labour Force Survey, available at <http://www.bps. go.id/eng/tab_sub/view.php?kat=1&tabel=1&daftar=1&id_subyek=06¬ab=2>. Burke, P.J. and Resosudarmo, B.P. (2012) ‘Survey of recent developments’, Bulletin of
Indo-nesian Economic Studies 48 (3): 299–324.
Calderón, C., Moral-Benito, E. and Servén, L. (2011) ‘Is infrastructure capital productive? A
dynamic heterogeneous approach’, Documentos de Trabajo No. 1103, Banco de España. Coordinating Ministry for Economic Affairs (2011) Master Plan for the Acceleration and
Expansion of Indonesian Economic Development, Jakarta.
Dabla-Norris, E., Gradstein, M. and Inchauste, G. (2005) ‘What causes irms to hide output? The determinants of informality’, IMF Working Paper WP/05/160.
Dutta, N., Kar, S. and Roy, S. (2011) ‘Informal sector and corruption: an empirical
investiga-tion for India’, IZA Discussion Paper No. 5579.
European Commission (2011) ‘Trade restrictive measures identiied in the context of the economic crisis, October 2010–September 2011’, Eighth Report on Potentially Trade
Restrictive Measures, available at <http://trade.ec.europa.eu/doclib/docs/2011/
october/tradoc_148288.pdf.>
Fernandes, A.M. and Sharma, G. (2012) ‘Together we stand: agglomeration in Indian man -ufacturing’, World Bank Policy Research Working Paper No. 6062.
Government of India (2011) A New Approach to the Twelfth Five Year Plan 2012–17, available at <http://planningcommission.nic.in/plans/planrel/index.php?state=planbody.htm>.
Government of India (2012) Economic Survey, 2011–12, available at <http://indiabudget. nic.in/es2011-12/echap-09.pdf>.
Gulati
, A. and Fen, S. (2007) The Dragon and the Elephant: Agricultural and Rural Reforms in China and India, Johns Hopkins University Press, Baltimore.
Haddad, M. and Pancaro, C. (2010) ‘Can real exchange rate undervaluation boost exports and growth in developing countries? Yes, but not for long’, Vox, 8 July, available at <http://www.voxeu.org/article/can-real-exchange-rate-undervaluation-boost-exports>.
Hill, H. and Thee, K.W. (2012) ‘Indonesian universities in transition: catching up and open-ing up’, Bulletin of Indonesian Economic Studies 48 (2): 229–51.
Hofman, B., Zhao, M. and Ishihara, Y. (2007) ‘Asian development strategies: China and
Indonesia compared’, Bulletin of Indonesian Economic Studies 43 (2): 171–99.
International Finance Corporation (2012) Doing Business Indicators, available at <http:// www.doingbusiness.org/>.
Kee, H.L., Nicita, A. and Olarreaga, M. (2009) ‘Estimating trade restrictiveness indices’, Eco-nomic Journal 119: 172–99, available at <http://siteresources.worldbank.org/INTRES/
Resources/469232-1107449512766/ecoj_2209>.
Khan, H.R. (2011) ‘Infrastructure inancing in India – progress and prospects’, Lecture
delivered by the Deputy Governor, Reserve Bank of India, at the Diamond Jubilee
Inter-national Conference on Frontiers of Infrastructure Finance, Kharagpur, 29 December. Korinek, A. and Servén, L. (2010) ‘Undervaluation through foreign reserve accumulation:
static losses, dynamic gains, Vox, 10 May, available at <http://www.voxeu.org/arti-cle/exchange-rate-undervaluation-can-neo-mercantilism-work>.
Lankester, T. (2004) ‘Asian drama: the pursuit of modernization in India and Indonesia’,
Asian Affairs 35 (3): 291–304.
McMillan, M. and Rodrik, D. (2011) ‘Globalization, structural change and productivity
growth’, NBER Working Paper No. 17143, available at <http://www.nber.org/papers/
w17143>.
Maddison, A. (2008) ‘Statistics on world population, GDP and per capita GDP, 1–2008 AD’,
University of Groningen, available at <http://www.ggdc.net/MADDISON/oriindex. htm>.
Mahi, B.R. and Nazara, S. (2012), ‘Survey of recent developments’, Bulletin of Indonesian Economic Studies 48 (1): 7–31.
Marjit, S., Ghosh, S. and Biswas, A. (2007) ‘Informality, corruption, and trade reform’, Euro-pean Journal of Political Economy 23 (3): 777–89.
Marks, S.V. and Rahardja, S. (2012) ‘Effective rates of protection revisited for Indonesia’, Bulletin of Indonesian Economic Studies 48 (1): 57–84.
Mengistae, T., Morck, R., Xu, L.C. and Yeung, B. (2006) ‘China vs India: A microeconomic
look at comparative macroeconomic performance’, background paper prepared for Dancing with Giants: China, India and the Global Economy, Institute for Policy Studies and the World Bank, available at <http://siteresources.worldbank.org/INTCHIINDGLO -ECO/Resources/chinavsindia_draft2.doc>.
Mishra, A. and Ray, R. (2010) ‘Informality, corruption, and inequality’, Working Paper No.
22127, Department of Economics, University of Bath.
Narayanan, B. and Vashisht, P. (2008) ‘Determinants of competitiveness of the Indian auto
industry’, Working Paper No. 201, Indian Council for Research on Economic Relations, available at <http://www.icrier.org/pdf/working%20paper%20201_inal.pdf>. Nouira, R., Plane, P. and Sekkat, K. (2010) ‘Exchange rate undervaluation to foster
manu-factured exports: a deliberate strategy?’, CERDI, Etudes et Documents, E 2010.10, avail-able at <http://hal.archives-ouvertes.fr/docs/00/55/31/63/PDF/2010.10.pdf>.