Full Terms & Conditions of access and use can be found at
http://www.tandfonline.com/action/journalInformation?journalCode=cbie20
Download by: [Universitas Maritim Raja Ali Haji] Date: 17 January 2016, At: 23:27
Bulletin of Indonesian Economic Studies
ISSN: 0007-4918 (Print) 1472-7234 (Online) Journal homepage: http://www.tandfonline.com/loi/cbie20
Official Poverty Measurement in Indonesia since
1984: A Methodological Review
Jan Priebe
To cite this article: Jan Priebe (2014) Official Poverty Measurement in Indonesia since 1984:
A Methodological Review, Bulletin of Indonesian Economic Studies, 50:2, 185-205, DOI: 10.1080/00074918.2014.938406
To link to this article: http://dx.doi.org/10.1080/00074918.2014.938406
Published online: 30 Jul 2014.
Submit your article to this journal
Article views: 455
View related articles
View Crossmark data
Bulletin of Indonesian Economic Studies, Vol. 50, No. 2, 2014: 185–205
ISSN 0007-4918 print/ISSN 1472-7234 online/14/000185-21 © 2014 Indonesia Project ANU http://dx.doi.org/10.1080/00074918.2014.938406
* TNP2K = Tim Nasional Percepatan Penanggulangan Kemiskinan (National Team for
the Acceleration of Poverty Reduction), Ofice of the Vice-President. I would like to thank Anne Booth, Isis Gaddis, Fiona Howell, Stephan Klasen, Riyana Miranti, Suahasil Naz -ara, Ririn Purnamasari, Elan Satriawan, Sudarno Sumarto, Matthew Wai-Poi, and all three anonymous referees for valuable input and comments, and Mercoledi Nikman Nasiir, Wis-nu Harto Adi Wijoya, and Novat Pugo Sambodo for their outstanding research assistance. Special thanks goes to BPS, and in particular Ahmad Avenzora, for providing me with
clariications on the way that it has calculated oficial poverty rates. The views expressed
in this article are mine alone and do not represent the views of TNP2K.
OFFICIAL POVERTY MEASUREMENT IN INDONESIA SINCE
1984: A METHODOLOGICAL REVIEW
Jan Priebe*
University of Göttingen; TNP2K, Jakarta
This article describes how the measurement of the oficial Indonesian poverty ig -ures has evolved since 1984, when Badan Pusat Statistik (BPS), Indonesia’s central
statistics agency, published its irst poverty report. Since then, BPS has on several
occasions revised the underlying methodology for how it calculates poverty. These changes have, in general, improved the way that poverty in Indonesia is
meas-ured, but they make it dificult to compare poverty igures over time. In fact, only
poverty estimates (at the national and provincial level) since 2007 are based on the
same methodological approach. This article presents the irst detailed description of oficial poverty measurement in Indonesia since Booth’s (1993) study, in English,
and Sutanto and Avenzora’s (1999) study, in Indonesian. It constitutes a unique
re-pository for anybody who wants to understand the technical details of oficial pov -erty measurement in Indonesia.
Keywords: poverty measurement, poverty line, prices, methodology, Susenas
JEL classiication: I31, I32
INTRODUCTION
Oficial poverty statistics in Indonesia are calculated by Badan Pusat Statistik (BPS), the central statistics agency. Since the mid-1980s, policymakers and academ-ics have used BPS poverty statistacadem-ics to guide the allocation of public funds and to derive policy recommendations. Yet despite the importance of these statistics for policy, little documentation exists on how BPS derives its poverty igures. Although BPS regularly publishes the reports Data dan informasi kemiskinan (Poverty data and information) and Analisis dan penghitungan tingkat kemiskinan (Analysis and calcu-lation of the poverty rate), the technical sections in these reports are very short. The
186 Jan Priebe
last detailed description in English on BPS poverty measurement is that of Booth (1993), while the last in Indonesian is that of Sutanto and Avenzora (1999).1 These
publications are rich sources of information on poverty measurement in Indonesia, but they are now dated and do not cover every important technical area.
The absence since 1993 of any detailed documentation in English on oficial poverty measurement in Indonesia is unsatisfactory. Until about 1993, the World Bank regularly provided a detailed source of information on poverty measure-ment. Before 1984, the year of BPS’s irst oficial poverty report, the World Bank and its staff produced its own poverty estimates for the country in order to assess the extent and the trend of poverty in Indonesia (Booth 1993). It stopped produc-ing such estimates after 1984, the year of BPS’s irst oficial poverty report, to avoid conlicts with the oficial BPS igures.2 Yet World Bank staff continued to
provide important technical input into BPS’s methodology for calculating oficial poverty rates. In particular, Martin Ravallion, who worked on poverty measure-ment in Indonesia in the late 1980s and early 1990s, published a series of impor-tant papers and articles (Ravallion and Huppi 1991; Ravallion and Van der Walle 1991a, 1991b; Bidani and Ravallion 1993; World Bank 1993). With the World Bank redirecting its activities in Indonesia, the publication of technical articles and reports related to oficial BPS poverty measurement stopped, and the academic literature has yet to ill the knowledge gap. While most studies have relied on the oficial BPS poverty statistics, a few have tried to come up with alternative poverty estimates (Asra 1989; Pradhan et al. 2000, 2001; Levinsohn, Berry, and Friedman 2003; Nashihin 2007; Miranti 2010; Miranti et al. 2013). The oficial BPS methodology, however, remains largely undiscussed in these studies.
This article’s principal objective, then, is to ill an important gap in the litera-ture by explaining in detail how poverty is oficially measured in Indonesia and how BPS‘s methodological approach of measuring poverty has evolved. It con-stitutes a unique repository for anybody who wants to understand the technical details of oficial poverty measurement in Indonesia.
POVERTY MEASUREMENT UNTIL 1984
Poverty measurement in Indonesia has a long history—in 1928 the predecessor of BPS published its irst study of household budgets in urban areas (CKS 1928). Middle-income groups were overrepresented in that study.3 Later studies, such as
the Investigation into Living Standards of Coolie Workers in Batavia, from 1937, and the so-called Coolie Budget Commission study of living standards of farmers
1. Other BPS documents that address poverty measurement in Indonesia include those of Ritonga and Avenzora (2002), BPS (2002, 2010), and Maksum (2004). However, these docu-ments lack important information and therefore do not help in obtaining a more thorough overview of poverty measurement in Indonesia.
2. Confusion still arises on occasion about the World Bank’s poverty igures ($1.00 or $1.25 per day [purchasing power parity]). While these igures make sense only in an interna -tional comparison, they are often inappropriately used in policy forums and the media by those interpreting them as national poverty rates and trends. See Sumner and Edward’s (2014) study, in this issue.
3. The survey was based on 348 households of public servants in urban areas. The method-ology required them to record expenditure over several weeks, which caused the sample to be biased to middle-income households able to read, write, and calculate.
Oficial Poverty Measurement in Indonesia since 1984: A Methodological Review 187
and plantation workers during 1939–40, broadened the scope of measurement of welfare of the population in Indonesia (Booth 1993).
After independence the irst unoficial poverty estimates appeared between 1975 and 1986. According to Booth (1993), the main approaches at that time were those of Sajogyo (1975; Sajogyo and Wiradi 1985), Esmara (1986), and the World Bank and its staff (1980; Chernichovsky and Meesok 1984).4 The ‘Sajogyo
approach’ classiied persons living in rural areas as very poor if their annual expen-ditures were below 240 kilograms of milled rice (in purchasing power) and poor if their annual expenditures were between 240 and 320 kilograms. The urban pov-erty line was derived by applying a 50% mark-up on the rural povpov-erty line. At that time, the World Bank published two very different approaches to measuring poverty: its report Employment and Income Distribution in Indonesia (1980) deined the poor as those with monthly expenditure below Rp 3,000 per capita,5 while
Chernichovsky and Meesok (1984) deined the poor as those in the bottom 40% of the per capita expenditure distribution.6
At the time, the most inluential proposal on how to measure poverty in Indo-nesia came from Esmara (1986). Using data from the 1970, 1976, 1978, and 1980 rounds of the National Socio-economic Survey (Susenas), the ‘Esmara approach’ formulated a basic-needs food and non-food package that could differ in urban and rural areas. According to Esmara, the underlying basket of food and non-food items should be re-evaluated in each new Susenas round, leading to a new under-lying basket or what Esmara called a ‘dynamic poverty line’.
OFFICIAL POVERTY MEASUREMENT
In 1984 BPS published its irst oficial poverty igures for Indonesia, in Jumlah dan persentase penduduk miskin di Indonesia 1976–1981 (The number and percentage of poor in Indonesia 1976–1981), using data from the 1976, 1978, 1980, and 1981 rounds of Susenas (BPS 1984). Since then, BPS has regularly updated its poverty igures and adjusted the way it calculates poverty. In this section, I describe how poverty measurement has evolved since 1984. I distinguish between the princi-pal data source underlying poverty measurement (Susenas) and more technical aspects, such as the composition of the food and non-food baskets and the treat-ment of food consumed outside of the home. Tables 1 and 2 depict the corre-sponding poverty estimates and poverty lines.
4. Recent instances of the BPS publication Analisis dan penghitungan tingkat kemiskinan (Analysis and calculation of the poverty rate) list further unoficial poverty lines and pov -erty estimates that emerged between 1975 and 1985.
5. A province-speciic rural and urban spatial price delator was applied to the consump
-tion aggregate whereby the reference category was Jakarta. Indonesia deines districts as
municipalities (kota) or predominantly rural areas (kabupaten). Each district can then be divided into urban precincts (kelurahan) and rural villages (desa). BPS’s deinition of rural and urban areas in its poverty measurement uses the desa and kelurahan classiications. 6. In addition, the World Bank (1990) draws on an internal analysis by V. V. Rao from 1983, in which poverty estimates are based on valuing the price of 16 kilograms of rice (step one), multiplying the obtained value by 1.25 to allow for other food expenditures (step two),
and then dividing this igure by the share of food expenditures in total expenditures of the
expenditure group whose total food expenditures were closest to those in step two. Rao’s estimates were calculated separately for each region (provinces and rural and urban areas).
TABLE 1 Oficial Poverty Statistics, 1976–2014
Poverty rate (%)
Number of poor individuals
(million)
Urban Rural Total Urban Rural Total Remarks
1976 38.8 40.4 40.1 10.0 44.2 54.2 1978 30.8 33.4 33.3 8.3 38.9 47.2 1980 29.0 28.4 28.6 9.5 32.8 42.3 1981 28.1 26.5 26.9 9.3 31.3 40.6 1984 23.1 21.2 21.6 9.3 25.7 35.0 1987 20.1 16.1 17.4 9.7 20.3 30.0 1990 16.8 14.3 15.1 9.4 17.8 27.2 1993 13.5 13.8 13.7 8.7 17.2 25.9
1996 9.7 12.3 11.3 7.2 15.3 22.5
1996 19.9 13.7 17.7 9.6 24.9 34.5 1998 method; SA
1996 19.8 13.4 17.5 9.4 24.6 34.0 1998 method; RA & statistical yearbooks
1998 21.9 25.7 24.2 17.6 31.9 49.5
1998 14.4 20.1 17.9 11.6 24.9 36.5 1996 method; SA
1999 19.4 26.0 23.4 15.6 32.3 48.0
1999 8.9 13.6 11.7 7.3 16.9 24.2 1996 method; SA 1999 15.1 20.2 18.2 12.4 25.1 37.5 Susenas ‘Mini’; SA
2000 14.6 22.4 19.1 12.3 26.4 38.7 * 2001 9.8 24.8 18.4 8.6 29.3 37.9 ** 2002 14.5 21.1 18.2 13.3 25.1 38.4 *** 2003 13.6 20.2 17.4 12.2 25.1 37.3 2004 12.1 20.1 16.7 11.4 24.8 36.1 2005 11.4 19.5 16.0 12.4 22.7 35.1 2006 13.5 21.8 17.8 14.5 24.8 39.3 2007 12.5 20.4 16.6 13.6 23.6 37.2 2008 11.4 18.6 15.2 12.6 22.0 34.5 2009 10.7 17.4 14.2 11.9 20.6 32.5 2010 9.9 16.6 13.3 11.1 19.9 31.0 2011M 9.2 15.7 12.5 11.1 19.0 30.0 2011S 9.1 15.6 12.4 11.0 18.9 29.9 2012M 8.8 15.1 12.0 10.6 18.5 29.1 2012S 8.6 14.7 11.7 10.5 18.1 28.6 2013M 8.4 14.3 11.4 10.3 17.7 28.1
2013M 8.4 14.3 11.4 10.4 17.8 28.2 BPS revisions in 2014, based on newly available population projections related to the Population Census 2010
2013S 8.5 14.4 11.5 10.6 17.9 28.6
2013S 8.6 14.4 11.5 10.7 17.9 28.6 BPS revisions in 2014, based on newly available population projections related to the Population Census 2010
2014M 8.3 14.2 11.3 10.5 17.8 28.3
Source: Author’s compilations based on data from various BPS publications.
Note: Shaded rows represent alternative scenarios or revisions. SA = Sutanto and Avenzora (1999). RA = Ritonga and Avenzora (2002). * Predicted values for Aceh Darussalam and Moluku. ** Predicted values for Aceh Darussalam. *** Predicted values for Aceh Darussalam, Moluku, Moluku Utara, and Papua. M March round. S September round.
TABLE 2 Oficial Urban and Rural Poverty Lines, 1976–2014
1976 3,901 15.9 4,522 2,685 6.1 2,849
1978 4,284 16.0 4,969 2,805 6.3 2,981
1980 5,881 16.2 6,831 4,179 6.5 4,449
1981 8,288 18.0 9,777 5,517 6.5 5,877
1984 11,527 19.1 13,731 7,239 7.0 7,746
1987 17,381 10,294
1990 17,520 15.1 20,614 12,617 5.1 13,295
1993 23,303 16.5 27,905 15,576 14.6 18,244
1996 29,681 22.4 38,246 23,197 15.4 27,413
1998 71,058 26.7 96,959 56,745 22.0 72,780
1999 70,959 23.2 92,409 59,822 19.5 74,272
1999 64,396 28.0 89,845 52,319 24.6 69,420
2000 70,364 23.2 91,632 59,316 19.5 73,648
2001 76,798 23.2 100,011 64,740 19.5 80,382
2002 93,351 28.5 130,499 73,030 24.3 96,512
2003 138,803 105,888
2004 143,455 108,725
2005 103,992 31.0 150,799 84,014 28.4 117,259
2006 126,163 27.6 174,290 102,907 21.2 130,584
2007 132,258 29.6 187,942 116,265 20.8 146,837
2008 143,897 29.8 204,896 127,207 21.4 161,831
2009 155,909 29.8 222,123 139,331 22.5 179,834
2010 163,077 30.0 232,989 148,939 22.6 192,354
2011M 177,342 29.9 253,016 165,211 22.6 213,395
2011S 184,919 29.9 263,594 172,723 22.6 223,181
2012M 187,194 30.0 267,408 177,521 22.6 229,226
2012S 194,207 30.0 277,382 185,967 22.7 240,441
2013M 202,137 30.1 289,041 196,215 22.5 253,273
2013S 215,750 30.1 308,826 213,250 22.7 275,779
2014M 223,091 30.0 318,514 221,379 22.6 286,097
Source: Author’s compilations based on data from various BPS publications.
Note: Shaded row represents Susenas ‘Mini’. Poverty lines are in current rupiah per capita. Reported poverty lines for 1976–87 were used to derive oficial poverty estimates. Later poverty estimates are based on rural or urban provincial poverty lines, which are not reported in this article. Non-food share = non-food poverty line divided by the total poverty line. M March round. S September round. The value of the food poverty line for 1987 was tabulated in BPS (1992). Unfortunately, this document could not be located by BPS. For 2003 and 2004 the values of the food and non-food poverty line were not available from BPS.
190 Jan Priebe
Susenas: An Overview
All oficial poverty estimates in Indonesia have used data from Susenas. The fre-quency, timing, and questionnaire design of the survey itself has changed much since its irst round, in 1963.7 Susenas consists of a core survey and a number of
modules; the core is administered in each Susenas round and to every selected household. In contrast, the module questions change from round to round and in some Susenas rounds are administered to only a subsample of households. Before 1992 the core comprised only ive questions (four demographic and one educa-tional). Since 1992 BPS has used a completely revised core questionnaire that, among other information, captures consumption expenditure information in each Susenas round.8 Yet not every Susenas module includes questions on
consump-tion expenditure, so despite the availability of annual Susenas data since 1992 BPS has not been able to publish poverty igures for every round of the survey.9
To measure poverty, BPS constructs a rupiah-valued welfare aggregate—largely by summing the rupiah values of several expenditure items and categories—and then benchmarks it against the relevant poverty line. To obtain consumption (or consumption-related) expenditure for each item and category in the aggregate, BPS uses a recall period in which the incurred expenditures relect as closely as possible the actual consumption in a suitable reference period. BPS also uses esti-mated consumption expenditures for certain items (such as rental payments for households that receive free housing or live in their own property) in its aggre-gate. Furthermore, in the ‘own produced food’ category, BPS captures actual consumption and evaluates it at local prices, to obtain a rupiah value that enters the aggregate. However, only the module section of Susenas captures actual con-sumption in the ‘own produced food’ category; the core section asks households for a direct rupiah estimate of the value of ‘own produced food’ consumption
7. The selection of households to be interviewed for Susenas is based on a stratiied sam
-pling procedure. Consequently, BPS provides individual and household weights with the
Susenas dataset that allow BPS and researchers to derive representative welfare statistics. It is not yet well understood to what degree BPS is able to avoid the undercounting of the very poor and the very rich during the data collection process as well as in its construction of individual and household weights. See the World Bank (2007) study for a more detailed discussion on this issue.
8. BPS irst included questions on consumption expenditures in the Susenas core in 1992,
and these questions now appear in every Susenas round. Since 1993 BPS has greatly in-creased the number of households it samples for each annual Susenas round, from about 65,000 in 1992 to 202,000 in 1993. Since 1993 BPS has therefore been able to calculate annual
district-level welfare statistics. However, only since 2002 has BPS published oficial district poverty igures. Moreover, while all selected households are asked to answer the core sec -tion, only about 25% of households had to answer the module section during 1993–2010. Since 2011 all selected households have been asked to answer both the core questions and the module questions. During 1993–2014, the consumption expenditure module was in-cluded in the Susenas rounds of 1993, 1996, 1998, 1999, 2002, 2005, 2008, 2011, 2012, 2013, and 2014. Although not all Susenas modules contain data on consumption expenditure, in this article the term ‘module’ will refer to the consumption expenditure module.
9. Susenas collects income data too, but these are not used by BPS for poverty measure-ment. Please see Leigh and Van der Eng’s (2010) and Nugraha and Lewis’s (2013) studies on welfare (inequality) measurement using income data from Susenas.
Oficial Poverty Measurement in Indonesia since 1984: A Methodological Review 191
(without recording actual consumption). For simplicity, and in line with the related literature, in this article the term ‘consumption expenditure’ refers to the BPS consumption aggregate for welfare (poverty) analysis.
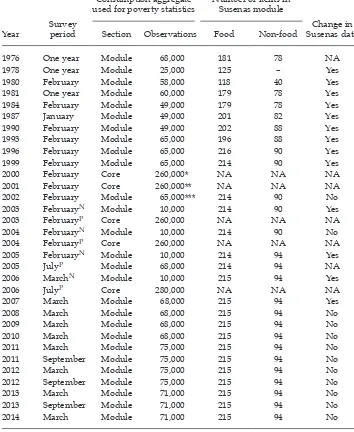
Table 3 shows the collection period for those Susenas rounds used to derive oficial poverty estimates. From 1976 to 1981 the structure of Susenas changed substantially. Some of the earlier Susenas rounds and related expenditure ques-tions were based on data collection throughout the year, and sometimes data were collected using diaries rather than recall methods (BPS 1993; Surbakti 1995; World Bank 2007). Between 1981 and 2002 BPS collected an expenditure module every three years,10 while from 2002 it included a consumption module at least once a
year. For many years Susenas has been conducted at least twice a year. Between 1984 and 2010 the irst Susenas round of the year (February from 1984 to 2005, and March from 2006 to 2010) has provided the data for that year’s oficial national and provincial poverty igures; since 2011 BPS has provided two annual poverty estimates (in March and September).
In 2002 BPS also changed its sampling procedure: before 2002 each Susenas round was based on a new sample of households; since 2002 the February or March round has contained a certain number of panel households (about 10,000) that are interviewed in at least two consecutive February or March rounds.11
Consumption Aggregate, Item Coverage, and Recall Periods
The consumption expenditure information that BPS uses for measuring poverty in Indonesia comes from the Susenas modules. During 1976–96 BPS modiied the module questionnaire quite frequently, with questionnaires often differing greatly from round to round. In general, as shown in table 3, the number of food and non-food items covered in the questionnaire has increased since 1976. Since 1996 the design of the module questionnaire has been relatively consistent, col-lecting information on about 215 food and 90 non-food items.
Given the rise in living standards over time in Indonesia, expenditures on non-food items play a much more important role than they did in the 1970s. BPS is therefore now better able to capture these expenditures, having increased the number of questions relating to the non-food section of the consumption aggre-gate. However, the main non-food categories (housing, goods and services, edu-cation, health, clothing, durable goods, taxes and insurances, and holidays and festivities) have remained unchanged. Other important expenditure categories are described below.12
1. Rental payments and utilities: At least since the 1976 Susenas BPS has collected information on rental payments, including estimates based on self-assessments by households that do not pay rent (such as those that own a house or receive free lodging) on what the rent would be if they were tenants. Since its
10. The years of the 1997–98 Asian inancial crisis are exceptions. BPS conducted addi -tional Susenas consumption surveys, Susenas ‘Mini’, in December 1998 and August 1999,
to monitor the effects of the crisis. However, only the December 1998 igure from these two surveys entered oficial poverty estimates.
11. The selection of new panel households occurs only once the panel is completed: up to
the end of 2010, this was three years; from 2011, ive years.
12. Sutanto and Avenzora (1999) provide more details on these expenditure categories.
TABLE 3 Susenas Overview, 1976–2014
1976 One year Module 68,000 181 78 NA
1978 One year Module 25,000 125 – Yes
1980 February Module 58,000 118 40 Yes
1981 One year Module 60,000 179 78 Yes
1984 February Module 49,000 179 78 Yes
1987 January Module 49,000 201 82 Yes
1990 February Module 49,000 202 88 Yes
1993 February Module 65,000 196 88 Yes
1996 February Module 65,000 216 90 Yes
1999 February Module 65,000 214 90 Yes
2000 February Core 260,000* NA NA NA
2001 February Core 260,000** NA NA NA
2002 February Module 65,000*** 214 90 No
2003 FebruaryN Module 10,000 214 90 Yes
2003 FebruaryP Core 260,000 NA NA NA
2004 FebruaryN Module 10,000 214 90 No
2004 FebruaryP Core 260,000 NA NA NA
2005 FebruaryN Module 10,000 214 94 Yes
2005 JulyP Module 68,000 214 94 NA
2006 MarchN Module 10,000 215 94 Yes
2006 JulyP Core 280,000 NA NA NA
2007 March Module 68,000 215 94 Yes
2008 March Module 68,000 215 94 No
2009 March Module 68,000 215 94 No
2010 March Module 68,000 215 94 No
2011 March Module 75,000 215 94 No
2011 September Module 75,000 215 94 No
2012 March Module 75,000 215 94 No
2012 September Module 75,000 215 94 No
2013 March Module 71,000 215 94 No
2013 September Module 71,000 215 94 No
2014 March Module 71,000 215 94 No
Source: Author’s compilations based on data from various BPS publications and National Socio-economic Survey (Susenas) questionnaires.
Note: NA = not applicable. * Aceh Darussalam and Moluku not sampled. ** Aceh Darussalam not sam-pled. *** Aceh Darussalam, Moluku, Moluku Utara, and Papua not samsam-pled. N sections and rounds that were used to estimate national poverty estimates. P sections and rounds used to derive provincial poverty estimates. Sample sizes for 1976 to 1981 are estimated based on Surbakti (1995). In the years where provinces were not covered in Susenas, BPS predicted poverty rates or numbers for these areas in order to enter the national estimates. The Susenas-type 1998 survey contained 10,000 households, as did the Susenas ‘Mini’ survey in August 1999. In 1978, expenditures on non-food items, except for tuition fees, were not collected. Since 2002, Susenas (in its February or March rounds) has contained about 10,000 panel households and the panel cohort is replaced every three years. To what extent (non-random) attrition of panel households affects poverty measurement remains to be studied.
Oficial Poverty Measurement in Indonesia since 1984: A Methodological Review 193
1976–81 poverty estimates, BPS has taken both actual rent and self-assessed rent into account. Yet it is unclear whether BPS and researchers can rely on the quality of these self-assessed values. In rural areas, for example, many people own their house and may have little idea of its rental value. As discussed in more detail by Hentschel and Lanjouw (1996, 2000), who use data on Ecuador, rural households tend to underestimate the rental value. For this reason, some national statistics agencies prefer to use hedonic regressions to impute housing prices rather than rely on self-assessed household estimates. BPS, however, uses such estimates and does not apply imputation techniques to the data. Another tricky component of the consumption aggregate is the use of public utilities, such as electricity and water supply. To accurately measure welfare levels, all services consumed by households—including those obtained for free, such as drinking water, washing water from a well or a river, or illegal electricity connections—should be priced in the consumption aggregate so as to allow BPS to compare the derived beneits for those households that pay for these services and those that do not. Since its irst report, in 1984, BPS has not implemented any imputations to free services.
2. Transfer payments: A long-standing debate about transfer payments (such as remittances) exists in the literature on poverty measurement. The inclusion of transfer payments in the consumption aggregate would lead to double-counting if the transfer appeared in the expenditure data of both the sending household (under gifts and remittances) and the receiving household (under food and non-food items). Owing to the risk of double-counting and the complexity of inancial and family arrangements for transfer payments, most central statistics agencies omit this category when calculating the poverty consumption aggregate and the non-food basic-needs basket. Susenas collects information on transfer payments, but BPS has decided not to use this expenditure category in calculating poverty rates.13
3. Recall periods: During 1976–2014, Susenas used a consistent recall period of one week for all food items (total household expenditure in the last week). Likewise, BPS used one standard for all non-food items. During 1976–81, Suse-nas recorded a household’s item-speciic non-food expenditures by using a recall period of three months (total household expenditures in the last three months). Since 1984, Susenas has used two recall periods for all non-food items (total household expenditures over [a] the last 12 months and [b] the last month). To derive its non-food consumption aggregate for measuring poverty, BPS relies on the monthly average of the 12-month recall period.
Technical Review
Despite several changes since 1984 in the way that BPS derives its oficial pov-erty igures, certain elements have remained constant. First, the welfare measure underlying the oficial poverty statistics is still consumption expenditures per capita, which is derived by dividing total household expenditures by the number of household members. Second, the poverty rate itself is still deined as the share of the overall population with per capita expenditure levels below the derived poverty line(s).14 Third, oficial poverty lines have always consisted of a food
13. Nyberg (1976) and Van der Walle (1988) give good overviews of the composition of the welfare consumption aggregate derived from earlier Susenas rounds.
14. The poverty lines are absolute not relative.
194 Jan Priebe
and a non-food component. The food component is adjusted to relect an intake of 2,100 kilocalories per capita per day,15 whereby the calorie prices in order to
derive a rupiah value of the food poverty line have always been derived from the reference population (who live just above the poverty line). Fourth, BPS still uses an item-speciic (or share-speciic) non-food basket to derive the non-food component of poverty lines.
The 1984 BPS Poverty Report
The 1984 BPS report provided poverty estimates for Indonesia from 1976 to 1981. BPS obtained food poverty lines for these series by applying the food energy intake method (Ravallion 1998, 2008).16 It converted all food expenditures into
kilocalories, which it then used to determine the average kilocalorie price. It multiplied the price in the reference group by 2,100 to obtain the rupiah value of the food poverty line.17 To determine the non-food poverty line, BPS applied
a pre-speciied basket of non-food items priced using implicit Susenas prices.18
It derived the non-food basket itself—and, implicitly, the non-food share of the overall poverty line—by using what it refers to as ‘expert judgement’ and not data from Susenas or from other BPS sources (Sutanto and Avenzora 1999). The food poverty line and the valuation of the non-food basket led, then, to the overall poverty line.19
In this approach, BPS calculated poverty lines separately for urban and rural areas, using different underlying calorie prices and different non-food baskets. Consequently, it derived national poverty rates by applying the rural (urban)
15. The 2,100-kilocalorie norm stems from the national food and nutrition workshop (Widyakarya nasional pangan dan gizi) in Bogor in 1978 (LIPI 1978). BPS has not changed its
caloriic base of poverty measurement since its 1984 report. Likewise, despite internal dis -cussions on the introduction of adult equivalence scales into poverty measurement—see the BPS publications Analisis dan penghitungan tingkat kemiskinan (Analysis and calcula-tion of the poverty rate) from 2005 and Penyempurnaan metode pengukuran kemiskinan rumah tangga di Indonesia (Reinement of the method of measuring household poverty in Indone -sia) from 2010—BPS has kept its per capita approach. BPS does not use any sort of protein anchor in measuring poverty.
16. Since 1984 BPS has called its method of measuring poverty a ‘basic-needs approach’ (pendekatan kebutuhan dasar). Yet only since 1993 has it measured poverty in a way that is in line with the usage of this term in the literature (Ravallion 1998, 2008).
17. In order to convert the recorded food expenditure information into calories, BPS relies on nutrition composition tables published and regularly updated by Direktorat Bina Gizi (the Directorate of Nutrition) in the Ministry of Health (previously Depkes). These tables
were irst published in 1964, with revisions in 1990, 1995, 2001, 2005, and 2009. Although
BPS relies on these tables, it does not document which poverty estimates are based on which table.
18. Most developing countries began to determine the non-food poverty line by specifying
a detailed, item-speciic food basket without determining an explicit non-food basket. In
contrast, Indonesia began the opposite way, specifying a detailed non-food basket while letting the food poverty line be determined by the average calorie price of the reference population.
19. As documented by Sutanto and Avenzora (1999), only in 1993 did BPS start to calculate
its poverty igures by considering the entire per capita consumption distribution. Before
1993, BPS interpolated aggregated consumption statistics to estimate how many individu-als were poor.
Oficial Poverty Measurement in Indonesia since 1984: A Methodological Review 195
national poverty lines to all rural (urban) areas and by calculating the share of the overall population that fell below the poverty lines.20 For its 1984 poverty
esti-mate (BPS 1987), BPS adopted the same approach as for its 1976–81 series.
1987
For its 1987 estimates, BPS largely kept its 1984 method, though it adjusted the way it calculated how calories consumed outside of the home (eating out) enter the value of the food poverty line. Early in 1982 and 1985, BPS conducted small-scale expenditure surveys designed to capture how much food and how many calories the reference population typically consumed outside of the home. From the 1982 survey data, BPS calculated that about 10% of calories per capita were derived from eating out. It revised these igures to 8% in urban areas and 7% in rural areas, based on the 1985 survey. The food poverty lines during 1976–84 take the 10% value into account, whereas the 1987 and 1990 values are based on the new 1985 values (BPS 1984, 1987, 1992).21
1990
For its 1990 poverty estimates, BPS introduced the irst major change to the approach it took in 1984. It derived rural and urban provincial poverty lines and used them to calculate province-speciic and national (rural, urban, and overall) poverty rates, whereby the prices of the food (average calorie price of the refer-ence population) and food (prices per food commodity item in the non-food basket) poverty lines were allowed to differ in rural and urban areas as well as across provinces. Yet the sample-size limitations of the 1990 Susenas round prevented BPS from deriving province-speciic rural and urban poverty lines for more than 18 of 27 provinces, while it derived only one common rural and one common urban poverty line for the remaining 9 provinces (Sutanto and Avenzora 1999).22 While BPS has continued to publish (rural, urban, and overall) national
poverty lines, these lines have not entered any BPS poverty calculations since 1990 and are therefore largely illustrative.
20. BPS publishes an overall national poverty line for illustrative purposes—it has never
been used to derive poverty igures in Indonesia. During 1976–87, only the rural and urban
poverty lines (at the national level) entered poverty calculations (Sutanto and Avenzora
1999). The deinition of rural and urban areas in Indonesia is updated approximately every 10 years, after each population census; McCulloch, Weisbrod, and Timmer (2007) show that such revisions in certain areas can have signiicant effects on Indonesia’s poverty proile.
In 2014 BPS recalculated its 2013 poverty estimates using newly available population
pro-jections calculated using the Population Census 2010. According to BPS the switch to the updated population numbers leads to only minor changes in the poverty igures (table 1).
21. The food poverty lines from 1976 until 1990 are based on the food energy intake method. These lines are derived by multiplying an average kilocalorie price by 2,100. As explained in more detail by Sutanto and Avenzora (1999), BPS applied several intermediary steps before this average calorie price was obtained. One of these intermediary steps involved the adjustment of the entire expenditure per capita distribution using the correction factors for calories consumed outside of the home.
22. The nine remaining provinces were Bengkulu, Central Kalimantan, Central Sulawesi,
East Kalimantan, East Timor (now the nation of East Timor), Irian Jaya (now Papua and West Papua), Jambi, Maluku, and Southeast Sulawesi. Only since 1993 has BPS derived rural and urban poverty lines for each province.
196 Jan Priebe
1993
In 1993 BPS made several important changes to the way it calculated oficial pov-erty igures. It abandoned the food energy intake method and introduced explicit food baskets whose compositions could differ in rural and urban areas and across provinces (as could item-speciic prices). In order to derive these baskets, BPS looked at the expenditure patterns of the reference population.23 It also stopped
taking food eaten out into account when deriving the food poverty lines (Sutanto and Avenzora 1999) and revised the way it derived the non-food poverty line. Up to this point, BPS had obtained its non-food poverty line by specifying a non-food basket that included 14 items in urban areas and 12 items in rural areas, deter-mined by expert judgment and not survey data (at least not explicitly). In 1993 BPS changed this practice, conducting for the irst time its Survey on the Basic-Needs Commodity Basket (Survei Paket Komoditi Kebutuhan Dasar [SPKKD]), on which it based its non-food basket from 1993 onwards. The 1993 SPKKD inter-viewed 800 households in 10 provinces (8 outside of Java), whereby the sample underlying the SPKKD was exclusively the reference population. Compared with Susenas, the SPKKD includes more detailed questions on non-food consumption; BPS stresses that the SPKKD questionnaire tries especially to capture items con-sumed by the poor and the near-poor (Sutanto and Avenzora 1999).
In the 1993 SPKKD, BPS increased the number of items in its non-food basket to 25 in urban areas and 24 in rural areas. To derive the rupiah value of the non-food poverty line, BPS used the SPKKD to calculate the subgroup expenditure share of the respective items. It then multiplied all of the obtained subgroup expendi-ture share values from the SPKKD with the corresponding subgroup expendiexpendi-ture amount in rupiah, as recorded in Susenas. The inal non-food poverty line, then, was the sum of all 25 (24) obtained rupiah values.24 Given that the 1993 SPKKD
23. In its 1976–1990 estimates, BPS used the reference population only to ind the average
calorie price (food poverty line). Since 1993 it has used the reference population to de-termine the prices for the food poverty line, derive the non-food poverty line, and create sampling frames for the SPKKD. Some circularity is involved in selecting the reference population: the rupiah value of the poverty line depends on a reference group whose being
deined as such depends on the rupiah value of the poverty line. Pradhan et al. (2000, 2001)
discuss iterative methods of addressing this problem. BPS has taken a very practical
ap-proach by simply inlating by the consumer price index the poverty lines of the preceding round. It then uses this inlation-adjusted poverty lines to select the reference population.
Since its 1984 poverty report, BPS has always selected a reference population with wealth levels above the poverty line, which differs from the recommendations of many academ-ics—such as Ravallion (1998)—who propose selecting a group of households whose wealth levels are around or just below the poverty line.
24. To better understand how BPS handles the SPKKD in combination with Susenas, let us assume that BPS has decided (based on SPKKD data) that three pieces of soap should be included in the non-food basket, and that soap belongs to the toiletries subgroup. Let us also assume that the expenditure on three pieces of soap constitutes 20% of all toiletries expenditures of the reference group, as recorded in the SPKKD. In the next step, BPS multiplies this 20% value by the recorded expenditure amount in rupiah of the toiletries subgroup, as recorded in Susenas. Let us then assume that data from Susenas showed that the reference population spends about Rp 100,000 on toiletries each month. Accordingly, 0.2 × Rp 100,000 = Rp 20,000 is the amount that enters the non-food poverty line. BPS ap-plies this method to all selected non-food items.
Oficial Poverty Measurement in Indonesia since 1984: A Methodological Review 197
contained only a relatively small sample, it distinguished between rural and urban areas but did not calculate province-speciic expenditure shares.
1996
For its 1996 poverty estimates, BPS relied largely on its 1993 approach. It made two important adjustments, however. It again revised its selection of items and quantities in the food basket underlying the food poverty line, although it left the number of chosen items unchanged at 52. It also extensively revised its method of calculating the non-food poverty line. Where its 1993 estimates were based on the 1993 SPKKD, its 1996 estimates were based on the 1995 SPKKD, which resulted in new and very different (sub)group expenditure shares. The 1995 SPKKD included interviews with 5,000 households and covered all provinces, which allowed BPS to change its 1993 approach and to calculate province-speciic subgroup expendi-ture share values for urban and rural areas (Sutanto and Avenzora 1999).
1998–99
In 1999 BPS announced that it was changing the way it calculates poverty and that its new approach would lead to higher reported poverty rates than previously. To demonstrate, it published two estimates for 1999—one based on the old method and one on the new method. It also corrected its 1996 estimate (based on the 1999 method), which became the oficial 1996 estimate in Statistik Indonesia: Statistical Yearbook of Indonesia from 1999 onwards.
In terms of methodological changes in its 1998–99 poverty estimates, BPS changed the composition of its food basket and, as stated in Sutanto and Avenzora (1999), switched to more expensive food items (the number of items remained unaltered at 52). BPS chose a similar approach for its non-food poverty line, decid-ing to reanalyse the 1995 SPKKD and selectdecid-ing more expensive non-food items. It also increased the number of non-food items in the non-food basket, from 25 in urban areas and 24 in rural areas to 27 in urban areas and 26 in rural areas. These compositional changes saw the overall poverty line(s) rise, on the back of a large increase in the non-food poverty line.
2000
In 2000 BPS adopted two major changes. First, it changed its deinition of the reference population that it used to determine the food basket (items, quanti-ties, prices) and the non-food basket (prices, sampling for the SPKKD). During 1976–99 BPS divided the reference population into per capita expenditure brack-ets in rupiah values, whereas from 2000 onwards it deined the reference popu-lation as the 20% who live above the poverty line.25 Second, BPS decided to use
the Susenas core for the irst time, in order to be able to publish oficial poverty estimates each year. Given that the 2000 Susenas did not include a consumption expenditure module, BPS’s decision involved making important adjustments to
25. It is reasonable to assume that the determination of the upper limit(s) of the rupiah value that determines the reference population (the lower value is given by the poverty line[s] for the 1976–99 estimates) was based on BPS having a certain share or number of
the population in mind. Therefore, the change in the deinition of the reference population
might have had only limited consequences in practice.
198 Jan Priebe
its 1998–99 methodology. BPS derived its 2000 poverty lines by updating the 1999 rural and urban provincial poverty lines using the consumer price index (CPI); a practice that BPS continued in 200126. Since the 2000 and 2001 estimates rely
on the Susenas core (which BPS assumed to under-report consumption expendi-tures), BPS reduced the value of the poverty lines by 10% to account for the lower consumption igures (Ritonga and Avenzora 2002).27
2002
In 2002, in line with BPS’s thematic three-year cycle, a Susenas module collected consumption expenditure information. BPS used the data to calculate item-speciic prices, to revalue the food and non-food baskets, and to derive the con-sumption aggregate that is used in its poverty measurement. The 2002 poverty estimate therefore largely follows the 1998–99 approach.28
2003
According to BPS’s thematic three-year cycle, the 2003 Susenas would not collect consumption expenditure information. Yet BPS deviated from this practice by dis-tributing a ‘Consumption expenditure module’ questionnaire to a small sample of 10,000 households (out of 260,000 households in the February 2003 round). BPS used the ensuing price data (module) to derive a irst set of rural and urban prov-ince-speciic poverty lines (step one). It then used these poverty lines to derive national (rural, urban, and overall) poverty estimates (step two). However, BPS considered the sample size of 10,000 households to be too small on which to base its provincial poverty rates. In a third step BPS used data from the Susenas core to derive poverty rates (rural, urban, and overall) by province whereby it adjusted its initial province-speciic poverty lines obtained under step one by the same scaling factor, so that summing the number of poor people by province would produce the same national poverty igures as those obtained under step two. Thus, for 2003 BPS implemented a top-down approach, whereby the provincial poverty igures were determined partly by the national poverty estimates.
26. Since Indonesia’s CPI is based on urban areas only, BPS had to assume that prices between rural and urban areas increased by the same amount. Likewise, since the CPI cap -tures price developments that do not necessarily represent the consumption basket of the reference population, BPS had to assume that these differences were negligible.
27. As shown by Pradhan (2009), the under-reporting of consumption in the Susenas core section compared with that in the modules is more prevalent among the poor than the non-poor. It is therefore questionable whether poverty estimates based on the modules are comparable with those based on the core.
28. In this article, all information on changes during 2002–13 is based on various BPS sources, including the annual rounds of Statistik Indonesia: Statistical Yearbook of Indonesia
and Data dan informasi kemiskinan (Poverty information and data); Analisis dan penghitungan tingkat kemiskinan (Analysis and calculation of the poverty rate) for 2005, 2008, 2009, 2010, and 2011; the (bi-)annual rounds of Tingkat kemiskinan di Indonesia (The level of poverty
in Indonesia) since 2006; and BPS’s (2010) report. Certain information described in this
article is not tabulated in these publications but draws on discussions with BPS representa-tives.
Oficial Poverty Measurement in Indonesia since 1984: A Methodological Review 199
2004
In 2004 BPS continued its 2003 approach by administering the ‘Consumption expenditure module’ questionnaire to 10,000 households (out of 260,000 house-holds in the February 2004 round). Similar to 2003, BPS used a top-down approach to calibrate its provincial poverty igures to match the national poverty igures. In addition, BPS adjusted the food basket that determined the food poverty line. While the overall number of selected food items remained at 52, BPS adjusted the type and relative weight of some of the selected items.
2005
For the February 2005 round of the Susenas BPS decided to survey only 10,000 households, all of which were asked to complete the consumption expenditure module. As in 2003 and 2004, BPS determined the national (rural, urban, and overall) poverty rates based on the February round. For its provincial poverty estimates in 2005, BPS relied on the July round of Susenas, which in its module collected consumption information on about 68,000 households (out of 256,000 households). BPS again used a top-down approach, though in 2005 it calibrated the provincial poverty igures from July to match the national estimates from February. Furthermore, in 2005 BPS substantially altered the composition of the non-food basket. In 2004 BPS had conducted a new round of the SPKKD, which covered 1,050 households across all provinces. In 2005 these estimates entered BPS’s poverty calculations for the irst time.
2006
In 2006 BPS followed its approach of 2005 by conducting only a small Susenas round in the irst quarter of the year (March 2006). This round, as in 2005, led to the national (rural, urban, and overall) poverty estimates. For its provincial poverty estimates, BPS relies on the core of the July 2006 Susenas round (280,000 households)—no consumption data was collected in the module in 2006, in line with BPS’s three-year thematic cycle. As in 2003, 2004, and 2005 BPS applied a top-down approach, so that adding up the provincial poverty igures using the core data from the July round would yield the same national (rural, urban, and overall) poverty estimates as those obtained from the module data of the March round.
2007
In 2007 BPS implemented the last of its technical changes to date: it increased the sample size for the March round to 68,000 households, all of which were asked to complete the ‘Consumption expenditure module’ questionnaire. This allowed BPS to determine national and provincial poverty rates from the same survey and the same questionnaire section. Since 2007 BPS has kept consistency in its national and provincial poverty estimates by abstaining from any major revisions in the way it calculates poverty.
CONSISTENCY OF POVERTY ESTIMATES OVER TIME
Since its irst poverty report, in 1984, BPS has made many changes to the way it measures poverty. To assess the impact of these changes on the comparability and consistency of poverty estimates over time, detailed empirical analyses are
TABLE 4 Oficial Approaches to Deriving Poverty Lines for National and Provincial Poverty Estimates, 1976–2014
1976 1978 1980 1981 1984 1987 1990 1993 1996 1998 1999 2000 2001 2002 2003 2004 2005 2006 2007–14*
General features
Base of national
poverty estimate Rural & urban poverty lines (national) Rural & urban poverty lines (provincial)
Reference population The population above the poverty line (by expenditure brackets) The 20% of the population above the poverty line
Consumption data M C M Both M Both M
Updating calorie/item prices Susenas CPI Susenas
Food poverty line
Method Food energy intake Cost of basic needs, with clearly deined food basket
No. of food items NA 52
Change in food items NA Yes Yes No Yes No
Mark-up for food eaten out 10% 8% (urban)
7% (rural) No mark-up
Non-food poverty line
Year of SPKKD used as
base for non-food items NA (expert judgement used) 1993 1995 1995 (reanalysis) 2004
No. of non-food items 14 (urban); 12 (rural) 25 (urban);
24 (rural) 27 (urban); 26 (rural)
Change in non-food items NA No Yes Yes Yes No Yes No
Technical change NA No Yes Yes Yes Yes Yes No Yes No Yes Yes Yes Yes Yes No
Source: Author’s compilations based on data from various BPS publications.
Note: M = Susenas modules; C = Susenas core. CPI = consumer price index. NA = not applicable. SPKKD = Survei Paket Komoditi Kebutuhan Dasar (Survey on the Basic-Needs Commodity Basket). The 1993 SPKKD allowed subgroup expenditure shares to vary between rural and urban areas but not between provinces. Poverty estimates before 1993 were
based on interpolation techniques, while estimates since 1993 are calculated directly from the entire consumption expenditure per capita distribution. In 1999 the selection criteria of items for the food basket changed. In 1993 and 1996 the selected items must have been consumed by at least 30% of the population while from 1999 onwards by at least 20% of the population.
* To March 2014.
Oficial Poverty Measurement in Indonesia since 1984: A Methodological Review 201
needed that show how poverty levels and the poverty proile (such as poverty by location, demographic composition, and education levels) would have developed in the absence of these changes. The relevant academic literature (Howes and Lan-jouw 1997; LanLan-jouw and LanLan-jouw 1997; Ravallion 1998; Deaton and Zaidy 2002; Lanjouw 2005; Beegle et al. 2012; De Weerdt et al. 2014) and the international best-practice literature on poverty measurement (Kakwani 2003; UN 2005; World Bank 2006; Haughton and Khandker 2009) are full of examples in which small changes in the data source (such as item coverage, questionnaire design, sampling, timing of the survey, and recall methods) or the procedure can lead to large changes in poverty estimates and reclassify who is poor. Yet only for the changes associated with the 1997–98 Asian inancial crisis exist different sets of BPS estimates (1996 and 1999) of how poverty levels would have developed otherwise.
While an empirical analysis of these changes is beyond the scope of this arti-cle, only since 2007 has BPS’s poverty measurement been relatively consistent and comparable over time. The 1976–84 estimates are all based roughly on the same technical approach, yet changes in sampling size, survey period, collection method (diary versus recall), and questionnaire design in these Susenas rounds cast some doubts on the comparability of the estimates. For its 1987 estimates, BPS modiied its technical approach and changed the Susenas questionnaire—particu-larly for the food section—while its 1990 estimates saw the switch to rural and urban provincial poverty lines.
In 1993 BPS implemented the most extensive revision in the way it estimated poverty. The published BPS data make it apparent that the 1993 estimates and those that followed do not compare very well with the 1976–90 estimates. Since the beginning of its 1984 report, BPS had faced severe scrutiny for its poverty estimates. More speciically, BPS’s poverty igures had shown that poverty rates, except in the 1970s, were higher in urban than in rural areas. These results have been attributed to BPS’s inappropriately costly non-food baskets in urban areas (compared with in rural areas), which, as a consequence, created excessively high poverty lines and poverty rates in urban areas (Ravallion and Huppi 1991; Booth 1993). Since 1993, poverty estimates have always been higher in rural areas than in urban areas. Given BPS’s extensive technical innovations in 1993, relected partly by the large increase in the non-food share of the rural poverty lines alongside a decrease in the non-food share in the urban poverty lines (table 2 and table 4)—it can be suspected that these revisions changed the spatial poverty pattern in 1993.29
The 1996 and 1999 poverty estimates again saw a number of technical revisions, and the 1997–98 crisis did not help to make poverty estimates more comparable over time. After 1999, BPS experimented for a few years with using the core sec-tion of Susenas for poverty measurement, for which, as shown in Pradhan (2009), it is not obvious how BPS could have achieved consistent estimates. In 2005 BPS made its most recent major technical revision by introducing the 2004 SPKKD results in its method, while in 2007 it abandoned its practice of using different Susenas rounds to determine its national and provincial poverty estimates. Only since 2007 can we assume that BPS’s poverty estimates are relatively comparable,
29. Although not directly comparable with the BPS approach, Ravallion and Bidani’s (1994) study investigates whether food energy intake and the cost of basic needs would produce
similar spatial distributions of poverty in Indonesia. The authors ind that both measures produce very different indings in classifying who is poor in Indonesia.
202 Jan Priebe
given that no major technical changes or relevant revisions of Susenas have been reported.
The above analysis has deined consistency in terms of BPS applying the same method and dataset structure to measure poverty over time. In this sense, BPS estimates since 2007 are comparable and consistent, while those of previous years have yet to undergo relevant (public) empirical analysis. To what extent BPS’s poverty measurement follows international best practice is a different kind of question and is beyond the scope of this article.30
CONCLUSIONS
In 1984 BPS published Indonesia’s irst oficial poverty igures, covering 1976 to 1981. Several aspects of BPS’s 1984 method have survived. BPS still relies on Susenas as the underlying data source and consumption expenditures per cap-ita as the welfare measure. Likewise, the derived consumption aggregate itself has remained stable in certain ways. For instance, BPS has not changed the large expenditure categories in the consumption aggregate, and it has maintained its approach to rental, water, and electricity payments. The poverty lines still com-prise food and a non-food components, with the food component still relecting an intake of 2,100 kilocalories per person per day. Moreover, since its 1984 report BPS has used a reference population with per capita expenditure levels just above the poverty line.
In many ways, however, BPS calculates poverty much differently from how it did in 1984. Susenas’s coverage, timing, questionnaire design, and sample com-position have changed many times, as has the technical procedure for deriving national and provincial poverty igures. While the methodological changes in poverty measurement were manifold only for the 1996, 1998, and 1999 estimates, certain robustness checks exist. Since this article’s objective is to document and describe how BPS’s poverty measurement has evolved over time, it remains to be seen in detailed empirical studies how each of the changes implemented by BPS affected the comparability of poverty levels and poverty proiles.
Since 2007 BPS has largely applied the same approach to measuring poverty. Neither Susenas nor the technical procedure has changed in any great way, at least not for poverty measurement at the national and provincial levels. Hence, as long as no further robustness analyses on poverty levels and poverty proiles are published, only the time series since 2007 can be safely assumed to be com-parable. Despite these recent achievements, it is likely that BPS will soon need to implement technical changes again. The non-food component of the poverty lines
30. Even BPS’s poverty estimates since 2007 lack comparability and consistency if we
de-ine consistency as applying the same welfare standard over time. BPS still applies the
subgroup expenditure share values from the 2004 SPKKD. Although these shares remain constant, it does not mean that the interpretation of these shares remains constant. If, for instance, three pieces of soap compose 20% of expenditures in the toiletries subgroup in 2005, this does not mean that 20% of expenditures on toiletries in 2014 can be interpreted as corresponding to three pieces of soap. One could, however, say that BPS applies what Esmara called the ‘dynamic poverty line’, by changing from round to round the reference living standard for poverty measurement.
Oficial Poverty Measurement in Indonesia since 1984: A Methodological Review 203
is still based on results from the 2004 SPKKD. To what extent the 2004 SPKKD esti-mates are plausible representations of the current or future non-food expenditure pattern is increasingly uncertain, and at some point BPS will need to implement a new round of the SPKKD or adopt a different approach to obtaining the non-food poverty line.
BPS has recently shown that it is willing to continue to experiment with the way it measures poverty—this time for district poverty estimates, which have not been discussed in this article. BPS published its irst oficial district poverty igures in 2002, based on the Susenas core collected in the July round. The annual district poverty igures for 2003–2010 followed this approach. Since 2011 Suse-nas has been conducted quarterly, and only by combining data from all quarters does BPS have a suficiently large sample to derive its district estimates. BPS has yet to publish details on how it deals with regional variations in seasonality pat-terns when combining these rounds, or on how it achieves comparability between the pre-2011 district igures and those from 2011 onwards. Likewise, it should be noted that the district poverty igures since 2011 are based entirely on the module section of Susenas while the 2002–10 estimates are derived from the core section. All of these matters remain to be studied.
REFERENCES
Asra, Abuzar. 1989. ‘Poverty Trend in Indonesia 1970–1987’. Ekonomi dan keuangan Indonesia [Economics and inance in Indonesia] 37: 379–92.
Beegle, Kathleen, Joachim de Weerdt, Jed Friedman, and John Gibson. 2012. ‘Methods of Household Consumption Measurement through Surveys: Experimental Results from
Tanzania’. Journal of Development Economics 98 (1): 3–18.
Bidani, Benu, and Martin Ravallion. 1993. ‘A Regional Poverty Proile for Indonesia’. Bul-letin of Indonesian Economic Studies 29 (3): 37–68.
Booth, Anne. 1993. ‘Counting the Poor in Indonesia’. Bulletin of Indonesian Economic Studies
29 (1): 53–83.
BPS (Badan Pusat Statistik). 1984. Jumlah dan persentase penduduk miskin di Indonesia 1976– 1981 [The number and percentage of poor people in Indonesia 1976–1981]. Jakarta: BPS.
———. 1987. Jumlah dan persentase penduduk miskin di Indonesia 1976-1984 [The number and
percentage of poor people in Indonesia 1976–1984]. Jakarta: BPS.
———. 1992. Kemiskinan dan pemerataan pendapatan di Indonesia 1976–1990 [Poverty and
income distribution in Indonesia 1976–1990]. Jakarta: BPS.
———. 1993. Evaluasi metodologi Susenas 1963/1964–1992 [Susenas evaluation methodology
1963/1964–1992]. Jakarta: BPS.
———. 2002. Dasar-dasar analisis kemiskinan [The basics of poverty analysis]. Jakarta: BPS
and the World Bank Institute.
———. 2010. Laporan TA: Penyempurnaan metode pengukuran kemiskinan rumah tangga di
Indonesia [A report: Improving the method of measuring household poverty in Indone-sia]. Jakarta: BPS and the World Bank.
Chernichovsky, Dov, and Oey Astra Meesook. 1984. ‘Poverty in Indonesia: A Proile’. World Bank Staff Working Papers 671. Washington DC: World Bank.
CKS (Centraal Kantoor voor de Statistiek). 1928. ‘Onderzoek naar Gezinsuitgaven in Ned -erlandsch-Indië gedurende Augustus 1925 en het Jaar 1926’. [Survey into household expenditure in the Netherlands Indies during August 1925 and the year 1926]
Mede-deelingen van het Centraal Kantoor voor de Statistiek 60. [Reports of the central bureau
of statistics] Weltevreden: Albrecht.
204 Jan Priebe
Deaton, Angus, and Salman Zaidy. 2002. ‘Guidelines for Constructing Consumption Aggre -gates for Welfare Analysis’. Living Standards Measurement Study Working Paper 135.
Washington DC: World Bank.
De Weerdt, Joachim, Kathleen Beegle, Jed Friedman, and John Gibson. 2014. ‘The Chal -lenge of Measuring Hunger’. World Bank Policy Research Working Paper 6736.
Wash-ington DC: World Bank.
Esmara, Hendra. 1986. Perencanaan dan pembangunan di Indonesia [Planning and develop-ment in Indonesia]. Jakarta: Gramedia.
Haughton, Jonathan, and Shahidur R. Khandker. 2009. Handbook on Poverty and Inequality.
Washington DC: World Bank.
Hentschel, Jesko, and Peter Lanjouw. 1996. ‘Constructing an Indicator of Consumption for
the Analysis of Poverty: Principles and Illustrations with Reference to Ecuador’. Living
Standards Measurement Study Working Paper 124. Washington DC: World Bank.
———. 2000. ‘Household Welfare Measurement and the Pricing of Basic Services’. Journal
of International Development 12 (1): 13–27.
Howes, Stephen, and Jean Olsen Lanjouw. 1997. ‘Poverty Comparisons and Household
Survey Design’. Living Standards Measurement Study Working Paper 129. Washington
DC: World Bank.
Kakwani, Nanak. 2003. ‘Issues in Setting Absolute Poverty Lines’. Poverty and Social Development Papers 3. Manila: Asian Development Bank.
Lanjouw, Peter. 2005. ‘Constructing a Consumption Aggregate for the Purpose of Wel
-fare Analysis: Issues and Recommendations Concerning the POF 2002/03 in Brazil’. Unpublished working paper. Washington DC: World Bank.
Lanjouw, Jean Olsen, and Peter Lanjouw. 1997. ‘Poverty Comparisons with Non-compatible Data: Theory and Illustrations’. Policy Research Working Paper 1709. Washington DC:
World Bank.
Leigh, Andrew, and Pierre van der Eng. 2010. ‘Top Incomes in Indonesia 1920–2004’. In Top Incomes: A Global Perspective, edited by A. B. Atkinson and T. Piketty, 171–219. Oxford: Oxford University Press.
Levinsohn, James, Stephen Berry, and Jed Friedman. 2003. ‘Impacts of the Indonesian Eco
-nomic Crisis: Price Changes and the Poor’. In Managing Currency Crises in Emerging Markets, edited by Michael P. Dooley and Jeffrey A. Frankel, 393–428. Chicago: Univer
-sity of Chicago Press.
LIPI (Lembaga Ilmu Pengetahuan Indonesia). 1978. ‘Kecukupan kalori dan zat gizi yang dianjurkan untuk Indonesia’ [The recommended calories and nutritional requirements in Indonesia]. In Widyakarya nasional pangan dan gizi [Widyakarya national food and nutrition]. Workshop proceedings. Jakarta: LIPI.
Maksum, Choiril. 2004. ‘Oficial Poverty Measurement in Indonesia’. Paper presented at the International Conference on Oficial Poverty Statistics, Mandaluyong City, Philip -pines, 4–6 October.
McCulloch, Neil, Julian Weisbrod, and C. Peter Timmer. 2007. ‘Pathways out of Poverty during an Economic Crisis: An Empirical Assessment of Rural Indonesia’. Policy Research Working Paper 4173. Washington DC: World Bank.
Miranti, Riyana. 2010. ‘Poverty in Indonesia 1984–2002: The Impact of Growth and Changes
in Inequality’. Bulletin of Indonesian Economic Studies 46 (1): 79–97.
Miranti, Riyana, Yogi Vidyattama, Erick Hansnata, Rebecca Cassells, and Alan Duncan. 2013. ‘Trends in Poverty and Inequality in Decentralising Indonesia’. OECD Social, Employment and Migration Working Papers 148. Paris: OECD Publishing.
Nashihin, M. (2007). ‘Poverty Incidence in Indonesia, 1987–2002: A Utility-Consistent
Approach Based on a New Survey of Regional Prices’. PhD diss., The Australian National University.
Nugraha, Kunta, and Phil Lewis. 2013. ‘Towards a Better Measure of Income Inequality in Indonesia’. Bulletin of Indonesian Economic Studies 49 (1): 103–12.
Oficial Poverty Measurement in Indonesia since 1984: A Methodological Review 205
Nyberg, A. J. 1976. ‘A Bias in Susenas Data’. Bulletin of Indonesian Economic Studies 12 (1): 110–11.
Pradhan, Menno. 2009. ‘Welfare Analysis with a Proxy Consumption Measure: Evidence
from a Repeated Experiment in Indonesia’. Fiscal Studies 30 (3-4): 391–417.
Pradhan, Menno, Asep Suryahadi, Sudarno Sumarto, and Lant Pritchett. 2000. ‘Measure-ments of Poverty in Indonesia: 1996, 1999, and beyond’. SMERU Working Paper, June. Jakarta: SMERU.
———. 2001. ‘Eating like Which “Joneses?”: An Iterative Solution to the Choice of a Pov
-erty Line “Reference Group”’. Review of Income and Wealth 47 (4): 473–87.
Ravallion, Martin. 1998. ‘Poverty Lines in Theory and Practice’. Living Standards
Measure-ment Study Working Paper 133. Washington DC: World Bank.
———. 2008. ‘Poverty Lines’. In The New Palgrave Dictionary of Economics, 2nd edition,
edited by Steven N. Durlauf and Lawrence E. Blume. London: Palgrave Macmillan.
Ravallion, Martin, and Benu Bidani. 1994. ‘How Robust Is a Poverty Proile?’. The World Bank Economic Review 8 (1): 75–102.
Ravallion, Martin and Monica Huppi. 1991. ‘Measuring Changes in Poverty: A Methodo
-logical Case Study of Indonesia during an Adjustment Period’. World Bank Economic Review 5 (1): 57–82.
Ravallion, Martin, and Dominique van der Walle. 1991a. ‘The Impact of Poverty and Food
Price Reforms: A Welfare Analysis for Indonesia’. Journal of Policy Modeling 13 (2): 281– 99.
———. 1991b. ‘Urban–Rural Cost-of-Living Differentials in a Developing Country’. Journal
of Urban Economics 29 (1): 113–27.
Ritonga, Hamonangan, and Ahmad Avenzora. 2002. Metodologi dan proil kemiskinan [The
methodology and proile and poverty]. Jakarta: Badan Pusat Statistik.
Sajogyo. 1975. Usaha Perbaikan Gizi Keluarga [Efforts to improve family nutrition]: ANP Evaluation Study, 1973. Bogor: Bogor Agricultural University.
Sajogyo and Gunawan Wiradi. 1985. Rural Poverty and Efforts for Its Alleviation in Indonesia: A Sociological Review. World Conference on Agrarian Reform and Rural Development (WCARRD) Follow-Up Program In-Depth Studies Series 18. Rome: Food and Agricul -ture Organization of the United Nations.
Sumner, Andy, and Peter Edward. 2014. ‘Assessing Poverty Trends in Indonesia by Inter-national Poverty Lines’. Bulletin of Indonesian Economic Studies 50 (2): 207–225.
Surbakti, Pajung. 1995. Indonesia’s National Socio-economic Survey: A Continual Data Source for Analysis on Welfare Development. Jakarta: BPS.
Sutanto, Agus, and Ahmad Avenzora. 1999. Pengukuran tingkat kemiskinan di Indonesia 1976–1999: Metode BPS [Measuring the level of poverty in Indonesia 1976–1999: BPS methods]. Jakarta: BPS.
United Nations. 2005. Handbook on Poverty Statistics: Concepts, Methods and Policy Use. New York: United Nations Statistics Division.
Van der Walle, Dominique. 1988. ‘On the Use of the SUSENAS for Modelling Consumption
Behaviour’. Bulletin of Indonesian Economic Studies 24 (2): 107–21.
World Bank. 1980. Employment and Income Distribution in Indonesia. Washington DC: World Bank.
———. 1990. Indonesia: Strategy for a Sustained Reduction in Poverty. Washington DC: World
Bank.
———. 1993. Indonesia: Public Expenditures, Prices and the Poor. Jakarta: World Bank. ———. 2006. Reference Manual: Standardized File and Standardized Indicators. Washington
DC: World Bank.
———. 2007. ‘Assessing Indonesia’s Socio-economic Survey’. Unpublished working paper.
Jakarta: World Bank.