Report of the
Malaysian
National
Neonatal
Registry
2005
A Study of Critically ill Babies in Neonatal Intensive Care Units
Edited by: Nyok-Ling Lim
NNR Steering Committee: Nyok-Ling Lim
Jimmy Lee Irene Cheah Anna Padma Soosai
Ismail Haron Hans van Rostenberghe
The Malaysian National Neonatal Registry is located at:
Malaysian National Neonatal Registry Level 8, Ward 8B, Seminar Room Hospital Selayang
Lebuhraya Selayang-Kepong 68100, Batu Caves
Selangor Darul Ehsan
This report is copyright. However it may be freely reproduced without the permission of the Malaysian National Neonatal Registry. Acknowledgement would be appreciated.
Suggestion citation is:
Lim Nyok Ling for the MNNR. 2nd Report of Malaysian National Neonatal Registry 2005
Kuala Lumpur MNNR 2007
Tel : (603) 6135 2008 / 6120 3233 Ext. 8011
Fax : (603) 6135 2008
E-mail : [email protected]
CONTENTS
LISTING OF TABLES………... iii
LISTING OF FIGURES………..………... vii
FOREWORD………... viii
ACKNOWLEDGMENTS………... ix
PARTICIPATING HOSPITALS……… x
STEERING COMMITTEE………... xi
ADVISORY COMMITTEE………... xii
LIST OF SITE COORDINATORS………... xv
STAFF OF MALAYSIAN NATIONAL NEONATAL REGISTRY……….……….. xix
SUPPORTING STAFF FROM THE CLINICAL RESEARCH CENTRE……….……….. xix
BIOSTATISTICAL CONSULTANTS………... xix
Report of the Malaysian National Neonatal Registry (MNNR) 2005 1. Organisation of the MNNR………... 1
1.1 History………... 1
1.2 Structure………... 1
1.3 Funding………... 2
2. Data Set………... 2
2.1 Registration criteria………... 2
2.2 Data set variables………. 2
2.3 Data Collection Technique………... 2
2.4 Data Verification………... 3
3. Results……..………... 3
3.1 In General………... 3
3.1.1 Registrants per unit………... 5
3.1.2 Levels of Neonatal Care………... 5
3.2 The Mother………... 6
3.3 Antenatal event………... 6
3.3.1 Antenatal corticosteroid………... 6
ii
3.4.1 Multiple birth………... 7
3.5 Birth………... 7
3.5.1 Inborn vs Outborn Babies……… 7
3.5.2 Mode of delivery………... 9
3.5.3 Condition of VLBW babies (BW <1500gm)………....… 9
3.5.4 Need for Ventilatory Support (VS)……… 10
3.6 Morbidity………... 11
3.6.1 Respiratory distress………... 11
3.6.1.1 Respiratory distress syndrome……… 12
3.6.1.2 Congenital pneumonia (C Pneu)……… 12
3.6.1.3 Meconium aspiration syndrome (MAS)………... 12
3.6.1.4 Hypoxic ischaemic encephalopathy………... 12
3.6.1.5 Neonatal encephalopathy (NE)………... 12
3.6.1.6 Congenital anomalies (CA)……… 12
3.6.1.7 Pneumothorax (PTX)……… 13
3.6.1.8 Exogenous Surfactant………... 13
3.6.2 Cerebral ultrasound scan (CUS)……….. 14
3.6.3 Eye Examinations……….. 14
3.6.4 Necrotising enterocolitis……… 15
3.6.5 Neonatal infections……… 15
3.7 Outcome………..………. 17
3.7.1 Perinatal and Neonatal Mortality Rates……… 19
3.7.2 Discharge………..……….. 20
4. Tables………..……….. 21
5. Additional Tables………..………... 51
Appendix 1 Monthly Birth Census………. 85
Appendix 2 Case Report Form………..………. 87
Training Manual 2005 …..………... 91
Papers written and presented…..……… 110
LISTING OF TABLES
Table 1. Birth census in participating hospitals, 2005………..……... 21
Table 2. Admissions to each Neonatal Unit, 2004 and 2005………..……... 22
Table 3. Case distribution according to gestational age group, 2004 and 2005………...……... 23
Table 4. Case distribution according to birth weight group, 2004 and 2005……….. 23
Table 5. Growth status according to gestational age group, 2004 and 2005………... 23
Table 5a. Growth status according to birth weight group, 2004 and 2005………..…... 24
Table 6. Ventilatory support according to gestational age group, 2004 and 2005……….…………. 24
Table 6a. Ventilatory support according to birthweight group, 2004 and 2005………….………….. 24
Table 7. Ethnicity according to gestation group, (weeks) 2004 and 2005……….…...…….. 25
Table 7a. Ethnicity according to birthweight group, 2004 and 2005………... 26
Table 8. Mean maternal age according to gestational age group, 2004 and 2005…..……..………... 27
Table 8a Mean maternal age according to birthweight group, 2004 and 2005………….…..………. 27
Table 9. Use of antenatal steroid according to gestational age group, 2004 and 2005... 27
Table 9a. Use of antenatal steroid in inborn and outborn babies < 32 weeks gestation, 2005... 28
Table 10. Multiplicity of births according to gestational age group, 2004 and 2005………... 28
Table 10a. Multiplicity of births according to birthweight group, 2004 and 2005…………..………... 29
Table 11. Gender according to gestational age group, 2004 and 2005………..……... 30
Table 11 a. Gender according to birthweight group, 2004 and 2005………...……… 30
Table 12. Inborn-Outborn status according to gestational age group, 2004 and 2005………... 31
Table 12a. Inborn-Outborn status according to birthweight group, 2004 and 2005………..…………. 31
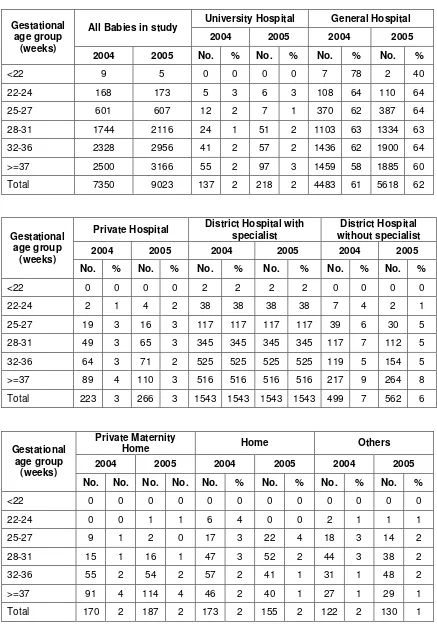
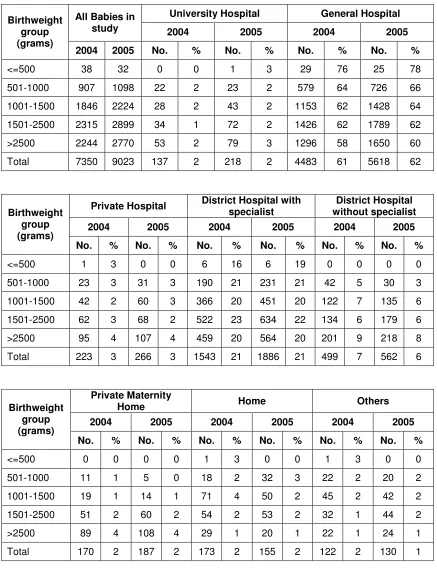
Table 13. Place of birth according to gestational age group, 2004 and 2005………..………. 32
Table 13a. Place of birth according to birthweight group, 2004 and 2005….…………...…..………... 33
Table 14. Mode of delivery according to gestational age group, 2004 and 2005………...………... 34
Table 14a. Mode of delivery according to birthweight group, 2004 and 2005………..…………. 35
Table 15. Survival rate according to CRIB score for babies <1500 gm, 2004 and 2005…..……... 36
Table 15a. Mean CRIB score and survival rate according to centre, 2004 and 2005………. 37
Table 16. Use of CPAP according to gestational age group, 2004 and 2005……….………... 38
Table 16a. Use of CPAP according to birthweight group, 2004 and 2005………... 38
iv
Table 17a. Use of HFOV according to birthweight group, 2004 and 2005………... 39
Table 18. Use of Nitric Oxide to gestational age group, 2004 and 2005……….. 40
Table 18a. Use of Nitric Oxide according to birthweight group, 2004 and 2005………... 40
Table 19. Use of patient-trigger ventilation to gestational age group, 2004 and 2005……….. 40
Table 19a. Use of patient-trigger ventilation according to birthweight group, 2004 and 2005……….. 41
Table 20. Mean total duration of ventilatory support according to gestational age group, 2004 and 2005………... 41
Table 20a. Mean total duration of ventilatory support according to birthweight group, 2004 and 2005……….. 42
Table 21. Ventilatory support and mortality rates according to diagnosis, 2005……….. 42
Table 22. Congenital anomalies according to birthweight group, 2005………...……… 43
Table 23. Pneumothorax in ventilated babies, 2005………...………...……….. 44
Table 24. Use of surfactant in Respiratory Distress Syndrome (RDS), 2005………...……... 44
Table 25. Use and timing of surfactant therapy according to birthweight group, 2005……….... 44
Table 26. Supplemental oxygen use according to survival status of birthweight group, 2005………. 45
Table 26a. Supplemental oxygen use according to survival status of gestational age group, 2005…… 45
Table 27. Cerebral ultrasound scanning (CUS) and intraventricular haermorrhage (IVH) in babies with BW 501-1500g, 2005……… 46
Table 28. Cerebral ultrasound scanning according to birthweight group, 2004 and 2005……… 46
Table 29. ROP screening according to gestational age group 2004 and 2005……….. 46
Table 29a. ROP screening according to birthweight group, 2004 and 2005………... 47
Table 30. Incidence of retinopathy of prematurity according to birthweight group, 2005……… 47
Table 31. Necrotising enterocolitis and confirmed sepsis according to birthweight group, 2005…… 47
Table 32. Sepsis associated mortality according to birthweight group, 2005………... 48
Table 33. Survival according to gestation (gestational age group), 2004 and 2005……….. 48
Table 33a. Survival according to birthweight group, 2004 and 2005………. 49
Table 34. Mean total duration of hospital stay according to gestational age, 2004 and 2005………... 49
Table 34a. Mean total duration of hospital stay according to birthweight 2004 and 2005………. 50
Table 35. Use of antibiotic according to BW group, 2004 and 2005……… 51
Table 36. Use of postnatal steroid for CLD according to birthweight group, 2004 and 2005……... 52
Table 38. Enteral nutrition feeding on discharge according to birthweight group, 2004 and 2005….. 53
Table 39. Mean Discharge weight according to gestational age group, 2004 and 2005………... 53
Table 39a. Mean Discharge weight according to birthweight group, 2004 and 2005………. 54
Table 40. Place of discharge, if child alive, according to birthweight group 2005………... 54
Table 41. Reasons for transfer to other hospitals according to centres, 2005………... 54
Table 42. Post-transfer disposition, 2005……….. 55
Table 43. HIE according to birthweight group, 2005……… 55
Table 44. Mean highest total serum bilirubin according to BW group, 2005………... 56
Table 45. Episodes of confirmed bacterial sepsis according to BW group and survival status, 2005... 56
Table 46. Mortality rate of confirmed fungal sepsis according to BW group, 2005………. 57
Table 47. Use of antenatal steroid to centres, 2005 (Inborn)………. 57
Table 47a. Use of antenatal steroid to centres, 2005 (Outborn)……….. 58
Table 48. Use of surfactant in Respiratory Distress Syndrome (RDS) according to centres, 2005….. 59
Table 49. Use of Parenteral nutrition (PN) according to centres, 2005………. 60
Table 50. Pneumothorax according to centres, 2005………. 61
Table 51. Use of supplemental oxygen on day 28 for VLBW babies according to centres, 2005…… 62
Table 51a. Use of supplemental oxygen on day 28 for VLBW babies according to centres, 2005…… 63
Table 51 b. Use of supplemental oxygen at 36 weeks corrected gestation for VLBW babies according to centres, 2005……….. 64
Table 51c. Use of supplemental oxygen at 36 weeks corrected gestation for VLBW babies according to centres, 2005……….. 65
Table 52. Cerebral ultrasound scanning (CUS) and intraventricular haermorrhage (IVH) in babies with BW 501-1500g according to centre, 2005……… 66
Table 53. Retinopathy of prematurity (ROP) (Babies < 32 weeks gestation) according to centres, 2005………... 67
Table 54. Retinopathy of prematurity (ROP) (Babies with BW < 1250g) according to centres, 2005 68 Table 55. Cephalheamatoma, Sub-aponeurotic haemorrhage, Erb’s palsy and Birth Trauma according to centres, 2005……….. 69
Table 56. Necrotising enterocolitis (NEC) (Babies with BW 501-1500g) according to centres, 2005.. 70
Table 57. Confirmed bacterial sepsis according to centres, 2005……….. 71
vi Table 57b. Confirmed bacterial sepsis in very low birthweight babies (501-1500g) according to
centres, 2005……….. 73
Table 58. Fungal sepsis in very low birthweight babies (501-1500g) according to centres, 2005……. 74
Table 59. Perinatal and neonatal death and mortality rate according to centres, 2005……….. 75
Table 60. Survival of extremely preterm (22-27 weeks’ gestation) and very preterm (28-31 weeks’
gestation) according to centres, 2005……… 76
Table 61. Survival of extremely low birthweight (BW 501-1000gm) and very low birthweight (BW
1001-1500gm) according to centres, 2005……… 77
Table 62. Survival of cases with ventilatory support (VS) according to centres, 2005………. 78
Table 63. Duration of hospital stay for babies of BW 501-750 gm according to centres, 2005……… 79
Table 63a. Duration of hospital stay for babies of BW 751-1000 gm according to centres, 2005…….. 80
Table 63b. Duration of hospital stay for babies of BW 1001-1250 gm according to centres, 2005…… 81
Table 63c. Duration of hospital stay for babies of BW 1251-1500 gm according to centres, 2005…… 82
Table 63d. Duration of hospital stay for babies of BW 1501-2500 gm according to centres, 2005…… 83
LISTING OF FIGURES
Fig 1. Case distribution according to gestational age group, 2004 & 2005………..……….. 4
Fig 2. Case distribution according to birthweight group, 2004 & 2005………..………... 4
Fig 3. Case distribution according to ethnicity, 2004 & 2005………... 6
Fig 4. Case distribution according to sex, 2005………...……... 7
Fig 5. Case distribution according to BW groups and inborn - outborn status, 2005 (Percentages pertain to inborn cases)……… 8
Fig 6. Mode of delivery according to gestation, 2005………... 9
Fig 7. Mortality of VLBW babies according to CRIB score, 2004 & 2005………..…... 10
Fig 8. Use of specific ventilation support modes, 2004 & 2005……….……… 11
Fig 9. Mean duration of VS for survivors according to gestational group, 2005………….………….. 12
Fig 10. Mortality rate according to specific condition, 2005……….…...………... 13
Fig 11. Use of surfactant in RDS, 2005………... 14
Fig 12. Frequency of various types of infections, 2005…..……..………... 15
Fig 12a. Types of infecting organisms in confirmed sepsis, 2005………... 16
Fig 13. Survival according to birthweight and gestational age group, 2005………….…..………... 17
Fig 14. Survival according to BW group for VLBW babies (BW up to 1500g), 2004 & 2005... 18
Fig 15. Survival according to gestation for very preterm babies (gestation < 32 weeks) 2004 & 2005... 18
Fig 16. Total births and neonatal deaths and mortality rates, 2005………... 19
viii
FOREWORD
The Malaysian National Neonatal Registry started data collection on the 1st of January 2004 and the first report was published and disseminated in July 2006. The objectives and inclusion criteria for the 2005 study remained essentially the same as that in 2004 but data standards in the Problems/Diagnoses Section were modified considerably in 2005 in that pertinent information on problems/diagnoses was captured as mandatory fields to increase the accuracy and completeness of data being captured.
As in the 2004 report analysis of data on the ‘Outcome of Critically Ill Babies in Neonatal Intensive Care Units (NICUs) in Malaysia’ has also been kept at a minimal level. Outcomes are generally reported as overall outcomes in the main section of the report while comparative data on some specific outcomes among the participating centres are included in the back section of the report. Many of the tables on overall outcomes also include comparative data for the year 2004. There were an additional 3 centres in 2005 compared to 2004 (27 vs. 24 respectively) and cases included in the study numbered 9023 in 2005 compared to 7350 in 2004.
Some specific outcomes e.g. ‘Outcomes of inborn vs. outborn infants’, ‘Congenital anomalies among critically ill babies ‘ and ‘Outcomes of term critically ill babies in NICUs’ have also been studied by individual participants and presentations made at the 5th MNNR Forum held in December 2006 in Kuala Lumpur. Further studies e.g. ‘Is intravenous preferable to oral indomethacin for use in VLBW babies in NICUs?’ and ‘Hyperbilirubinaemia among sick babies in NICUs’ were presented at the 14th Annual Perinatal Congress in March 2007.
We await though the publication of the first paper in a medical journal from data collected from the registry so far. It is understood that some authors who have made presentations at various meetings are in the process of writing up the papers to be submitted for publication and we wish each of them success. All source data producers are encouraged to be involved in utilization of data collected in the MNNR for further study, presentations and publications.
At the 5th MNNR Forum on ‘Data-based evidence for quality improvement’ Professor Shoo K Lee from the Canadian Neonatal Network shared some of the Canadian experience on quality improvement strategies while Professor NY Boo from Universiti Kebangsaan Malaysia shared her experience from UKM’s involvement in the Vermont-Oxford Neonatal Network. The MNNR will have to consider incorporating some formal quality improvement programs into its structure. Meanwhile it is vital however that each centre study its outcome in greater detail and objectivity so that weaknesses can be identified and remedial measures instituted where appropriate.
It is hoped that the registry will grow each year in terms of engaging participation of increasing numbers of NICUs and in the technical development of its study design and protocol. Web-based data entry and analysis software has been developed for 2006 data and it is aimed that each centre will finally be able to gain access to data on-site, promptly.
Dato’ Dr Lim Nyok Ling Chairman
ACKNOWLEDGMENT LIST
The Malaysian National Neonatal Registry would like to express its grateful appreciation to everyone who has contributed to make this report a success.
We would especially like to thank the following:
• The Ministry of Health, in particular, the honorable Minister of Health Y. B. Dato’
Seri Dr Chua Soi Lek for his kind support
• Y. B. Tan Sri Dr Mohd Ismail Merican, the Director-General of Health, Malaysia for
approving a research grant in 2004 for 2 years to study the ‘Outcome of critically ill babies in NICUs”
• Dato’ Dr. Zaki Morad B Mohd Zaher , the chairman of the Ministry of Health
Research Committee for his inspiration and guidance
• Members of the “Steering Committee” for their expertise and contributions to the
registry
• Our source data providers who are doctors and nurses working in the NICUs without
whose committement, hard work and timely data submissions this report will not be published
• Staff of the Clinical Research Centre, Hospital Kuala Lumpur for their technical
support
• Other sponsors and supporters from the professional bodies, industries and
institutions listed below :
Perinatal Society of Malaysia
Abbott Laboratories (M) Sdn Bhd
Sekolah Menengah Sri Kuala Lumpur
Dumex Sciences
Mead Johnson Malaysia
• Contributors who have provided financial support in 2004
x
PARTICIPATING HOSPITALS
1. Alor Setar Hospital
2. Ipoh Hospital
3. Kajang Hospital
4. Keningau Hospital
5. Kuala Lumpur Hospital
6. Likas Hospital
7. Melaka Hospital
8. Miri Hospital
9. Pulau Pinang Hospital
10.Putrajaya Hospital
11.Raja Perempuan Zainab II Hospital
12.Sarawak General Hospital
13.Seberang Jaya Hospital
14.Selayang Hospital
15.Seri Manjung Hospital
16.Sibu Hospital
17.Sultan Haji Ahmad Shah Hospital
18.Sultanah Aminah Hospital
19.Sultanah Fatimah Specialist Hospital
20.Sultanah Nur Zahirah Hospital
21.Taiping Hospital
22.Teluk Intan Hospital
23.Tengku Ampuan Afzan Hospital
24.Tengku Ampuan Rahimah Hospital
25.Tuanku Fauziah Hospital
26.Tuanku Jaafar Hospital
STEERING COMMITTEE
Member Designation and Institution
Dato’ Dr Lim Nyok Ling (Chairperson)
Head of Paediatric Department, Selayang Hospital, Selangor
Dato’ Dr Jimmy Lee Kok Foo Head of Paediatric Department, Sultanah Nur Zahirah Hospital, Kuala Terengganu, Terengganu
Dr Irene Cheah Head of Neonatal Unit, Paediatric Institute, Kuala Lumpur Hospital, Kuala Lumpur
Dr Anna Padma Soosai Consultant Paediatrician and Neonatologist, Tengku Ampuan Rahimah Hospital, Klang, Selangor
Dr Ismail Haron Consultant Paediatrician and Neonatologist, Sungai Buloh Hospital, Selangor
A.Prof. Dr Hans van Rostenberghe
Consultant Paediatrician and Lecturer, University Sains Malaysia Hospital, Kubang Kerian, Kelantan
A.Prof. Dr Thong Meow Keong
Consultant Paediatrician and Lecturer, University Malaya Medical Centre, Kuala Lumpur
xii
ADVISORY COMMITTEE
Member Designation and Institution
Dr Teh Keng Hwang Head of Paediatric Department, Alor Setar Hospital
Dr Amar Singh Head of Paediatric Department, Ipoh Hospital
Dr Soo Min Hong Head of Paediatric Department, Kajang Hospital
Dr Ho Lai Jade Head of Paediatric Department, Keningau Hospital
Dr Irene Cheah Head of Neonatal Unit, Paediatric Institute, Kuala Lumpur Hospital
Dr Soo Thian Lian Head of Paediatric Department, Likas Hospital
Dr Leow Poy Lee Consultant Paediatrician, Melaka Hospital
Dr Chin Saw Sian Head of Paediatric Department, Miri Hospital
Dr Revathy Nallusamy Head of Paediatric Department, Pulau Pinang Hospital
Dr Fuziah bt Md Zain Head of Paediatric Department, Putrajaya Hospital
Member Designation and Institution
Dr Chan Lee Gaik Head of Paediatric Department, Sarawak General Hospital
Dr Angeline Yeoh Head of Paediatric Department, Seberang Jaya Hospital
Dato’ Dr Lim Nyok Ling Head of Paediatric Department, Selayang Hospital
Datin Dr Chan Sow Keng Head of Paediatric Department, Seri Manjung Hospital
Dr Audrey Chieng Chae Hee Consultant Paediatrician, Sibu Hospital
Dr Ani Suraya bt Abdul Ghani Head of Paediatric Department, Sultan Haji Ahmad Shah Hospital
Dr Tham Pui Ying Head of Paediatric Department, Sultanah Aminah Hospital
Dr Angeline Wan Seng Lian Head of Paediatric Department, Sultanah Fatimah Specialist Hospital
Dato’ Dr Jimmy Lee Kok Foo Head of Paediatric Department, Sultanah Nur Zahirah Hospital, Kuala Terengganu
Dr Neoh Siew Hong Head of Paediatric Department, Taiping Hospital
xiv
Member Designation and Institution
Dr Chin Choy Nyok Head of Paediatric Department, Tengku Ampuan Afzan Hospital
Dr Yogeswery Sithamparanathan
Head of Paediatric Department, Tengku Ampuan Rahimah Hospital
Dr Jamaluddin bin Mohammad Head of Paediatric Department, Tuanku Fauziah Hospital
Dr Umathevi Consultant Paediatrician, Tuanku Jaafar Hospital
Dr Norizan bt Majid Head of Paediatric Department, University Sains Malaysia Hospital
Dr Hussain Iman b Hj Mohammad Ismail
Head of Paediatric Institute, Kuala Lumpur Hospital
Professor Dr Boo Nem Yun Professor of Neonatology, University Kebangsaan Malaysia Hospital
Professor Dr Lim Chin Theam Professor of Neonatology, University Malaya Medical Centre
Professor Dr Jackie Ho Professor of Neonatology, Perak Medical College
LIST OF SITE COORDINATORS
Institution Head of Department Coordinators
Paediatric Department
Alor Setar Hospital Dr Teh Keng Hwang
Dr Teh Keng Hwang Sr Nooraini bt Suhud
Paediatric Department
Ipoh Hospital Dr Amar Singh
Prof Jackie Ho Sr Lim Bee Chun S/N Tan Hai Hon S/N Renuga Devi
Paediatric Department
Kajang Hospital Dr Soo Min Hong
Dr Soo Min Hong
Kuala Lumpur Hospital Dr Hussain Iman b Hj Mohammad Ismail
Likas Hospital Dr Soo Thian Lian
Dr Soo Thian Lian
Sr Tomblow bt Nagadiran S/N Suzie Sulinol
Paediatric Department
Melaka Hospital Dr Kuan Geok Lan
Dr Leow Poy Lee Sr Lim Geok Poh S/N Normah Omar
Paediatric Department
Miri General Hospital Dr Chin Saw Sian
xvi
Institution Head of Department Coordinators
Paediatric Department
Pulau Pinang Hospital Dr Revathy Nallusamy
Dr Mahela
Sr Tai Seow Beng S/N Zurina bt Ahmad
Paediatric Department
Putrajaya Hospital Dr Fuziah bt Md Zain
Dr Siti Mazliah bt Kassim
Sarawak General Hospital Dr Chan Lee Gaik
Dr Chan Lee Gaik Sr Maria Kilat
S/N Sabariah bt Kiflie
Paediatric Department
Seberang Jaya Hospital Dr Angeline Yeoh
Dr Angeline Yeoh
Sr Ku Azini Ku Mohamad S/N Lee Soon Mui
Paediatric Department
Selayang Hospital Dato’ Dr Lim Nyok Ling
Dato’ Dr Lim Nyok Ling
Seri Manjung Hospital Datin Dr Chan Sow Keng
Datin Dr Chan Sow Keng Sr Ainan Abdul Karim S/N Tham Ngun Lee
Paediatric Department
Sibu Hospital Dr Wong See Chang
Institution Head of Department Coordinators
Sultanah Aminah Hospital Dr Tham Pui Ying
Dr Wong Ching Ning
Taiping Hospital Dr Neoh Siew Hong
Teluk Intan Hospital Dr Ng Su Yuen
xviii
Institution Head of Department Coordinators
Paediatric Department Tengku Ampuan Rahimah Hospital
Dr Yogeswery Sithamparanathan
Dr Anna Padma Soosai Dr Wong Yoke Peng Sr Ham Fin Lan
S/N Rasinah bt Puteh Ishak
Paediatric Department Tuanku Fauziah Hospital
Dr Jamaluddin bin Mohammad
Dr Nur Hidayati bt Abdul Halim
Sr Zarinah bt Ahmad S/N Zarini bt Johari
Paediatric Department
Tuanku Jaafar Hospital Dr Tan Kah Kee
Dr Umathevi
Sr Malathy Krishnan S/N Sumathi Ramasamy S/N Zarinah Nordin
Paediatric Department Univeristy Sains Malaysia Hospital
Dr Norizan bt Majid
STAFF OF MALAYSIAN NATIONAL NEONATAL REGISTRY
Clinical Registry Manager Ms Jennifer Loong
Clinical Registry Assistants Ms Sabariah bt Abdullah Ms Shahirah bt Safian
SUPPORTING STAFF FROM THE CLINICAL RESEARCH CENTRE
Director Dato’ Dr Zaki Morad b Mohd Zaher
Head Dr Lim Teck Onn
Ms Celine Tsai Pao Chin Information & Communication Technology (ICT) Manager
Mr Kevin Ng Hong Heng Network Administrator
Mr Adlan Ab. Rahman Assistant Network Administrator
Ms Lim Jie Ying Database Administrator
Mr Sebastian Thoo/Mr John Chong Programmer
Ms Azizah Alimat Desktop publisher
Mr Patrick Lum See Kai Webmaster
BIOSTATISTICAL CONSULTANTS
Dr Sharon Chen Won Sun
1
Report of the Malaysian National Neonatal Registry (MNNR) 2005
1. Organisation of the MNNR 1.1History
In October 2001 at a National Paediatricians’ meeting it was decided that a registry should be set up to study the outcome of sick babies admitted to Neonatal Intensive Care Units (NICUs) in the country. It was recognised that a minimum data set and a data collection system at a national level are important to monitor mortality and morbidity of infants admitted to NICUs
In collaboration with the Clinical Research Centre (CRC), Ministry of Health of Malaysia,
a pilot study was first conducted from 1st October to 31st December in which 14 centres
participated. A report of this study has been published in October 2003. It was concluded that the NNR is feasible and very useful information can be obtained for purposes of clinical management, resource allocation and policy development. The NNR proper was
then launched on 1st January 2004 and the first MNNR report for the year 2004 was
published in July 2006.
The Malaysian NNR aims to:
1. Determine the frequency and distribution of critically ill neonates in Malaysia.
These are useful measures of the health burden arising of neonatal critical illness and its care in the country.
2. To study the mortality and some morbidity outcomes of babies admitted to NICU
in participating hospitals.
3. To calculate the perinatal, neonatal, and stillbirth mortality rates of inborn babies.
4. To compare outcomes between various centres.
5. To develop indicators for standard of care in various areas e.g. ‘Acceptable
septicaemic rates in NICUs’.
6. To study in further detail outcome of very low birth weight babies.
7. Stimulate and facilitate research on neonatal critical illness and its management.
1.2 Structure
The MNNR consists of an Advisory Committee, Steering Committee and administrative staff. The Advisory Committee consists of heads of department (or their nominee) of each participating hospital, a few academic neonatologists from the Universities and a clinical biostatistician and epidemiologist. This committee is to monitor and direct the functions of MNNR and it meets at least once a year during a National Neonatal Registry Forum.
The Steering committee consists of 8 members, 6 of whom were elected. The 7th was
appointed for his expertise and involvement in the development of the ‘congenital
anomalies’ section of the registry and the 8th for his expertise and invaluable contribution
to the project. This committee is concerned with the general running and decision making of the Registry and to approve use of its data.
The administrative staff at the Neonatal Registry Unit (NRU) is headed by a Clinical Nurse Manager. She is assisted by a clinical registry officer and 2 other clinical registry
1.3 Funding
The Ministry of Health of Malaysia provided a research grant for 2 years in 2004 to ‘Study the outcome of critically ill babies in NICUs’. Considerable funding was also obtained from the Perinatal Society of Malaysia, the Malaysian Paediatric Foundation, Penyayang, Hwang DBS, Abbott Laboratories, Frisenius Kabi and some individuals and institutions in 2004. In 2005 some funds were also raised from the organisation of 3 NNR Forums. We thank all involved for their very generous and encouraging support.
2. Data Set
2.1 Registration criteria
The NNR audit of critically ill babies admitted to a Neonatal Unit (NNU) included
A. All babies admitted to a Neonatal Unit who
1. had a gestation of <32 weeks i.e. up to 31 weeks + 6 days. 2. had with a birth weight of 1500 gms and below
3. were ventilated
B. All neonatal deaths (i.e. newborn babies (<28days) who die in the NNU, delivery room ie Operating Theatre and labour room, and other wards)
Both inborn and outborn babies will be included but outborn babies who expire before arrival will be excluded. Babies who are admitted to the NNU at a corrected gestation of > 44/52 will not be considered a neonatal case and hence will be omitted from the study.
2.2 Data set variables
In 2005 the format of Case Report Forms (CRFs) was changed slightly to accommodate some changes in data variables. This is mainly in the area of chronic lung disease definitions (28 day’s oxygen and 36 corrected weeks’ dependence) and list of problems and diagnosis. Some of the diagnoses/problems have been captured into mandatory fields.
Data on all inborn births was also collected to facilitate calculation on perinatal and neonatal mortality rates of each hospital. (Appendix 1 Birth Census)
2.3 Data Collection Technique
The CRF consisted of 4 pages of forms. (Appendix 2 CRF) The first page had 4 sections. Section 1 consisted of Patient Particulars, Section 2 Birth History, Section 3 Neonatal Events and Section 4 Outcome.
3
A baby who was transferred between neonatal and paediatric wards under the same department will be considered to be the same admission and the discharge CRF is to be completed after complete discharge from the hospital.
Hard copies CRFs were used and completed CRFs were sent to the Neonatal Registry Unit (NRU) after a defined period.
2.4 Data Verification
Missing or anomalous data are identified by a manual check at the NRU and then queried and corrected with the respective centre. Further data verification is made on data entry onto the main database. Quantification of errors and the implementation of practices to minimise errors are continually refined.
3. RESULTS 3.1 In General
In 2005, total births in the 27 participating centres totaled 226878 of which 2063 were stillbirths and 224815 were livebirths.
A total of 9023 babies who were admitted (admissions also included outborns who were not delivered in respective hospitals of the participating centres) met the criteria to be included in the MNNR (Table 2). Of these 2901 (32.2%) were less than 32 completed weeks (Table 3) and 3354 (37.2%) had birthweights of 1500 grams and below (Table 4). There were more babies in the 2005 cohort compared to 2004 especially in the higher gestation and birthweight groups (Figs 1 and 2).
While the babies who met the criteria for the study were generally babies requiring the most care they do not include many other babies admitted to the NICUs for other treatments and observation.
Fig 1. Case distribution according to gestational age group, 2004 & 2005
No. of cases
Gestational age group in weeks
Fig 2. Case distribution according to birthweight group, 2004 & 2005
No. of cases
Birthweight group in grams 0
500 1000 1500 2000 2500 3000 3500
<22 22-24 25-27 28-31 32-36 >=37
2004 2005
0 500 1000 1500 2000 2500 3000
<500 501-1000 1001-1500 1500-2500 >2500
5
In terms of growth status 1747 (19%) of the whole study population was small for
gestational age (SGA < 10th centile for gestation according to Lubchenko chart). The SGA
rate for very preterm infants (gestation<32 weeks) was 18% and VLBW infants (BW 501-1500g) was 33% (Tables 5 and 5a).
Ventilatory support of whatever mode was given to a total of 7772 (86.1%) babies (Table 6).
3.1.1 Registrants per unit
Number of admissions and number of babies included in the study from each Neonatal Unit are as shown in Table 2. The number of babies who met the criteria and was babies, some of whom may need short-term observation during the first few hours of life. Level 1 care is mostly given to babies who are rooming –in with their mothers in obstetric wards
Level II or ‘special care’ refers to a nursery that generally has babies born at 32-36 weeks gestation or weighing around 1500-2500 grams at birth. It includes the care of babies who require intravenous therapy or antibiotics, and/or those who are convalescing after intensive care, and/or those who need their heart rate or breathing monitored, and/or those who need short term oxygen therapy. Babies who are above 35 weeks’ gestation and have birth weights above 1.8 kg but are otherwise well are usually not admitted but managed in the obstetric wards.
Level III or intensive care refers to the care of newborn infants who require specialized care and treatment. It includes most babies born at less than 32 weeks gestation or less than 1500 grams birthweight, and others who may require intravenous feeding, and/or surgery, and/or cardio-respiratory monitoring for management of apnoea or seizures, and/or supplemental oxygen over 40% or long term oxygen.
Hospitals with a level III NICU provide all the above levels of care and are referred to in this report as tertiary hospitals. Most Level III NICUs are in Ministry of Health hospitals and a few are in university hospitals. Big private hospitals generally do provide neonatal intensive care but very few do so in the context of an actual NICU. Most provide level III care to sick babies in an adult intensive care. A total of about 30-35 centres in the country provided neonatal intensive care to sick babies in 2005, and 27 of these NICUs are source data producers (SDPs) of the MNNR.
3.2 The Mother
Ethnicity as identified by the mother was reported as 64.8% Malays, 11.7% Chinese, 7.6 % Indians, 1.4 % Orang Asli, 4.3% Bumiputra Sabah, 5.1% Bumiputra Sarawak, 0.5%
other Malaysians and 4.5% foreigners (Table 7). Similar case distribution was seen in
2004 (Fig 3). Racial distribution in Malaysia in 2004 was estimated at 50.4% Malays, 23.7% Chinese, 7.1% Indians, 11% indigenious and 7.8% others (Information and Documentation Unit, Planning and Development Division, Ministry of Health Malaysia).
Fig 3. Case distribution according to ethnicity, 2004 & 2005
The mean maternal age in the study group was 30 +/- 7 years and there was little variation between the gestational and birthweight groups. (Tables 8 and 8a)
3.3 Antenatal events
3.3.1 Antenatal corticosteroids
Corticosteroids are administered to the mother to enhance the maturation of her baby’s lungs when it is thought she will deliver before 34 weeks’ gestation. The first randomized controlled trail of steroid use was in New Zealand in 1970 (Liggins & Howie, 1972). A systematic review reported antenatal steroids to be efficacious in helping to promote maturation of the lungs and preventing death (Crowley, 2003). This therapy also has other beneficial effects such as reduction of the incidence of necrotizing enterocolitis , without harmful effects for mother and baby. The Perinatal Society of Malaysia in collaboration with the Ministry of Health of Malaysia has recommended that maternal corticosteroids should be considered before all births at less than 34 weeks in order to improve neonatal outcomes. (PSM Clinical Practice Guidelines, 1995 updated 2001)
7
Males, 5241, 58% Females, 3748,
42%
Indeterminate, 33, 0%
This therapy was given to mothers of 1645 (57%) out of 2901 babies < 32 weeks (note babies 32-33 weeks who are not VLBW, and did not require ventilatory support or not died were not included in the study ). The use was better in the inborn (1522 out of 2426 ie 63%) compared to outborn babies (123 out of 475 i.e. 26%) as shown in Tables 9 and 9a.
3.4 The baby
3.4.1 Multiple births
There were 8243 (91.4%) singletons, 737 (8.2%) twins, and 39 (0.4%) triplets in the study. (Tables 10 and 10a)
The proportion of males in the study was 5241/9023 i.e. 58.1% and females 3748/9023 i.e. 41.5 %. Sex was indeterminate in 33 babies (0.4%) (Fig 4). Sex ratio at birth of all babies in the country was estimated at 1.07 male / 1 female in 2004 (Information and Documentation Unit, MOH). Relatively more males admitted into the study implied that babies of the male sex were at higher risk of being critically ill at birth. Tables 11 and 11a show the gender distribution according to gestational age and birthweight group.
Fig. 4. Case distribution according to sex, 2005 3.5 Birth
3.5.1 Inborn vs Outborn Babies
0
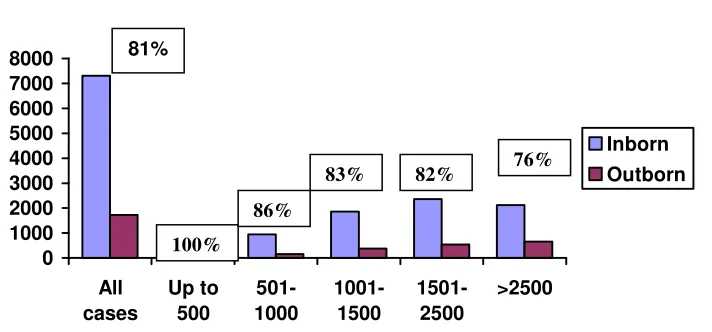
outborn status according to birthweight groups. Proportionately babies in the lower birthweight groups were more likely to be inborn.
Fig 5. Case distribution according to BW groups and inborn - outborn status, 2005 (Percentages pertain to inborn cases)
No. of cases
9
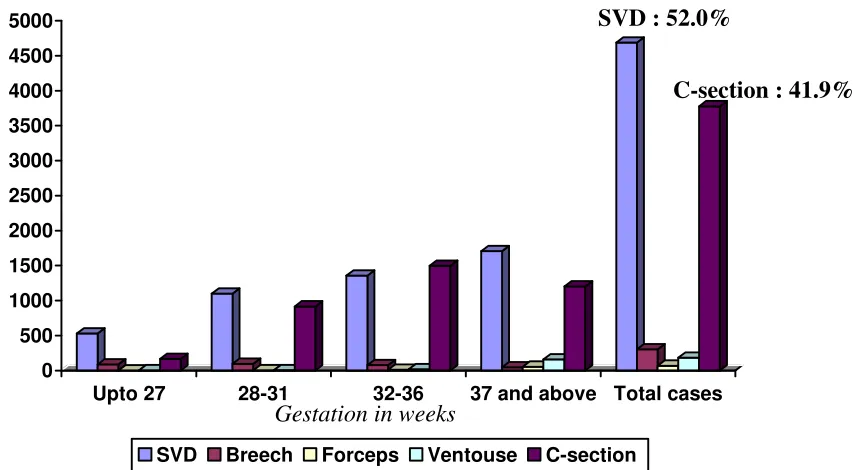
3.5.2 Mode of delivery
Fig 6. Mode of delivery according to gestation, 2005
The overall spontaneous vertex delivery rate was 52.0% (4688/9023) and caesarean section rate 41.9% (3777/9023). For very preterm (<32 weeks) babies the caesarean section rate was 37.2%. (1080/2901) Table14.
3.5.3 Condition of VLBW babies (BW <1500gm)
A ‘clinical risk index for babies’ (CRIB) score was performed based on six variables, derived from routine data recorded within 12 hours of birth. These variables have been
found to be independently associated with hospital deaths. (Appendix 1 CRF) and the
score may be used as a tool for assessing initial risk and comparing performance of
neonatal intensive care units.
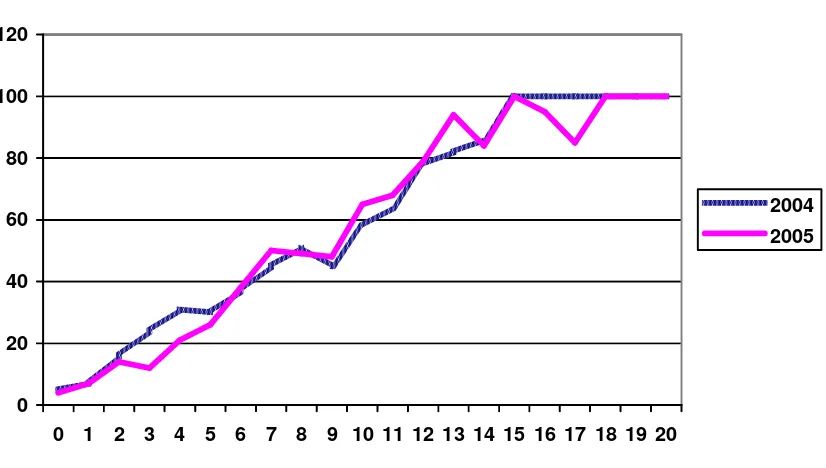
The mean CRIB score of babies with BW < 1500gm in both the 2004 and 2005 cohorts was 4 +/- 4 and of overall mortality was 27.8% in 2004 and 26.1% in 2005.
There was a strong correlation of CRIB score with mortality rates in both the years. (Fig 7). However centre comparison in CRIB score and performance shows some variation in outcomes among centres with similar scores (Table 15a).
No. of cases
0 500 1000 1500 2000 2500 3000 3500 4000 4500 5000
Upto 27 28-31 32-36 37 and above Total cases
SVD Breech Forceps Ventouse C-section Gestation in weeks
Fig 7. Mortality of VLBW babies according to CRIB score, 2004 & 2005
0 20 40 60 80 100 120
0 1 2 3 4 5 6 7 8 9 10 11 12 13 14 15 16 17 18 19 20
2004 2005
3.5.4 Need for Ventilatory Support (VS)
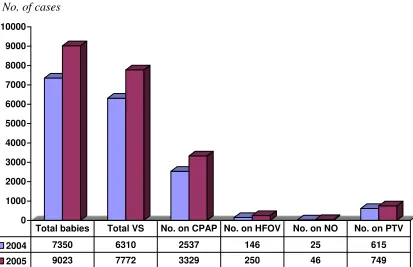
All newborn babies admitted to NICUs with a gestation of < 32 weeks at birth were included in this study. Of these 2298/2901 (79.2%) received ventilatory support which included Continuous Positive Airway Pressure (CPAP), Intermittent Mandatory Ventilation (IMV), IMV + Patient-Trigger Ventilation (PTV), High Frequency Positive Pressure Ventilation (HPPV), High Frequency Oscillatory Ventilation (HFOV) and Nitric Oxide (NO) as a single modality or in combination. More mature babies were included only if they needed VS or they had died for these babies (32 weeks and above) the VS rate was 5474/6122 i.e. 89.4% (Table 6).
The overall VS support rate was 86.1% (7772/9023).
CPAP alone as a mode of ventilatory support was given to 1500 (16.5%) of the babies, highest rate of use (about 23%) being among babies in gestational age group of 32-36 weeks and BW group of 1501-2500 gm (Tables 16 and 16a). Another 1829 of the total 9023 (20.3%) babies was supported with CPAP in combination of other VS modes, most commonly IMV.
HFOV is a specialized form of mechanical ventilation given at 8-15 hertz per second, in contrast to conventional IPPV which is given at about one breath or less per second.
Figure 8 shows the total usage of CPAP, HFOV, NO and PTV in all the babies for 2004 and 2005. Usage according to gestational age and BW groups are as shown in Tables 16,16a, 17, 17a, 18, 18a, 19 and 19a.
Mortality rate (%)
11
Fig 8. Use of specific ventilation support modes, 2004 & 2005
3.6 Morbidity
There is a high rate of morbidity amongst babies admitted to a level III NICU. These are principally associated with preterm births and complications arising in term babies necessitating ventilatory support.
The criteria for entry into study have selected those babies most at-risk of morbidity and mortality. The outcomes reported are those identifiable while the baby is in hospital, and many of these outcomes have also been shown to be predictors of later morbidity.
3.6.1 Respiratory distress
The adaptation to life outside the uterus can cause problems for both preterm and term babies. Respiratory distress is a major cause of morbidity and accounts for a large proportion of the use of resources in these sick babies.
Use of ventilatory support according to gestation has been alluded to above.
For preterm babies who survived, the duration of ventilatory support increased with decreasing gestational age. Duration of VS for term survivors however was slightly longer on average (Mean of 4+/- 8 days) compared to borderline preterm babies of 32-36 weeks gestation. (Mean of 3+/- 6 days) who survived. Table 20.
This is further illustrated in Fig 9.
0 1000 2000 3000 4000 5000 6000 7000 8000 9000 10000
2004 7350 6310 2537 146 25 615
2005 9023 7772 3329 250 46 749
Total babies Total VS No. on CPAP No. on HFOV No. on NO No. on PTV
Fig 9. Mean duration of VS for survivors according to gestational group, 2005
0 5 10 15 20 25 30 35
22-24 25-27 28-31 32-36 37 and above
Overall
Specific conditions in relation to respiratory morbidity
3.6.1.1 Respiratory distress syndrome
Respiratory distress syndrome (RDS) was the predominant respiratory diagnosis for babies in this study, being present in 4225 babies out of which 3861/4225 (91.4%)
needed ventilatory support. Table 21. Of babies with RDS 900 (21.3%) died.
3.6.1.2 Congenital pneumonia (C Pneu)
There were 1794 babies with congenital pneumonia of which 1744 (97.2%) required VS and 227 (12.7%) died. Table 21.
3.6.1.3 Meconium aspiration syndrome (MAS)
There were 683 babies with MAS, 677 (99.1%) required VS and 106 (15.5%) died. Table 21.
3.6.1.4 Hypoxic ischaemic encephalopathy
A total of 1011 babies had hypoxic ischaemic encephalopathy, 687 (68.0%) of which was mild/moderate and 324 (32%) severe. Nearly all (97-98%) required ventilation and 64% of severe HIE died (Table 21).
3.6.1.5 Neonatal encephalopathy (NE)
A smaller number of babies (74) had NE of ‘non-HIE aetiology’ and mortalilty in this group was 33.8% (Table 21).
3.6.1.6 Congenital anomalies (CA)
Only babies with congenital anomalies who required VS or had died were included in the study. Some with congenital anomalies were included based on other criteria of being very preterm or VLBW. These consisted of various abnormalities and many were heart defects.
13
The various types of congenital anomalies are as shown in Table 22. A total of 644 babies have some form of congenital anomalies. The most common CA was of the cardiovascular system (232 Acyanotic and 162 Cyanotic). This was followed by ‘Multiple congenital abnormalities’ (230).
3.6.1.7 Pneumothorax (PTX)
Pneumothorax often complicates mechanical ventilation and contributes to further morbidity and mortality of babies. (Fig10). A total of 532 (6.8%) babies who had ventilatory support developed pneumothorax out of whom 250 died (47.0%). (Table 23)
Fig 10. Mortality rate according to specific condition, 2005
3.6.1.8 Exogenous Surfactant
Exogenous surfactant is a treatment primarily for RDS and is given soon after birth via the endotracheal tube. Its efficacy was confirmed by a systematic review (Soll, 2003) and this treatment in the Malaysian CPG is recommended for babies who are ventilated for RDS. In this study of the 3861 babies who had RDS and required ventilatory support 2104 (54.5%) were treated with surfactant (Table 24).
Fig 11. Use of surfactant in RDS, 2005
Surfactant was given to 1020 (45%) babies within 2 hours of life and 1247 (55%) babies beyond 2 hours of life (Table 25).
Chronic lung disease in this study was captured as supplemental oxygen at Day 28 and also again at 36 weeks corrected age. Among ELBW survivors the rates of supplemental oxygen use at Day 28 and 36 weeks corrected gestation were 46.2% and 18.3% respectively. The rates were lower among bigger babies. Among babies who had died the rates of oxygen dependency were also lower (Table 26 and 26a).
3.6.2 Cerebral ultrasound scan (CUS)
Ultrasound imaging of the head of very preterm babies is performed to detect both intraventricular haemorrhage (IVH) and the formation of cysts and ventricular dilatation (hydrocephalus). An initial ultrasound is generally performed during the first week of life to detect signs of IVH. These IVHs are graded according to an internationally recognized method (Papile et al. 1978). Grade 1 and 2 are milder grades and generally do not affect outcome adversely while Grade 3 and 4 are not only associated with early morbidity and mortality but are also markers of possible later disability.
Of the 3322 babies with BW 501-1500 g, 2239 (67.4%) had CUS and 272 (12.1%) had Grade 3 or 4 IVH. Combined mortality rate from Grade 3 and 4 IVH was 60.3% (Table 27). The rates of cerebral ultrasound scanning for various birthweight groups are as shown in Table 28.
3.6.3 Eye Examinations
Eyes of very preterm babies are examined to monitor vascularisation which, if disrupted, can result in retinopathy of prematurity (ROP). The staging criteria for ROP were set by the International Committee for the classification of ROP (1984). Threshold disease ie Stage III plus or Stage IV usually necessitates laser or cryotherapy to preserve vision. Criteria that is being used for ROP screening in Malaysia are babies with gestation < 32 weeks or birth weights of <1250 gms. Other babies out of these BW and gestation criteria are also screened if significant risk is perceived by the doctors taking care of these babies. First screening is generally recommended at 4-6 weeks of life. This audit did not study the exact time screening was done for the survivors who satisfy the criteria for screening. However of these babies who survived, 1581 out of 2040 (77.5%) very preterm infants <
15
32 weeks, and 1072 out of 1220 (87.9%) babies of BW < 1251 gms had ROP screening. The rate of ROP screening for various gestation and BW groups are as shown in Tables 29 and 29a. It is to be noted that some very preterm or VLBW babies have been discharged early without an ROP screening. These babies were likely to be screened on an out-patient basis but this information was not captured in this study.
An overall total of 77 babies developed Grade 3, 4 or 5 ROP, 74 with BW 501-1500 gm and 3 in 1501-2500 gms (Table 30).
3.6.4 Necrotising enterocolitis
Necrotising enterocolitis (NEC) is a disease of the gut which usually affects the large intestine (colon). It is associated with a high morbidity and mortality in preterm babies and occasionally in term babies. It is generally associated with factors such as low gestational age, hypoxic events and infections.
An overall NEC rate of 4 (medical Rx) and 1 (surgical Rx) % i.e. 5 % was recorded. Extremely low birth weight (ELBW) infants had the highest incidence (11+2 % i.e. 13 %) of NEC ( Table 31).
3.6.5 Neonatal infections
Systemic infection is a potentially serious complication in sick babies. This audit categorises infections into 1) Presumed sepsis (Antibiotics initially given in the presence of obstetric risk factors but infection ruled out subsequently in the absence of clinical signs and laboratory findings. 2) Clinical sepsis (not confirmed by culture or serology) and 3) Confirmed sepsis ( i.e. culture proven bacterial infections)
Number of episodes of various infections are as shown in Fig 12.
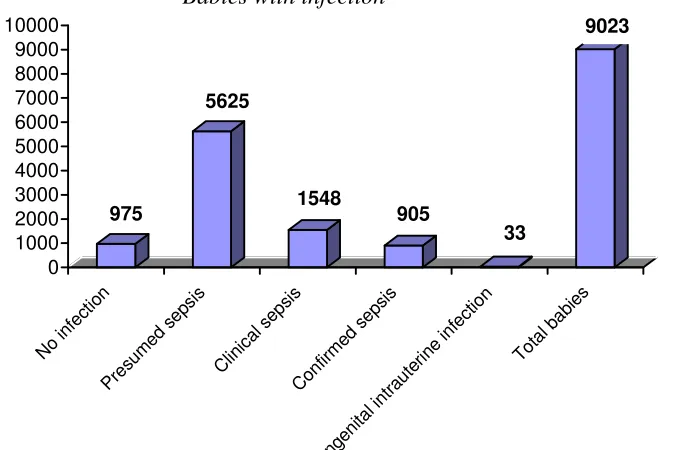
Fig 12. Frequency of various types of infections, 2005
A very high proportion of babies 5625 out of 9023 (62.3%) had presumed sepsis, and 1548 (17.2%) had clinical sepsis. The confirmed sepsis rate was 10.0%.
Each infant might have more than 1 type of infection and also >1 episode of a specific infection. i.e. infections in various categories are not mutually exclusive. Also the number of episodes of each specific infection was not captured in this study. For eg, if a baby had 2 episodes of infections due to coagulase negative staphylococcus (CoNs) it will be recorded as 1 infection while an episode of infection caused by Klebsiella sp and an episode caused by CoNs will be recorded as 2 infections.
Types of infecting organisms in bacterial blood-stream infections (BSI) are as shown in Fig 12a.
Fig 12a. Types of infecting organisms in confirmed sepsis, 2005 Types of organisms No of infections (%)
Group B Streptococcus 67
MRSA 129
CoNS 181
ESBL Organisms 143
Staphylococcus aureus 16
Klebsiella organisms 65
Pseudomonas organisms 59
Acinetobacter organisms 32
Other bacteria (miscellaneous) 278
Total bacterial sepsis 970
Fungal organisms 54
Miscellaneous organisms included Aeromonas sp, Citrobacter sp., Bulkhoderia sp,
Bacillus sp, Flavobacterium sp, H influenza, Moraxella sp Stenotrophomonas maltophilia,Escherichia coli, Enterobacter sp, Grp D strep and Enterococcus.
The most common was Coagulase-negative Staphlococcus (CoNS) which accounted for 181 (18.7%) of the 970 episodes of infections. Of the Gram-negative infections Klebsiella species was the most common accounting for 65 (6.7%) infections. There were 143 (14.7%) episodes of infection due to extended spectrum beta lactamase (ESBL) producing organisms.
17
3.7 Outcome
The overall survival at discharge of this high risk group of babies was 7013 (out of 9023) ie 77.7%. Table 33 and 33a. Survival is dependent on many factors including gestational age and birthweight. No babies of gestation 22 weeks and below and 2 babies of BW <500gms survived. Up to 31 weeks and up to 1500gms survival improved progressively with increasing gestation and BW. Babies who were 32 weeks and above and babies of BW > 1500gms were entered into the study only if they had required ventilatory support or had died, hence the survival were rather low in these more mature and bigger babies.
Less than half (41.1%) of babies of 26 weeks’ gestation survived and slightly more than half (58.5%) of babies with BW 801-900 grams survived (Tables 33 and 33a).
Survival of BW groups and gestation groups are as shown in Fig 13 and survival of VLBW and very preterm babies for 2004 and 2005 are as shown in Fig 14 and Fig 15.
Fig 13. Survival according to birthweight and gestational age group, 2005
0 20 40 60 80 100
BW group Gestational age group
* Babies with gestation of 32 weeks and above and birthweight > 1500g were in the study only if they were ventilated or had died, hence survival was not as high as it otherwise would have been.
% Survival
501-1000g 22-27 weeks
1001-1500g 28-31 weeks
1501-2500g 32-36 weeks
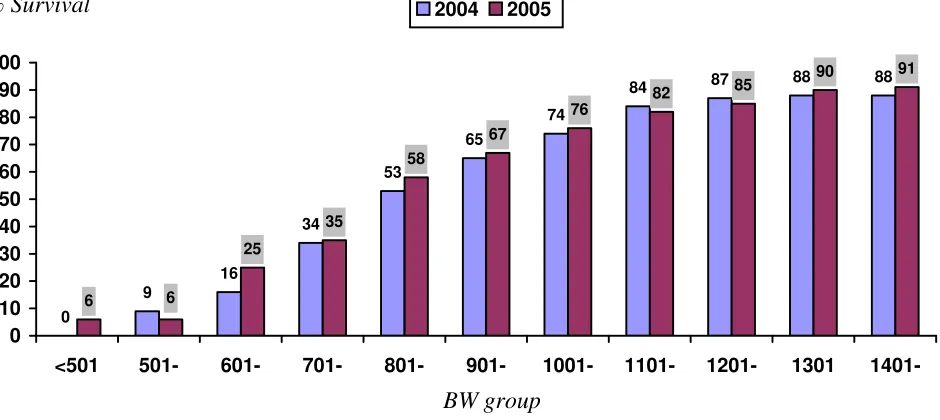
Fig 14. Survival according to BW group for VLBW babies (BW up to 1500g), 2004 & 200
Fig 15. Survival according to gestation for very preterm babies (gestation < 32 weeks) 2004 & 2005
<501 501- 601- 701- 801- 901- 1001- 1101- 1201- 1301
1401-2004 2005
% Survival
Gestation group in weeks % Survival
19
3.7.1 Perinatal and Neonatal Mortality Rates
These are important indicators of both obstetric and neonatal outcomes.
The births are obtained by records of all births in the hospitals of each neonatal unit and the mortality rates are calculated pertaining to that for inborn babies only.
Perinatal Mortality Rate =
No stillbirths + neonatal deaths < 7 days (BW 500gm and above
or gestation 22 weeks and above x 1000 TBs No total births (TBs)
Early Neonatal Mortality Rate
No neonatal deaths < 7 days (BW 500gm and above
or gestation 22 weeks and above x 1000 LBs No live births (LBs)
Neonatal Mortality Rate
No neonatal deaths < 28 days (BW 500gm and above
or gestation 22 weeks and above x 1000 LBs No live births (LBs)
Fig 16 shows the number of total births and neonatal deaths in all the centres in the study. The perinatal, early neonatal and neonatal mortality rates were calculated to be 14.3 per 1000 TBs, 4.8 and 6.2 per 1000 LBs respectively.
Fig. 16.Total births and neonatal deaths and mortality rates, 2005
Total Births 226878 No of Stillbirths 2063 No of Livebirths 224815
Inborn deaths <7 days (early neonatal deaths) 1142
Inborn deaths < 28 days (neonatal deaths) 1468
Stillbirth rate 9.1 per 1000 TBs
Perinatal Mortality Rate (PMR) 14.1 per 1000 TBs Early Neonatal Mortality Rate (Early NMR) 5.0 per 1000 TBs Neonatal Mortality Rate (NMR) 6.5 per 1000 LBs
3.7.2 Discharge
Babies are usually discharged straight home from the participating NICUs in the hospital. Some may have been discharged from a paediatric ward following extended care after NICU stay (e.g. babies with prolonged oxygen requirement) or rarely transferred elsewhere.
The duration of hospital stay is dependent on many factors especially gestational age and birth weight and whether babies survived.
For survivors the mean duration of hospital stay according to gestation and birthweight groups are as shown in Tables 34 and 34a. The overall duration of stay was 27 +/- 28 days and stay was progressively shorter with higher birthweight and gestational age groups. (Fig 17).
Fig 17. Mean duration of hospital stay for survivors according to gestational age group, 2005
Mean stay in days
0 20 40 60 80 100
22-24 25-27 28-31 32-36 >36 Overall
21
4. Tables
Table 1: Birth census in participating hospitals, 2005
Centre No. of Stillbirths No. of Live births Total Births
All centres 2063 224815 226878
2 114 10007 10121
3 68 9029 9097
4 54 6218 6272
5 119 10089 10208
6 142 12715 12857
7 135 15738 15873
8 104 10913 11017
9 69 9782 9851
10 40 6346 6386
11 26 4025 4051
12 41 5043 5084
13 43 5344 5387
14 35 5500 5535
15 73 6731 6804
16 90 10810 10900
17 58 8975 9033
18 17 3193 3210
19 35 5071 5106
20 66 6240 6306
21 46 4950 4996
22 85 8785 8870
23 136 14637 14773
24 90 11120 11210
25 86 6832 6918
26 221 19873 20094
27 45 5027 5072
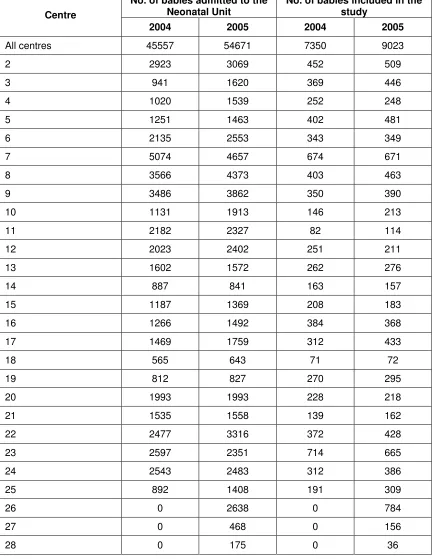
Table 2: Admissions to each Neonatal Unit, 2004 and 2005
No. of babies admitted to the Neonatal Unit
No. of babies included in the study
Centre
2004 2005 2004 2005
All centres 45557 54671 7350 9023
2 2923 3069 452 509
3 941 1620 369 446
4 1020 1539 252 248
5 1251 1463 402 481
6 2135 2553 343 349
7 5074 4657 674 671
8 3566 4373 403 463
9 3486 3862 350 390
10 1131 1913 146 213
11 2182 2327 82 114
12 2023 2402 251 211
13 1602 1572 262 276
14 887 841 163 157
15 1187 1369 208 183
16 1266 1492 384 368
17 1469 1759 312 433
18 565 643 71 72
19 812 827 270 295
20 1993 1993 228 218
21 1535 1558 139 162
22 2477 3316 372 428
23 2597 2351 714 665
24 2543 2483 312 386
25 892 1408 191 309
26 0 2638 0 784
27 0 468 0 156
23
Table 3: Case distribution according to gestational age group, 2004 and 2005
2004 2005
Table 4: Case distribution according to birth weight group, 2004 and 2005
2004 2005
Table 5: Growth status according to gestational age group, 2004 and 2005
Table 5a: Growth status according to birth weight group, 2004 and 2005
Table 6: Ventilatory support according to gestational age group, 2004 and 2005
Babies with Ventilatory support
Table 6a: Ventilatory support according to birthweight group, 2004 and 2005
25
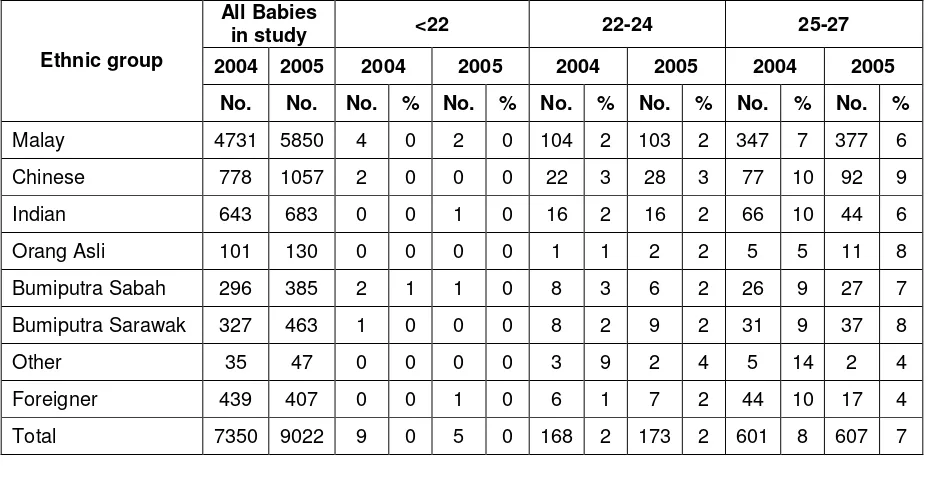
Table 7: Ethnicity according to gestational age group, (weeks) 2004 and 2005
All Babies
in study <22 22-24 25-27
2004 2005 2004 2005 2004 2005 2004 2005
Ethnic group
No. No. No. % No. % No. % No. % No. % No. %
Malay 4731 5850 4 0 2 0 104 2 103 2 347 7 377 6
Chinese 778 1057 2 0 0 0 22 3 28 3 77 10 92 9
Indian 643 683 0 0 1 0 16 2 16 2 66 10 44 6
Orang Asli 101 130 0 0 0 0 1 1 2 2 5 5 11 8
Bumiputra Sabah 296 385 2 1 1 0 8 3 6 2 26 9 27 7
Bumiputra Sarawak 327 463 1 0 0 0 8 2 9 2 31 9 37 8
Other 35 47 0 0 0 0 3 9 2 4 5 14 2 4
Foreigner 439 407 0 0 1 0 6 1 7 2 44 10 17 4
Total 7350 9022 9 0 5 0 168 2 173 2 601 8 607 7
28-31 32-36 37 and above
2004 2005 2004 2005 2004 2005
Ethnic group
No. % No. % No. % No. % No. % No. %
Malay 1093 23 1320 23 1471 31 1914 33 1712 36 2134 36
Chinese 215 28 265 25 252 32 334 32 210 27 338 32
Indian 155 24 147 22 223 35 246 36 183 28 229 34
Orang Asli 20 20 29 22 45 45 49 38 30 30 39 30
Bumiputra Sabah 78 26 92 24 95 32 114 30 87 29 145 38
Bumiputra Sarawak 88 27 152 33 111 34 155 33 88 27 110 24
Other 4 11 11 23 8 23 13 28 15 43 19 40
Foreigner 91 21 100 25 123 28 130 32 175 40 152 37
Table 7a: Ethnicity according to birthweight group, 2004 and 2005
All Babies in study BW 501 - 1000gm BW 1001 - 1500gm
2004 2005 2004 2005 2004 2005
Ethnic group
No. No. No. % No. % No. % No. %
Malay 4731 5850 561 12 677 12 1082 23 1373 23
Chinese 778 1057 99 13 155 15 217 28 265 25
Indian 643 683 112 17 101 15 180 28 168 25
Orang Asli 101 130 7 7 13 10 29 29 42 32
Bumiputra Sabah 296 385 39 13 42 11 102 34 107 28
Bumiputra Sarawak 327 463 41 13 62 13 117 36 153 33
Other 35 47 7 20 7 15 6 17 13 28
Foreigner 439 407 41 9 41 10 113 26 102 25
Total 7350 9022 907 12 1098 12 1846 25 2223 25
BW 1501 - 2500gm BW >2500 gm
2004 2005 2004 2005
Ethnic group
No. % No. % No. % No. %
Malay 1528 32 1877 32 1538 33 1899 32
Chinese 253 33 340 32 206 26 295 28
Indian 190 30 219 32 154 24 191 28
Orang Asli 45 45 50 38 19 19 25 19
Bumiputra Sabah 80 27 117 30 74 25 118 31
Bumiputra Sarawak 87 27 161 35 80 24 86 19
Other 10 29 11 23 12 34 16 34
Foreigner 122 28 124 30 161 37 140 34
27
Table 8: Mean maternal age according to gestational age group, 2004 and 2005
2004 2005
Table 8a: Mean maternal age according to birthweight group, 2004 and 2005
Table 9: Use of antenatal steroid according to gestational age group, 2004 and 2005
Table 9a: Use of antenatal steroid in inborn and outborn babies < 32 weeks gestation, 2005
Babies < 32 weeks given antenatal steroids
Centres Babies < 32 weeks
No. %
All babies 2901 1645 57
Inborn 2426 1522 63
Outborn 475 123 26
Table 10: Multiplicity of births according to gestational age group, 2004 and 2005
Singletons Twins
All Babies in
study 2004 2005 2004 2005
Gestational age group
(weeks)
2004 2005 No. % No. % No. % No. %
<22 9 5 9 100 5 100 0 0 0 0
22-24 168 173 144 86 151 87 19 11 22 13
25-27 601 607 504 84 489 81 90 15 111 18
28-31 1744 2116 1488 85 1829 86 234 13 266 13
32-36 2328 2956 2096 90 2667 90 212 9 275 9
>=37 2500 3166 2455 98 3102 98 44 2 63 2
Total 7350 9023 6696 91 8243 91 599 8 737 8
Triplets Others
2004 2005 2004 2005
Gestational age group
(weeks)
No. % No. % No. % No. %
<22 0 0 0 0 0 0 0 0
22-24 5 3 0 0 0 0 0 0
25-27 7 1 7 1 0 0 0 0
28-31 22 1 20 1 0 0 1 0
32-36 19 1 12 0 1 0 1 0
>=37 1 0 0 0 0 0 1 0
29
Table 10a: Multiplicity of births according to birthweight group, 2004 and 2005
Singletons Twins
All Babies in
study 2004 2005 2004 2005
Birthweight group (grams)
2004 2005 No. % No. % No. % No. %
<=500 38 32 28 74 24 75 10 26 7 22
501-1000 907 1098 754 83 911 83 137 15 178 16
1001-1500 1846 2224 1583 86 1901 85 237 13 299 13
1501-2500 2315 2899 2104 91 2661 92 198 9 230 8
>2500 2244 2770 2227 99 2746 99 17 1 23 1
Total 7350 9023 6696 91 8243 91 599 8 737 8
Triplets Others
2004 2005 2004 2005
Birthweight group (grams)
No. % No. % No. % No. %
<=500 0 0 1 3 0 0 0 0
501-1000 16 2 8 1 0 0 1 0
1001-1500 25 1 22 1 1 0 1 0
1501-2500 13 1 8 0 0 0 0 0
>2500 0 0 0 0 0 0 1 0