S
OCIAL
P
ROTECTION
P
OLICY
P
APERS
Paper 12
Social protection global policy
trends 2010
-
2015
From fiscal consolidation to
expanding social protection:
Key to crisis recovery, inclusive
development and social justice
Social Protection Department
Copyright © International Labour Organization 2014 First published 2014
Publications of the International Labour Office enjoy copyright under Protocol 2 of the Universal Copyright Convention. Nevertheless, short excerpts from them may be reproduced without authorization, on condition that the source is indicated. For rights of reproduction or translation, application should be made to ILO Publications (Rights and Permissions), International Labour Office, CH-1211 Geneva 22, Switzerland, or by email: [email protected]. The International Labour Office welcomes such applications.
Libraries, institutions and other users registered with reproduction rights organizations may make copies in accordance with the licences issued to them for this purpose. Visit www.ifrro.org to find the reproduction rights organization in your country.
ILO Cataloguing in Publication Data
Social protection global policy trends 2010-2015: from fiscal consolidation to expanding social protection: key to crisis recovery, inclusive development and social justice / International Labour Office. - Geneva: ILO, 2014
ISBN: 9789221292357; 9789221292364 (web pdf)
International Labour Office
social protection / economic recovery / economic recession / economic disparity / fiscal policy / national planning / developed countries / developing countries
02.03.1
The designations employed in ILO publications, which are in conformity with United Nations practice, and the presentation of material therein do not imply the expression of any opinion whatsoever on the part of the International Labour Office concerning the legal status of any country, area or territory or of its authorities, or concerning the delimitation of its frontiers.
The responsibility for opinions expressed in signed articles, studies and other contributions rests solely with their authors, and publication does not constitute an endorsement by the International Labour Office of the opinions expressed in them.
Reference to names of firms and commercial products and processes does not imply their endorsement by the International Labour Office, and any failure to mention a particular firm, commercial product or process is not a sign of disapproval.
ILO publications and electronic products can be obtained through major booksellers or ILO local offices in many countries, or direct from ILO Publications, International Labour Office, CH-1211 Geneva 22, Switzerland. Catalogues or lists of new publications are available free of charge from the above address, or by email: [email protected]
Visit our web site: www.ilo.org/publns
The editor of the series is the Director of the Social Protection Department, ILO. For more information on the series, or to submit a paper, please contact:
Isabel Ortiz, Director Social Protection Department International Labour Organization
4 Route des Morillons
CH-1211 Geneva 22 Switzerland
Tel. +41.22.799.6226 • Fax:+41.22.799.79.62
Abstract
This policy paper: (i) examines IMF government spending projections for 181 countries, identifying two main phases: fiscal expansion (2008-2009) and fiscal consolidation (2010 onwards); (ii) presents the main adjustment measures considered since 2010 and their adverse socio-economic impacts in both high income and developing countries; (iii) analyses divergent trends in social protection across regions, focusing on the positive expansion of social protection floors in a majority of developing countries; (iv) reviews potential areas of fiscal space for the necessary extension of social protection systems; and (v) presents the developmental arguments to invest in social protection in pursuit of crisis recovery, inclusive development and social justice.
JEL Classification: E62, I30, I38, J18, J80, H53, H55, H51, O2
Table of Contents
Preface ... xi
Acknowledgements ... xiii
Executive Summary ... xv
1. Expanding social protection: Key to crisis recovery, inclusive development and social justice ... 1
2. Grappling with recession and slow growth: Social protection and the global crisis ... 1
2.1 Social protection in the first phase of the global crisis: Expansion and fiscal stimulus (2008–09) ... 1
2.2 Social protection in the second phase of the global crisis: Fiscal consolidation (2010 and after) ... 2
2.3 Divergent trends across countries ... 9
3. High-income countries: Fiscal consolidation and its effects ... 12
3.1 Overview: Prioritizing financial sector recovery over social protection ... 12
3.2 First phase of the crisis: Scaling up social protection to sustain households’ disposable income and domestic demand (2008–09) ... 16
3.3 Second phase of the global crisis: Fiscal consolidation, 2010 onwards ... 19
Unemployment benefits ... 20
Health ... 20
Social benefits ... 20
Pensions ... 21
Erosion of the European social model ... 22
3.4 Adequate transfers, taxes and social dialogue: Key elements of a socially responsive recovery ... 25
4. Middle-income countries: Inclusive growth through social protection... 28
4.1 Significant extension of social protection coverage ... 28
4.2 Towards more inclusive growth... 30
5. Low-income countries: Beyond safety nets, towards social protection floor guarantees ... 33
5.1 Against the odds: Extending social protection coverage in low-income countries ... 33
5.2 Expanding social protection using proceeds from fiscal consolidation and adjustment measures ... 35
5.3 Beyond safety nets: Towards national social protection floors ... 37
6. Fiscal space for social protection floors ... 38
6.1 Option 1: Reallocating current public expenditures ... 39
6.3 Option 3: Extending social security contributions ... 41
6.4 Option 4: Borrowing or restructuring existing debt ... 41
6.5 Option 5: Curtailing illicit financial flows ... 42
6.6 Option 6: Drawing on increased aid and transfers ... 42
6.7 Option 7: Using fiscal and central bank foreign exchange reserves ... 42
6.8 Option 8: Adopting a more accommodating macroeconomic framework ... 43
7. Why social protection floors are key to recovery and must be part of the post-2015 development agenda ... 44
7.1 Social protection floors reduce poverty and inequalities ... 44
Social protection reduces poverty and social exclusion ... 44
Social protection reduces income inequality ... 45
Social protection contributes to human capital development, reduces hunger and contributes to food security ... 46
Social protection supports positive education outcomes ... 46
Social protection supports positive health outcomes ... 47
7.2 Social protection floors promote decent employment and inclusive growth ... 47
Social protection promotes employment ... 47
Social protection promotes economic growth ... 48
Social protection supports social peace, political stability and state-building ... 49
7.3 Leaving no one behind: Social protection floors to change people’s lives by 2030 ... 50
Bibliography ... 51
Annexes Annex I ... 63
List of tables Table 1. Main adjustment measures by region, 2010-13 (number of countries) ... 6
Table 2. Selected fiscal consolidation measures recently adopted or under discussion in high-income countries ... 14
Table 3. Selected recent examples of the extension of social protection in middle-income countries ... 29
Table 4. Selected recent examples of the extension of social protection in low-income countries ... 34
Table 5. Fiscal space strategies: Country examples ... 44
Table A.2 Real growth in 181 countries, 2005 - 2015 (as percentage, in billions of local
currency over average consumer prices) ... 70
Table A.3 Overview of national social security systems ... 77
List of figures
Figure 1. Social protection in stimulus packages, 2009-09 (percentage of total announced
amount) ... 2
Figure 2a. Number of countries contracting public expenditures (year on year), 2008-16, in
percentage of GDP ... 3
Figure 2b. Number of countries contracting public expenditures (year on year) 2008-16, in
real terms ... 3
Figure 3a. Excessive fiscal contraction: Decline in total government expenditure relative to
GDP (2013-15 average over 2005-07 average, percentages) ... 5
Figure 3b. Excessive fiscal contraction: Decline in real government expenditure (2013-15
average over 2005-07 average, percentages) ... 5
Figure 4. Main adjustment measures in 174 countries, 2010-13 (by policy option) ... 7
Figure 5. Public social expenditure as a percentage of GDP, real GDP and real social
protection expenditure (index 100=2007): (a) world; (b) high-income countries; (c) middle-income countries; (d) low-income countries ... 10
Figure 6. Trends in government and public social expenditure per capita (in constant prices): (a) 2007-09; (b) 2009-11 ... 11
Figure 7. Expansion of social protection in middle- and low-income countries: Selected
examples of new and expanded programmes, 2000-13 ... 11
Figure 8. Support for the financial sector, fiscal stimulus packages and public debt increases, selected HICs, 2008-10 (US$ billions ... 12
Figure 9. Increase in the proportion of the population at risk of poverty in 18 European
countries between 2008 and 2012 ... 13
Figure 10. Distribution of expenditure-based versus revenue-based fiscal consolidation plans
in 30 OECD countries, 2009-15 ... 14
Figure 11. The social and economic risks of fiscal consolidation ... 16
Figure 12. Trends in real per capita public social protection expenditure, GDP, consumption and unemployment, 2007-2012/13: (a) United States; (b) Japan; (c) France; (d)
Figure 13. Contributions of various components to the growth of nominal gross disposable
income of household, European Area 17 countries, 2000-12 (percentages) ... 18
Figure 14. Annual changes in disposable income, 2007-10, by income component, selected
OECD countries ... 19
Figure 15. Reduction in gross theoretical replacement rates of statutory pensions for average wage workers retiring at age 65 after 40 years of contributions, 2010-50
(percentage points of theoretical average wage) ... 22
Figure 16. Real public social protection and real household final consumption expenditure, unemployment and real GDP: Recent developments in the four EU countries under economic adjustment programmes, 2008–13: (a) Ireland; (b) Greece; (c) Portugal;
(d) Cyprus ... 24
Figure 17. Poverty rates in OECD countries before and after taxes and social protection
transfers, latest available year ... 26
Figure 18. Increase in public social protection expenditure, selected middle-income countries, 2000 to latest year (percentage of GDP ... 30
Figure 19. Increase in public social protection expenditure, selected low-income countries,
2000 to latest year (percentage of GDP) ... 34
Figure 20. Total government expenditures in selected countries, 2013 (percentage of GDP) ... 39
Figure 21. Illicit financial flows (IFF) versus official development assistance (ODA), 2000-09 (current US$ billions) ... 42
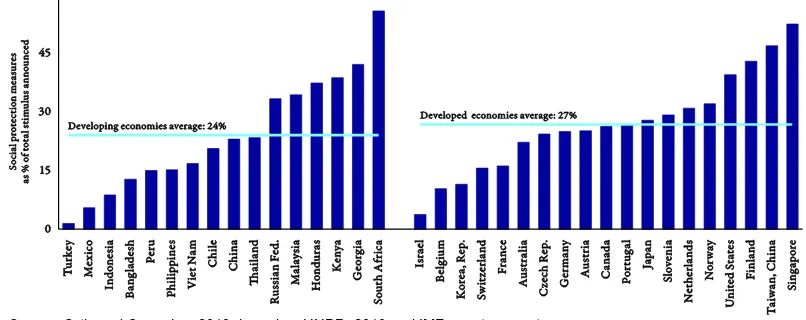
Figure 22. Public social expenditure (percentage of GDP) and proportion of the population in
poverty ... 45
Figure 23. Public social expenditure (percentage of GDP) and income equality (Gini
coefficient), latest available year ... 46
Figure 24. Schematic representation of some of the positive impacts of the extension of social protection on inclusive growth (short term) ... 48
Figure 25. Schematic representation of some of the positive impacts of the extension of social protection on inclusive growth (longer term) ... 49
List of boxes
Box 1. From fiscal stimulus to fiscal consolidation – Implications for social protection ... 6
Box 2. Using sovereign pension reserve funds to fund bailouts... 15
Box 4. The role of social protection in the Brazilian model of domestic demand-led growth ... 31
Box 5. Strengthening domestic demand-led growth in China through increased wages and an expansion of social protection benefits ... 32
Box 6. Mozambique: Using a fuel subsidy to extend social protection ... 36
Box 7. Financing social protection from subsidy removal ... 40
Box 8. Taxing mineral and natural resource extraction to generate fiscal space for social
protection ... 40
Preface
The global financial and economic crisis has forcefully underlined the importance of social security as an economic and social necessity, as set out in the ILO Social Protection Floors Recommendation, 2012 (No. 202). While social protection played a strong role in the expansionary response immediately after the onset of the global crisis, many governments embarked on fiscal consolidation and premature contraction of expenditures from 2010 onwards, despite an urgent need of public support among vulnerable populations. The cost of adjustment was passed on to populations, who have been coping with fewer jobs and lower income for more than five years. Depressed household income levels are leading to lower domestic consumption and lower demand, slowing down recovery.
At the same time, many middle-income countries, such as Brazil or China, have boldly expanded their social protection systems, thereby contributing to their domestic demand-led growth strategies. Some lower-income countries have extended social protection mainly through temporary safety nets with very low benefit levels. However, in many of these countries debates are under way on building social protection floors as part of comprehensive social protection systems.
This policy paper is based on the research conducted for the ILO’s World Social
Protection Report 2014/15. It focuses specifically on fiscal policies and trends in social protection. Trends in specific social protection policies such as child benefits, pensions, unemployment support or universal health protection, are addressed in other policy papers in this series. This and the related papers reflect the principles of the ILO Social Protection Floors Recommendation, 2012 (No. 202) on the extension of social security, agreed by 185 countries and further endorsed by G20 leaders and the United Nations.
Isabel Ortiz Director
Acknowledgements
As a product of the research conducted for the ILO’s World Social Protection Report
2014/15, this policy paper was drafted by a team supervised by the Director of the ILO Social Protection Department, Isabel Ortiz, consisting of Krzysztof Hagemejer, formerly Chief of the Social Policy, Governance and Standards Branch; Anne Drouin, Chief of the Public Finance, Actuarial and Statistics Services Branch; Florence Bonnet, Social Security Statistics Coordinator; Christina Behrendt, Senior Social Protection Policy Specialist; Emmanuelle St-Pierre Guilbault, Legal Specialist; Xenia Scheil-Adlung, Coordinator Social Health Protection; and John Woodall, formerly Coordinator Pension Policy.
Substantial inputs to the report were received from Matthew Cummins, Social and
Economic Policy Specialist at the United Nations Children’s Fund (UNICEF), and several
colleagues in the ILO Social Protection Department, including James Canonge, Social Protection Officer; Fabio Durán Valverde, Senior Specialist Social Security; Aidi Hu, Coordinator Country Operations, Asia; Cristina Lloret, Junior Social Security Actuary; Valérie Schmitt, Chief, Social Policy, Governance and Standards Branch; Helmut Schwarzer, Senior Social Security Specialist for the Americas and the Caribbean; Maya Stern-Plaza, Junior Legal Officer; Victoire Umuhire, Junior Legal Officer; Veronika Wodsak, Technical Officer Social Security; Hiroshi Yamabana, Social Security Actuary; and Katharina Diekmann, Zita Herman, Vinu Parakkal Menon, Jahnavi Sen and Nicholas Teasdale-Boivin.
The report benefited from comments from colleagues in other ILO technical departments and field offices, including Manuela Tomei, Director of the Conditions of Work and Equality Department; Michelle Leighton, Chief of the Labour Migration Branch; Philippe Marcadent, Chief of the Inclusive Labour Markets, Labour Relations and Working Conditions Branch; Shauna Olney, Chief of the Gender, Equality and Diversity Branch; Alice Ouedraogo, Chief of the HIV/AIDS and the World of Work Branch; Laura Addati, Maternity Protection and Work–Family Specialist; Janine Berg, Senior Development Economist; Fabio Bertranou, Senior Labour Market and Social Protection Specialist, ILO Buenos Aires; Theopiste Butare, Senior Social Security Technical Specialist, ILO Yaoundé; Pablo Casalí, Senior Social Security Specialist, ILO Lima; Luis Casanova, National Officer, ILO Buenos Aires; Raphael Crowe, Senior Gender Specialist; Adrienne Cruz, Senior Gender Specialist; Loveleen De, Social Security Consultant, ILO Bangkok; Juan De Laiglesia, Economist and Labour Market Specialist; Maria Gallotti, Specialist in Migration Policies; Youcef Ghellab, Head Social Dialogue and Tripartism
Unit; Frank Hoffer, Senior Research Officer, ILO Bureau for Workers’ Activities; Lee -Nah Hsu, Technical Specialist on HIV/AIDS; Kroum Markov, Legal Specialist; Barbara Murray, Senior Disability Specialist; Susan Maybud, Senior Gender Specialist; Seil Oh, Social Security Officer, ILO Bangkok; Céline Peyron Bista, Chief Technical Adviser, ILO Bangkok; Markus Ruck, Senior Social Security Specialist, ILO New Delhi; Catherine Saget, Senior Economist; Francis Sanzouango, Employer Relations Specialist, Bureau for
Employers’ Activities; Sinta Satriana, Social Security Consultant, ILO Bangkok; Stefan
Trömel, Senior Disability Specialist; Catherine Vaillancourt-Laflamme, Chief Technical
Adviser, ILO Manila. Comments and guidance from the ILO’s Deputy Director-General
for Policy, Sandra Polaski, are especially appreciated.
Executive Summary
This policy paper: (i) examines IMF government spending projections for 181 countries, identifying two main phases: fiscal expansion (2008-2009) and fiscal consolidation (2010 onwards); (ii) presents the main adjustment measures considered since 2010 and their adverse socio-economic impacts in both high income and developing countries; (iii) analyses divergent trends in social protection across regions, focusing on the positive expansion of social protection floors in a majority of developing countries; (iv) reviews potential areas of fiscal space for the necessary extension of social protection systems; and (v) presents the developmental arguments to invest in social protection in pursuit of crisis recovery, inclusive development and social justice.
The global financial and economic crisis has forcefully underlined the importance of social security as an economic and social necessity, as set out in the ILO Social Protection Floors Recommendation (2012), No. 202.
In the first phase of the crisis (2008–09), social protection played a strong role in the expansionary response. About 50 high- and middle-income countries announced fiscal stimulus packages totalling US$2.4 trillion, of which approximately a quarter was invested in counter-cyclical social protection measures.
In the second phase of the crisis (2010 onwards), many governments embarked on fiscal consolidation and premature contraction of expenditure, despite an urgent need of public support among vulnerable populations. In 2015, the scope of public expenditure adjustment is expected to intensify significantly. According to IMF projections, 120 countries, of which 86 are developing, will be contracting expenditures in terms of GDP. The scope of adjustments will then steadily increase to affect 131 countries in 2016. Further, a fifth of countries are undergoing excessive fiscal contraction, defined as cutting public expenditures below pre-crisis levels.
Contrary to public perception, fiscal consolidation measures are not limited to Europe; many developing countries have adopted adjustment measures, including the elimination or reduction of food and fuel subsidies; cuts or caps on wages, including for health and social care workers; more narrow targeting of social protection benefits; and reforms of pension and health care systems. Many governments are also considering revenue-side measures, for example increasing consumption taxes such as value added tax (VAT) on basic products that are consumed by poor households.
In developing countries, some of the proceeds of these adjustments, e.g. from the elimination of subsidies, have been used to design narrowly targeted safety nets, as a compensatory mechanism to the poorest. However, given the large number of vulnerable low-income households in developing countries, more efforts are necessary to meet the social protection needs of the population.
Of particular significance are the divergent trends in richer and poorer countries: while many high-income countries are contracting their social security systems, many developing countries are expanding them.years. Depressed household income levels are leading to lower domestic consumption and lower demand, slowing down recovery. The achievements of the European social model, which dramatically reduced poverty and promoted prosperity and social cohesion in the period following the Second World War, have been eroded by short-term adjustment reforms.
Most middle-income countries are boldly expanding their social protection systems, thereby contributing to their domestic demand-led growth strategies: this presents a powerful development lesson. China, for instance, has achieved nearly universal coverage of pensions and increased wages; Brazil accelerated the expansion of social protection coverage and minimum wages since 2009. Continued commitment is necessary to address persistent inequalities.
Some lower-income countries have extended social protection mainly through narrowly targeted temporary safety nets with very low benefit levels. However, in many of these countries debates are underway on building social protection floors as part of comprehensive social protection systems. There are options available to governments to expand fiscal space for social protection even in the poorest countries.1.
Expanding social protection:
Key to crisis recovery, inclusive
development and social justice
Social protection systems have undergone profound changes in recent years. While many emerging economies have taken bold measures to expand social protection to promote economic and social development, other parts of the world, including many high-income countries, have been grappling with fiscal consolidation1
and adjusting their social protection systems to make for cost savings (ILO, 2014a). These divergent policy trends and their implications are the focus of this policy paper. In particular, the report identifies the rationale and impact of, respectively, fiscal consolidation measures and expansionary policies on recovery efforts in high-, middle- and low-income countries. The report concludes by setting out the positive developmental impacts of social protection in the drive to promote sustainable and inclusive growth, to build human capital, and to achieve political stability, together constituting a set of powerful reasons why social protection must be part of the post-2015 development agenda.
Social dialogue plays a key role in finding balanced solutions to economic and social challenges, a reason why this report is launched at the international meeting of the International Association of Economic and Social Councils and Similar Institutions (AICESIS) in Seoul, Republic of Korea, on Promoting Social Protection Floors for All through Social Dialogue. While in some countries, policy responses to the global crisis have been shaped though social dialogue, in many other countries this has not been the case. Public policy decisions have often been taken behind closed doors, as technocratic solutions with limited or no consultation, potentially resulting in lack of public ownership, civil unrest and adverse socio-economic impacts. National tripartite dialogue, with government, employers and workers as well as academics, civil society and others, is fundamental to adopt optimal public policies. Social dialogue is needed to ensure social protection systems and a socially-responsible recovery aimed at achieving inclusive growth and social justice.
2. Grappling with recession and slow growth:
Social protection and the global crisis
2.1 Social protection in the first phase of the global crisis:
Expansion and fiscal stimulus (2008
–
09)
As the crisis bit in 2008–09, the vast majority of governments in countries immediately affected scaled up public social expenditure in order to sustain growth and protect their populations from the adverse effects of the food, fuel and financial shocks. A total of 145 countries ramped up public expenditure during this first phase of the crisis. At least 48 countries announced fiscal stimulus packages totalling US$2.4 trillion, of which approximately a quarter was invested in social protection measures (figure 1). An ILO survey of fiscal stimulus plans in 54 developing and developed countries (ILO, 2009b) indicated that 54 per cent of governments boosted cash transfers, 44 per cent
1In this report, “fiscal consolidation” refers to the wide array of adjustment measures adopted to
supported old-age pensions and 37 per cent increased access to health benefits. Additionally, 16 per cent of governments introduced food subsidies.
Social protection played a key role in attenuating the immediate negative effects of the crisis on households in this first phase. One of the key lessons from these initial crisis responses is that social protection can function as an automatic stabilizer most effectively if the relevant schemes and programmes are implemented before crisis conditions take hold (ILO, 2010b; ILO and World Bank, 2012; Bonnet, Saget and Weber, 2012; Behrendt et al., 2011). In the absence of such social protection measures, the effect of the crisis on
[image:18.595.126.529.235.395.2]unemployment, households’ disposable income and poverty rates in 2009–10 would have been much higher (ILO, 2011).
Figure 1. Social protection in stimulus packages, 2009-09 (percentage of total announced amount)
Source: Ortiz and Cummins, 2013, based on UNDP, 2010 and IMF country reports.
Link: http://www.social-protection.org/gimi/gess/RessourceDownload.action?ressource.ressourceId=43337.
2.2 Social protection in the second phase of the global crisis:
Fiscal consolidation (2010 and after)
These Keynesian counter-cyclical measures were short-lived. As the crisis moved into a second phase from 2010 onwards, rising concerns over sovereign debt levels and fiscal deficits led governments to abandon fiscal stimuli and introduce fiscal consolidation
measures. According to the IMF’s projections of government expenditure in the World Economic Outlook database (October 2014), 106 of the 181 countries for which data were
available moved to contract public spending in 2010.
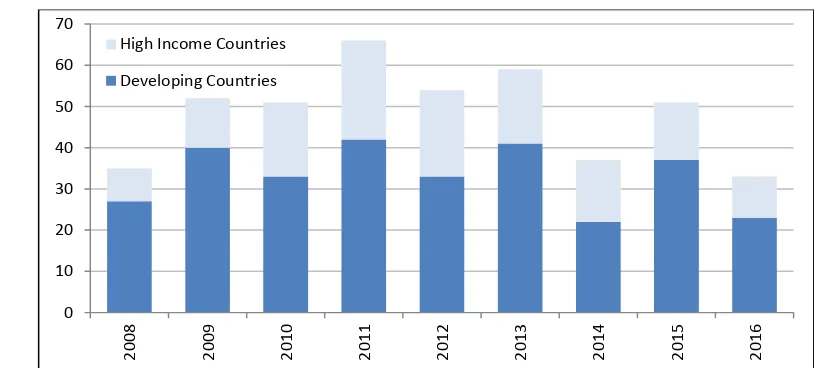
In 2015, the scope of public expenditure contraction is expected to intensify significantly, with impacts in 120 countries, and then steadily increase to affect 131 countries in 2016 (figure 2a).2
It is important to note that this trend is observed across countries with different levels of income. Specifically, during 2010 public expenditure contraction affected 13 low-income, 28 lower-middle-income, 33 upper-middle-income and 32 high-income countries. In 2015, according to the latest IMF fiscal projections, as
2
many as 86 developing and 34 high-income countries are expected to contract public expenditures.3
Figure 2a. Number of countries contracting public expenditures (year on year), 2008-16, in percentage of GDP
Source: ILO calculations based on the IMF’s World Economic Outlook database (Oct. 2014).
In terms of real spending growth, a more conservative measure, IMF fiscal data reveal a peak contraction in 2011, with more than 65 countries contracting, but thereafter an easing from 2012 onwards (figure 2b). Again, the incidence is larger in developing countries than in high-income economies.
Figure 2b. Number of countries contracting public expenditures (year on year) 2008-16, in real terms
Source: ILO calculations based on the IMF’s World Economic Outlook database (Oct. 2014).
Compared with the pre-crisis period, an alarming number of countries in 2013–15 appear to be undergoing excessive fiscal contraction, defined as cutting public expenditures
3
For a more detailed analysis of public expenditure trends worldwide between 2005 and 2015, see Ortiz and Cummins, 2013.
0 20 40 60 80 100 120 140
2008 2009 2010 2011 2012 2013 2014 2015 2016
High-income Countries
Developing Countries
0 10 20 30 40 50 60 70
2008 2009 2010 2011 2012 2013 2014 2015 2016
High Income Countries
[image:19.595.111.518.405.589.2]below pre-crisis levels.4
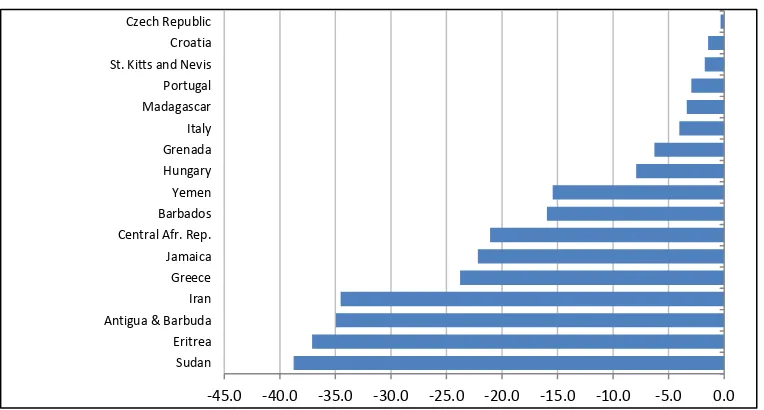
In terms of GDP, analysis of expenditure projections reveals that in 34 countries (about one-fifth of the total), governments may be cutting their budgets excessively during 2013–15 (figure 3a). These include countries with significant development challenges, such as Eritrea, Sudan, Yemen, Iran, Iraq, Bhutan, Sri Lanka, Ethiopia, Guyana, Tuvalu, Nigeria, Madagascar, Jamaica, Guinea-Bissau, Guatemala, Burundi, Grenada and Botswana, among others. More than half (18) of these countries are expected to reduce spending by more than 3.0 per cent of GDP, on average, during this latest phase of the crisis when compared to expenditure levels during the pre-crisis period. In real terms, 17 governments are forecast to have fiscal envelopes in 2013–15 that are smaller, on average, than those of 2005–07 (figure 3b). This is a dramatic situation, especially for developing countries where social spending is already very limited to start with.
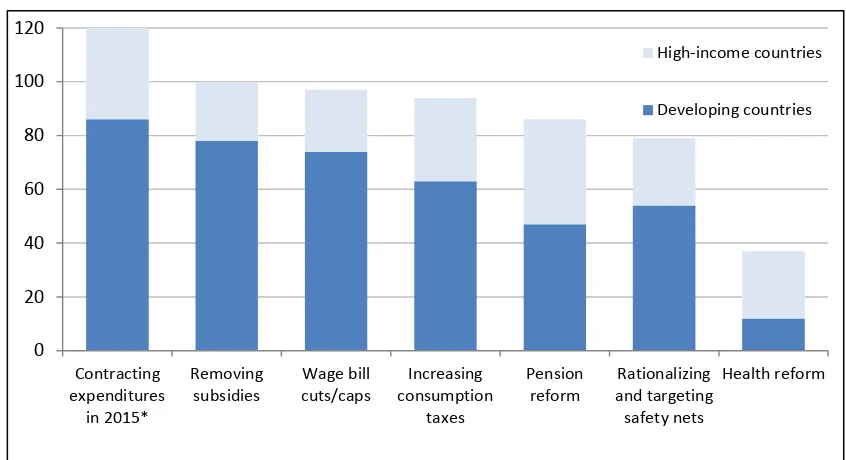
How have governments been adjusting public expenditures since 2010? A review of 314 IMF country reports in 174 countries published between January 2010 and February 2013 (Ortiz and Cummins, 2013) indicates that governments are considering a combination of six main policy options (table 1 and figure 4), which relate strongly to the social protection of populations (see also box 1): phasing out or eliminating subsidies; cutting or capping wage bills; increasing taxes on consumption; undertaking pension reforms aimed at reducing the costs of pension systems; rationalizing and more narrowly targeting social assistance and other social protection benefits; and introducing reforms to health-care systems aimed at cost containment. These fiscal consolidation strategies are not limited to Europe, and, in fact, are prevalent in developing countries. Many governments are also considering revenue-side measures that can have adverse impacts on vulnerable populations, mainly the introduction or extension of consumption taxes such as VAT, on basic products that are disproportionately consumed by poor households. All of the different adjustment approaches pose potentially serious consequences for vulnerable populations, as summarized below.
4
Figure 3a. Excessive fiscal contraction: Decline in total government expenditure relative to GDP (2013-15 average over 2005-07 average, percentages)
Note: Excessive fiscal consolidation is defined here as a cut of expenditures below pre-crisis levels. Source: ILO calculations based on IMF, World Economic Outlook database (Oct. 2014).
Figure 3b. Excessive fiscal contraction: Decline in real government expenditure (2013-15 average over 2005-07 average, percentages)
Note: Excessive fiscal consolidation is defined here as a cut of expenditures below pre-crisis levels. Source: ILO calculations based on IMF, World Economic Outlook database (Oct. 2014).
-18.0 -16.0 -14.0 -12.0 -10.0 -8.0 -6.0 -4.0 -2.0 0.0
Eritrea Sudan Yemen Antigua & Barbuda Iran Seychelles Iraq São Tomé & Prín. Bhutan Sri Lanka Israel Ethiopia Guyana Tuvalu Nigeria Madagascar Jamaica Guinea-Bissau Lebanon Belarus St. Kitts and Nevis Poland Switzerland Jordan Kazakhstan Germany Guatemala Taiwan Burundi Grenada Sweden Hungary Latvia Botswana
-45.0 -40.0 -35.0 -30.0 -25.0 -20.0 -15.0 -10.0 -5.0 0.0
[image:21.595.130.512.504.709.2]Box 1
From fiscal stimulus to fiscal consolidation – Implications for social protection
In 2008–09 there was a global counter-cyclical policy consensus, whereby countries coordinated policies to combat the negative social and economic impacts of the crisis with the aim of maintaining demand and
growth. The IMF spelled out the need for global fiscal stimulus: “In normal times, the Fund would indeed be
recommending to many countries that they reduce their budget deficit and their public debt. But these are not normal times if no fiscal stimulus is implemented, then demand may continue to fall what is needed is a commitment by governments that they will follow whatever policies it takes to avoid a repeat of a Great
Depression scenario” (Blanchard, 2008).
Early in 2010, IMF advice underwent a major change (later to be supported by the OECD), and ultimately also by the G20. Two IMF Board papers approved in February 2010 – Exiting from crisis intervention policies and Strategies for fiscal consolidation in the post-crisis world – called for large-scale fiscal adjustment “when the
recovery is securely underway” and for structural reforms in public finance to be initiated immediately “even in countries where the recovery is not yet securely underway” (IMF, 2010a; IMF, 2010b). Reforms of pension
and health entitlements were called for, accompanied by strengthened “safety nets” for the poorest (IMF,
2010a, pp. 15–32). On the composition of fiscal adjustment, it was advised that most of it could come from:
1. unwinding the previously adopted fiscal stimulus packages;
2. reforming pension and health entitlements to reduce the long-term financial obligations of the state by way
of avoiding “a rise in spending as a share of GDP” (IMF, 2010a, p. 16);
3. containing other spending, by means such as eliminating subsidies;
4. increasing tax revenues.
All these suggested reforms became mainstream policy advice in a majority of countries around the world after 2010 and shaped the direction embraced by the economic adjustment programmes agreed with countries facing a sovereign debt crisis. The OECD 2010 Economic Outlook (OECD, 2010) also focused on the urgent need for fiscal consolidation and structural reforms (in, for example, labour and product markets), pointing out that in both OECD and non-OECD countries the economic slack was disappearing rapidly. While these documents generally focused on higher-income countries, they also urged fiscal adjustment in developing countries, given that the risk of debt distress was increasing there too. These documents thus represented the first signs of a worldwide policy reversal. However, it turned out that economic slack did not disappear and instead a slow growth pattern risks becoming entrenched, partly due to fiscal consolidation itself.
Figure 4. Main adjustment measures in 174 countries, 2010-13 (by policy option)
Source: Ortiz and Cummins 2013, based on 314 IMF Country reports from Feb 2010 to Feb 2013.
Eliminating or reducing subsidies
Overall, 100 governments in 78 developing and 22 high-income countries appear to be reducing or removing subsidies, predominately on fuel, but also on electricity, food and agriculture. While energy subsidies are being scaled back across all regions, this policy choice appears to be especially dominant in the Middle East and North Africa, South Asia and sub-Saharan Africa. The removal of public support for food and agriculture is also most frequently observed in the Middle East and North Africa, and in sub-Saharan Africa. These adjustment measures are being implemented at a time when food and energy prices are hovering near record highs; if basic subsidies are withdrawn without compensation being provided through adequate social protection mechanisms, food and energy may become unaffordable for many households, in particular, but not only, the poorest ones. The lack of proper compensation has led to a significant number of public demonstrations, reported in 60 countries (Ortiz et al., 2013; Zaid et al., 2014).
Wage bill cuts/caps
As recurrent expenditures such as the salaries of civil servants (particularly of social sector workers) tend to be the largest component of national budgets, an estimated 98 governments in 75 developing and 23 high-income countries have considered reducing their public wage bills, often as a part of civil service reforms. This policy stance may translate into salaries being reduced or eroded in real value, payments being made in arrears, hiring freezes and/or employment retrenchment, all of which have adverse impacts on the delivery of public services to the population. Health authorities have warned of the health hazards caused by such fiscal consolidation in Europe and other regions.
Increasing consumption taxes on goods and services
Some 94 governments in 63 developing and 31 high-income countries have been considering options to boost revenue by raising rates of VAT or sales tax, or removing exemptions. The consequent increases in the costs of basic goods and services are usually regressive, as they tend to affect more significantly the costs of living of lower-income households, including those already in poverty, unless compensatory measures are in place, for example through the provision of cash and near-cash (e.g. food stamps) benefits, or the distribution of basic goods and services at subsidized prices to lower income groups.
Some other countries are considering alternative tax approaches, involving for example the expansion of usually more progressive taxes, such as those on income, inheritance, property and corporations, including taxes on the financial sector.
Reforming pension and health systems
Approximately 86 governments in 47 developing and 39 high-income countries have been considering a variety of changes to their contributory pension systems, by means such as making eligibility conditions stricter or raising the statutory pensionable age, so that people have to work longer to receive a full benefit, lowering benefit replacement rates, or eliminating minimum pension guarantees for less fortunate workers. Another 37 countries are also discussing reforming their health-care systems with a focus on cost containment, generally by increasing fees and co-payments made by patients along with cost-saving measures in public health centres. These adjustment measures have immediate negative effects on the poor, increase poverty risks for others, and may lead to the effective exclusion of many from the receipt of benefits or critical assistance at a time when their incomes are decreasing and their social needs are greatest.
Rationalizing and more narrowly targeting social assistance and other social protection benefits
Overall, 80 governments in 55 developing and 25 high-income countries have been considering rationalizing their social spending, often by revising eligibility criteria and targeting benefits more narrowly on the very poorest, which implies a de facto reduction of social protection coverage and a more limited role for social protection systems in preventing poverty. A more narrow targeting on the poorest has been discussed by governments in 25 high-income and 55 developing countries, including low-income countries such as the Gambia, Haiti, Mali, Mauritania, Nicaragua, Senegal, Sudan, Timor-Leste, Togo and Zambia, where on average about half of the population is below the national poverty line. In such places, the rationale for targeting assistance on the poorest of the poor is weak. This policy approach runs a high risk of excluding large segments of vulnerable populations at a time of economic crisis and hardship. Rather than targeting and scaling down social protection programmes to achieve cost savings over the short term, there is a strong case for scaling them up in times of crisis and building rights-based social protection floors.
Contrary to public perception, fiscal consolidation measures are not limited to Europe; in fact, most of the adjustment measures summarized here feature most prominently in developing countries, particularly subsidy reduction, wage bill cuts/caps,
and more and more “rationalization” of existing social protection programmes. The main
risk of these expenditure-contracting measures is that, when taken without due recognition of their negative consequences, they result in often large vulnerable groups being excluded from receiving benefits or critical assistance.
Ill-designed fiscal consolidation measures threaten not only the human right to social security, but also the rights to food, health, education, and other essential goods and services (Sepúlveda, 2012; UN, 2012b). In many contexts, fiscal consolidation policies are driven by a cost-saving logic, and their negative social impacts on women, children, older persons, the unemployed, immigrants or persons with disabilities, are viewed as unavoidable collateral damage in the quest for fiscal balances and debt service (CESR, 2012). The UN High
Commissioner for Human Rights has warned that “austerity measures endanger social
protection schemes, including pensions, thereby dramatically affecting the enjoyment of the
rights to social security and to an adequate standard of living” (OHCHR, 2013, para. 36),
particularly for vulnerable and marginalized groups, pointing to States’ positive obligation to
economic, social and cultural rights, including the right to social security (OHCHR, 2013, esp. paras 36–71).
2.3 Divergent trends across countries
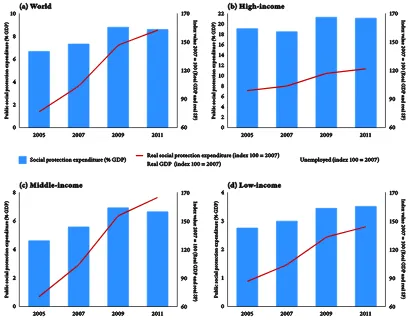
Generally, the latest available complete data (2011) show a worldwide decline in social protection expenditure in terms of GDP, particularly for middle-income and high-income countries (figure 5).5
Only low-income countries have increased public social protection expenditure as a percentage of GDP. The level of social expenditure has not risen sufficiently to keep up with the increases in unemployment and poverty.
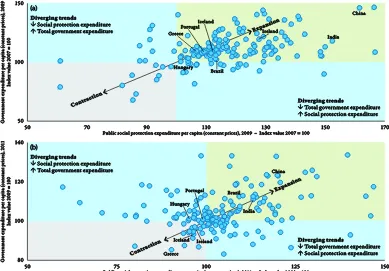
The four panels of figure 5 show trends in per capita real government social protection expenditure in the two phases of the crisis. It is clear that, despite the significant contraction in 2011, a large number of countries (mostly in the developing world) were at that point still expanding social security. It must be noted that in many of these developing countries such expansion is being partly financed using the cost savings resulting from fiscal consolidation and adjustment measures such as reducing or eliminating subsidies (including food and fuel subsidies). The net social outcome effects remain to be studied and will inevitably vary from country to country.
While a significant number of governments have adjusted their social protection systems since 2010, many developing countries have taken bold measures to extend social protection coverage and enhance at least the social assistance provided to the poorest segments of their populations (see figures 5 and 6). The strong push for the expansion of social protection started well before the onset of the global crisis, but has accelerated since 2009, sometimes as part of short-term fiscal stimulus measures, often as part of longer-term structural policies aiming at promoting human and economic development, as well as political stability.
5 At the time of writing of this report, comparable worldwide data on social security expenditure
Figure 5. Public social expenditure as a percentage of GDP, real GDP and real social protection expenditure (index 100=2007): (a) world; (b) high-income countries; (c) middle-income countries; (d) low-income countries
Note: The panel on high-income countries excludes the Russian Federation. The left (vertical) scale differs between income groups.
Figure 6. Trends in government and public social expenditure per capita (in constant prices): (a) 2007-09; (b) 2009-11
Sources: ILO calculations based on ILO, OECD, Eurostat, CEPAL, ADB, World Bank, IMF and national data. Link: http://www.social-protection.org/gimi/gess/RessourceDownload.action?ressource.ressourceId=43322.
Figure 7. Expansion of social protection in middle- and low-income countries: Selected examples of new and expanded programmes, 2000-13
Source: ILO compilation.
[image:27.595.131.537.455.657.2]3. High-income countries: Fiscal consolidation
and its effects
The majority of high-income countries (HICs)6
have been engaged in long-term reforms of social protection pension systems since long before the crisis, under pressure from demographic change and the search for long-term sustainability. The recent fiscal consolidation policies have accelerated such changes, however, affecting all areas of social protection.
3.1 Overview: Prioritizing financial sector
recovery over social protection
[image:28.595.131.535.376.544.2]The significant increases in social protection spending in the early phase of the crisis were broadly aimed at countervailing the exceptional severity of the economic downturn. There were, however, significant differences across countries: in late 2008 and 2009, while among European HICs such increases amounted to around 7 per cent in real terms, they exceeded 10 per cent in the entire OECD and reached 15 per cent in the United States, with their effect continuing through 2010 (OECD, 2012a). These increases crucially contributed to minimizing the social costs and limiting the economic impact of the crisis by avoiding a collapse of consumption and maintaining economic activity (see section 2.2 below).
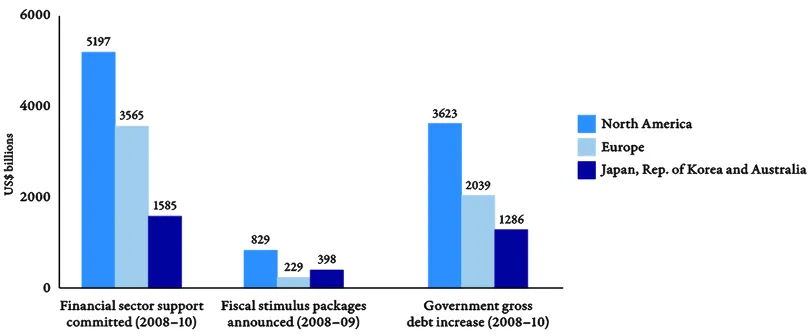
Figure 8. Support for the financial sector, fiscal stimulus packages and public debt increases, selected HICs, 2008-10 (US$ billions)
Note: North America includes United States and Canada; Europe includes Austria, Belgium, Finland, France, Germany, Greece, Ireland, the Netherlands, Poland, Portugal, Spain, Sweden and the United Kingdom.
Sources: IMF, 2010c; IMF, 2013a; Stolz and Wedow, 2010; UNDP, 2010.
Link: http://www.social-protection.org/gimi/gess/RessourceDownload.action?ressource.ressourceId=43679.
The second phase of the crisis, beginning in 2010, saw a total policy reversal: annual spending growth slowed significantly, followed by a contraction in social expenditure in 2011 for many HICs. This reflected not a reduction in social protection needs, but rather a
6 This section focuses mostly on HICs which are members of the OECD. The situation of other
180-degree shift in governments’ public expenditure policy from 2010 onwards. The
sovereign debt crisis in Europe turned public attention to government spending, as if it were this that had caused the crisis. However, government debt and deficits were symptoms of the crisis, not its cause. Rising debts and deficits at this point resulted from bank bailouts to rescue the financial sector from bankruptcy, stimulus packages, and lower government revenues due to the slowdown in economic activity (figure 8). Yet fiscal consolidation focused on deep cutbacks to public policies and shrinking the State as the main way to fix the deficit, calm the markets and revitalize the economy; following this logic, the Euro-pean social model was depicted as unaffordable and burdensome, which ultimately reduced competitiveness and discouraged growth.
When government policies shifted highest priority to servicing debt and achieving fiscal balances in 2010, employment and social protection became secondary priorities. Decisions were taken to reduce public expenditures in most HICs, despite rising unemployment and poverty (see table 1 above). Public social expenditure in HICs has not
[image:29.595.133.527.322.491.2]kept pace with populations’ needs for income security and access to health and other social services.
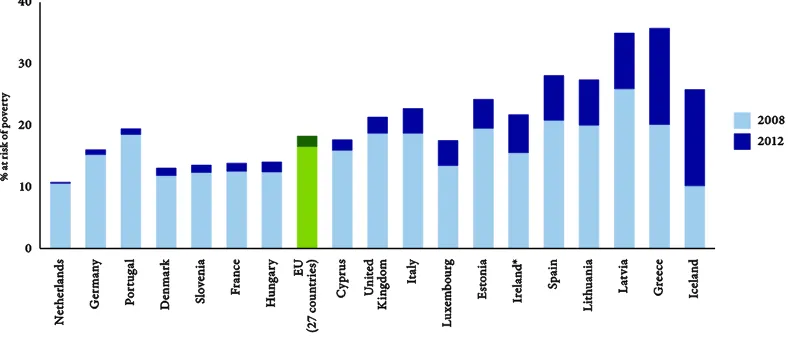
Figure 9. Increase in the proportion of the population at risk of poverty in 18 European countries between 2008 and 2012
* Data for 2011.
Note: This graph is based on an at-risk-of-poverty line of 60 per cent of median equivalized income anchored at a fixed moment in time (2008).
Source: Eurostat.
Link: http://www.social-protection.org/gimi/gess/RessourceDownload.action?ressource.ressourceId=43342.
Overall, unemployment rose by more than 45 per cent, with more than 44 million unemployed in OECD HICs in 2013 compared to 2008, while expenditure on unemployment benefits and tax-funded social assistance was initially increased but later reduced, with around half of those unemployed not receiving unemployment benefits (ILO, 2014a, Annex IV, table B.3; ILO, 2014b). At the time of writing this report, there are large groups of people, many of them formerly in the middle class, living in conditions of poverty or near-poverty in HICs; this situation is most evident in the crisis-affected countries of Europe, where in 2012 there were 9.5 million more poor people than in 2008, and child poverty was reported to be increasing at an alarming rate7
(figure 9). Rising unemployment and increased poverty on such a scale in so many European countries should have prompted measures to further strengthen social protection expenditure rather than curtailments informed by fiscal consolidation objectives.
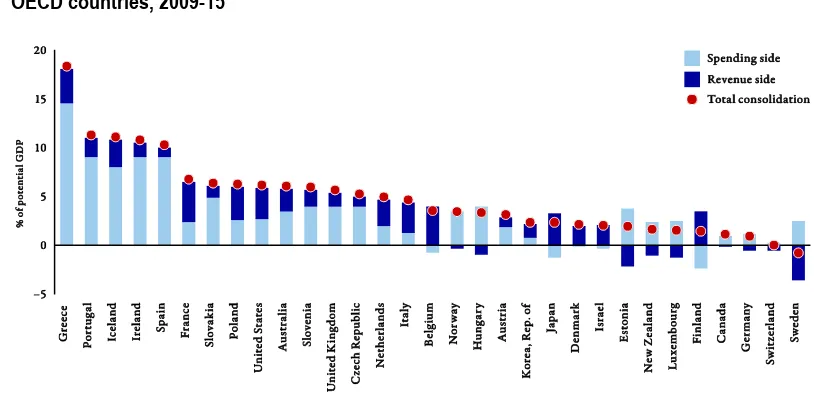
Figure 10. Distribution of expenditure-based versus revenue-based fiscal consolidation plans in 30 OECD countries, 2009-15
Sources: Based on OECD, 2012b; Rawdanowicz, Wurzel and Christensen, 2013. Link to original graph: http://www.oecd-ilibrary.org/governance/restoring-public-finances-2012-update_9789264179455-en [accessed 30 Apr. 2014].
[image:30.595.132.535.385.698.2]Link: http://www.social-protection.org/gimi/gess/RessourceDownload.action?ressource.ressourceId=43477.
Table 2. Selected fiscal consolidation measures recently adopted or under discussion in high-income countries
Reductions in social protection were most severe in those HICs with the highest budget deficits, which were also those with the most limited social assistance programmes in place (Greece, Portugal and Ireland) (Vaughan-Whitehead, 2014).8
According to a recent OECD survey across more than 30 OECD countries, around half have been considering fiscal consolidation plans requiring adjustments of more than 5 per cent of GDP from 2009 to 2015, with a high predominance of direct spending cuts as opposed to revenue-side measures (figure 10). The survey indicates that the current fiscal consolidation plans are leading to a decline in social transfers in cyclically adjusted terms in about half of OECD countries, while adjusted household taxes are expected at the same time to increase in most OECD countries.9
Social protection has frequently been targeted for expenditure reductions or freezes, in particular in the areas of unemployment benefits, health care, pensions and social assistance (see table 2). On the revenue side, measures have often aimed at increasing indirect taxes, such as VAT, which is reported to have increased on average by 1.8 percentage points in European Union member countries.10
Such increases in indirect taxes disproportionately affect low income groups (Thomas and Picos-Sánchez, 2012).
Box 2
Using sovereign pension reserve funds to fund bailouts
Sovereign pension reserve funds, normally established to support governments in funding future pension liabilities by complementing the accumulated funds from employers’ and workers’ contributions, have been tapped to a substantial extent during the course of the global crisis to help ease the strain on national public finances. In some cases they have been used them to finance interventions directly; in others, to support specific economic sectors facing difficulties or to guarantee loans.
For example, the Irish National Pension Reserve Fund was used to recapitalize the Irish banking system as one of the solicited national contributions under the economic adjustment programme for Ireland. Another example is the Australian Future Fund, which received its last financial allocation from the government in 2008, as a result of which its asset level is now considered to fall below its target level as determined by
Australia’s Government Actuary. The New Zealand Superannuation Fund, meanwhile, has increased its exposure to New Zealand’s domestic economy in response to the government’s advice to consider attractive
investment opportunities in New Zealand. Here too, the government reduced the transfer of funds from the government budget to the Fund in 2009/10 and suspended it in 2010/11; it is scheduled to resume in 2020/21.
Source: ILO, 2011; Casey, 2014; national sources.
In addition to these measures, some governments have had to look at available sources of funding to finance bailouts of financial institutions in trouble. The use of national pension funds, either through explicit loans and investment decisions or through non-explicit loan guarantees (see box 2), is cause for concern, as such funds are subject to rigorous performance objectives and targets as well as strict governance rules which now appear to be being sidestepped. Such pension assets usually represent the accumulated
8Greece reduced public spending by more than €30 billion or the equivalent of 10 per cent of GDP
between 2009 and 2011, and an additional 8 per cent is expected to be saved by 2015 (Hermann, 2013; OECD, 2012b).The Irish austerity programme is also intended to save approximately 18 per cent of GDP by 2015, while Spain, Portugal, the United Kingdom and Hungary aim at 7–8 per cent of savings at least (Vaughan-Whitehead, 2014).
9 This result is based on an OECD survey of the consolidation strategies of over 30 governments
between 2009 and 2015. Most governments reported plans to improve their public budgets primarily via spending restraints (Rawdanowicz, Wurzel and Christensen, 2013).
10 According to Eurostat, the average VAT rate in the EU was 19.4 per cent in 2008; by 2012, it had
contributions of workers and employers towards guaranteeing their social security in old age, a demand ever more pressing as these societies age.
Overall, the deployment of vast public resources to rescue private institutions
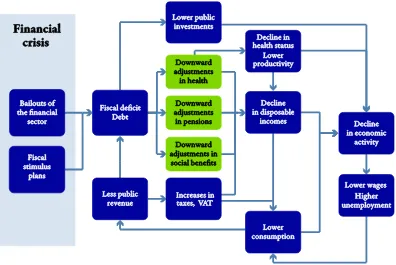
considered “too big to fail” and, to a lesser degree, to fund fiscal stimulus plans, caused sovereign debt to increase, forced taxpayers to absorb the losses and, ultimately, hindered economic growth (figure 11). Many governments have curtailed government consumption and investment and also reduced social benefits, thus creating a vicious circle: reductions in infrastructure investment and public sector wages, as well as cuts in social security, further depressed aggregate demand in the economy, in consequence reducing the demand for labour, and thus in turn increasing unemployment, reducing revenues from income taxation and narrowing the available fiscal envelope, thereby adding pressure to further reduce social transfers. The cost of adjustment has been passed on to populations, who have now been attempting to cope with fewer jobs, lower income and reduced access to public goods and services for more than five years.
Figure 11. The social and economic risks of fiscal consolidation
Source: ILO.
Link: http://www.social-protection.org/gimi/gess/RessourceDownload.action?ressource.ressourceId=43680.
3.2 First phase of the crisis: Scaling up social
protection to sustain households’ disposable
income and domestic demand (2008
–
09)
[image:32.595.131.527.278.543.2]incorporating urgently needed social assistance benefits for the growing number of poor. These and other such short-term adjustments limited the fall in citizens’ purchasing power and thus also the decline in global aggregate demand.
Data from the United States, Japan, France and Germany from 2009 to early 2010 provide evidence of the counter-cyclical automatic economic and social stabilizer function of social protection expenditure, especially of the role played by special fiscal stimuli to scale up short-term benefits for the unemployed and the poor in reversing the downward trend of private consumption expenditure (figure 12).11
Figure 12. Trends in real per capita public social protection expenditure, GDP, consumption and unemployment, 2007-2012/13: (a) United States; (b) Japan; (c) France; (d) Germany
Note: Indexed levels, 2007 =100. Sources: ILO, OECD, Eurostat, IMF.
Link: http://www.social-protection.org/gimi/gess/RessourceDownload.action?ressource.ressourceId=43323.
Further evidence of the counter-cyclical effect of social protection is provided by analysis of different components of growth in private disposable income over time. Before the crisis, labour income, net social benefits, taxes and property income varied across economic cycles such that gross disposable real income increased by around 4 per cent annually in the European Area up to 2008 (figure 13). Then, in 2009 and early 2010,
11 In Germany, where 26 per cent of GDP was spent on public social protection in 2012, four
[image:33.595.133.535.213.511.2]populations in a majority of countries experienced significant declines in their incomes from earnings and other sources of market income, due to increased unemployment, reductions in working time and earnings, and declining profits and other capital incomes.
Figure 13. Contributions of various components to the growth of nominal gross disposable income of household, European Area 17 countries, 2000-12 (percentages)
Notes: Annual percentage change and percentage point contributions. Labour income includes compensation of employees, gross operating surplus and mixed income (compensation of self-employed).
Source: Eurostat/European Central Bank.
Link: http://www.social-protection.org/gimi/gess/RessourceDownload.action?ressource.ressourceId=43324.
On average, incomes from earnings and capital (market incomes) dwindled by 1.9 per cent per year in real terms across the OECD over this period; however, in some countries, such as Greece, Iceland and New Zealand, market incomes dropped by more than 7 per cent per year (figure 14). Increased social transfers and other elements of the special fiscal stimuli played a particularly strong role in cushioning the effects of a reduction of market incomes in countries such as Estonia, Ireland, New Zealand and Spain. In other countries, where regular and adequate social protection benefits were not
available, no such cushioning effect against the drastic falls in households’ disposable
income could be observed. From 2010 up to early 2012, the earnings component added on average 2 percentage points to growth of disposable incomes, while changes in reduced social benefits clearly worked in the opposite direction.
[image:34.595.134.533.138.312.2]Figure 14. Annual changes in disposable income, 2007-10, by income component, selected OECD countries
Notes: 2007 figure refers to 2006 for Chile and Japan; 2008 figure for Australia, Finland, France, Germany, Israel, Italy, Mexico, New Zealand, Norway, Sweden and the United States. Figure for 2010 refers to 2009 for Hungary, Japan, New Zealand and Turkey; 2011 for Chile. Data for 2010 based on the European Union Statistics on Income and Living Conditions (EU-SILC) surveys are provisional for Austria, Belgium, Czech Republic, Estonia, Finland, Greece, Iceland, Ireland, Italy, Luxembourg, Poland, Portugal, Spain, Slovakia and Slovenia. Household incomes are adjusted for household size. Market incomes are reported net of taxes in Hungary, Mexico and Turkey.
Source: Based on OECD Income Distribution database; see OECD, 2013a.
Link: http://www.social-protection.org/gimi/gess/RessourceDownload.action?ressource.ressourceId=43417.
Despite the cushioning and consumption-stabilizing effects of taxes and transfers, the crisis effectively depressed disposable incomes in many OECD countries, with in many cases negative knock-on effects on private consumption and aggregate demand. Overall, between 2007 and 2010 private households suffered an annual decline in their disposable incomes of as much as 8.4 per cent in Iceland and between 2 and 4 per cent in Estonia, Greece, Hungary, Ireland, Mexico, New Zealand and Spain (figure 14). This effect was further sharpened by the internal devaluations pursued in some countries of the eurozone.
3.3 Second phase of the global crisis:
Fiscal consolidation, 2010 onwards
The turn towards fiscal consolidation measures in the second phase of the crisis, from 2010 onwards, reversed the expansionary stance typical of responses to the first phase and included various measures to reduce benefits. This coincided with the policy reversal adopted by the IMF Board and endorsed by the OECD and the G20 (box 1). More recently, IMF Chief Economist Olivier Blanchard has admitted serious underestimation of fiscal multipliers with respect to the depth of the economic contraction in the design of fiscal consolidation policies (Blanchard and Leigh, 2013); also, IMF research has acknowledged that fiscal consolidation has adverse effects on both short- and long-term unemployment, private demand and GDP growth, with wage earners hurt disproportionately more than profit- and rent-earners (Guajardo, Leigh and Pescatori, 2011; Ball, Leigh and Loungani, 2011), and that policies that sustain aggregate demand are still critically important (Blanchard, Jaumotte and Loungani, 2013). Nevertheless, at the time fiscal consolidation policies were adopted across HICs, with spending cuts targeted in particular on short-term benefits, such as unemployment benefits, family benefits and family support programmes, thus making it more difficult for households to maintain a life in dignity with at least a minimum income security, especially for many families with children. Following recent reforms, some European countries may no longer be compliant
1952 (No. 102), which most of them have ratified. Table 2 provides an overview of some of the main measures adopted during the global crisis.
Unemployment benefits
Access to unemployment benefits, and the levels and maximum duration of payments, were reduced starting in 2010 (see also ILO, 2014a, section 3.2). Increases in poverty have been attributed in part to such reductions in protection: one recent study, for example, argues that increases in poverty in the United States stem directly from cuts to unemployment benefits (CBPP, 2014).
In countries with advance-funding approaches, unemployment benefits from 2008 to early 2010 were financed from current contributions and reserve funds accumulated under unemployment insurance (UI) schemes. However, as high unemployment rates persisted beyond 2010, UI reserve funds started to run out. Increases to UI contribution rates were then considered, although there was reluctance from employers, who argued on the contrary for pro-cyclical support in the form of lower social security contributions. This highlights the importance of promoting counter-cyclical UI funding in countries without advance-funding policies to ensure the availability of reasonable UI funds during future economic downturns. The advance funding of unemployment benefits in reasonable proportions and within a well-governed framework could help to ease the pressure on public budgets during downturns, when needs are high and revenues are falling, and when the business sector is less receptive to possible contribution increases.
Health
Most governments have initiated reforms in health protection systems, such as rationalizing the costs of public health facilities, introducing patient co-payments and cutting wage bills for medical staff. Increased out-of-pocket expenditures for health add further pressure on governments to increase pensions and other social protection benefits to cover the additional cost for households of seeking necessary health care. Meanwhile, a lower quality of health service provision leads to worse health outcomes (e.g. Karanikolos et al., 2013; Mladovsky et al., 2012). Weakened mental health, increased substance abuse and higher suicide rates have all been linked with fiscal consolidation measures (WHO, 2011; Stuckler and Basu, 2013). The European Centre for Disease Control warned that serious health hazards are emerging because of the fiscal consolidation measures introduced since 2008.12
More specifically, in Greece, Spain and Portugal citizens’ access
to public health care services has been seriously constrained, to the extent that there are reported increases in mortality and morbidity. The Lancet speaks of “a Greek public health tragedy” in which citizens are subject to one of the most radical programmes of welfare
state retrenchment in recent times (Kentikelinis et al., 2014).
Social benefits
The vast array of tax-financed allowances such as child allowances, disability benefits and housing support have been rationalized during the crisis in the search for cost
12 In January 2013, doctors from Portugal, Spain, Ireland and Greece sent an open letter to European
savings. The negative effects of fiscal consolidation on poverty have been most noticeable in countries where the basic system of social assistance is weak or has been recently weakened, as in some of the crisis-hit Baltic States and the European countries under ratified economic adjustment programmes. The Government in Greece, for instance, is planning drastic structural changes to replace a large number of existing social benefits, such as disability and family benefits, as well as the minimum pension provided under social insurance schemes, with a safety net for the poorest, a single targeted guaranteed minimum income scheme providing a relatively low benefit. Ireland is also replacing a universal child benefit by a means-tested allowance to low-income families. The introduction of means testing for previously universal benefits, and the more narrow targeting of benefits on people living in poverty, erodes the principles of universal protection which used to be part of the social contract in many European countries, based on legal rights. For instance, fiscal consolidation measures have restricted the access of persons with disabilities to community living, education, primary care and assistance. Cuts in gender equality programmes, child-care services, parental and child benefits, services to victims of violence and legal aid affect women in particular (EU Commissioner for Human Rights, 2013).
Pensions
Common pension reforms include raising the retirement age, reducing benefits, increasing contribution rates and reducing pension tax exemptions, as well as the structural reforms introduced in some countries. Most countries were introducing changes to their pension systems prior to the crisis, in view of the demographic ageing of populations, but fiscal consolidation precipitated drastic cost-saving measures adopted without adequate consideration of their social impacts. Some of these reforms have been contested in national constitutional courts. A good measure by which to grasp the effect of reforms is the gross theoretical replacement rate for public (statutory) pensions. Simulations show future pensioners receiving lower pensions in at least 14 European countries, with a projected decline by more than 10 percentage points in eight countries (figure 15).13
13 Since these projections were made, Portugal, Spain, Greece and Italy have adopted further
Figure 15. Reduction in gross theoretical replacement rates of statutory pensions for average wage workers retiring at age 65 after 40 years of contributions, 2010-50 (percentage points of theoretical average wage)
Source: Based on European Commission, 2012a; European Commission, 2012b.
Link: http://www.social-protection.org/gimi/gess/RessourceDownload.action?ressource.ressourceId=43721.
Most structural pension reforms in HICs that have introduced the principle of individual savings have removed the de facto minimum pension guarantees that used to be
explicitly provided under traditional “defined benefit” pension systems (some of which are
still in existence). In addition, numerous reforms have further eroded the purchasing power of pensions through indexation measures limiting their adjustment to a level below changes in prices and wages: Spain, for instance, stopped indexing pensions to price inflation in 2013.14
These changes result in more older persons not having sufficient inco