GENERALISATION OF SUBMARINE FEATURES ON NAUTICAL CHARTS
Eric Guilbert, Xunruo Zhang
Department of Land Surveying and Geo-Informatics The Hong Kong Polytechnic University
Hung Hom, Kowloon, Hong Kong [email protected], crystal [email protected]
Invited Paper, Commission II, WG II/2
KEY WORDS:Model generalization, GIS, Landscape representation, Cartography, DEM/DTM representation
ABSTRACT:
On most large scale and middle scale maps, relief is represented by contours and spot heights. In order to adapt the representation to the scale, the terrain is generalised either by smoothing or filtering the terrain model or by simplifying the contours. However this approach is not applicable to nautical chart construction where terrain features are selected according to their importance for navigation. This paper presents an approach for the consideration of feature attributes in the generalisation of a set of contours with respect to nautical chart constraints. Features are defined by sets of contours and a set of generalisation operators applied to features is presented. The definitions are introduced in a multi-agent system in order to perform automatic generalisation of a contour set. Results are discussed on a case study and directions for future work are presented.
1 INTRODUCTION
Nautical charts provide a schematic representation of the subma-rine relief and are used by navigators to plan their route. The seafloor is portrayed by isobaths and soundings. Bathymetric generalisation on a nautical chart is driven by two main rules in order to obtain a representation that fits navigation requirements. First, the depth reported on the chart can never be deeper than the real depth and navigation hazards such as reefs must be empha-sised in order to ensure safety of navigation. Second, navigators do not see the seafloor and rely on the chart to plan their routes. Therefore, relevant fairways or berths must be highlighted. In comparison with topographic maps, nautical charts provide a more schematic representation of landforms. Starting from the seafloor modelled by a set of soundings and isobaths extracted from the bathymetric database, the cartographer would work in practice by selecting spot soundings and isobaths according to the relevance of the submarine features they model. Sounding position and depth cannot be modified so that spot soundings are selected from the database. Isobaths displayed on the chart can be modified to emphasise characteristic features (which in this do-main are mostly prominences and depressions). An isobath mod-elling a reef is kept and may be enlarged while an isobath mark-ing a depression may simply be omitted if it does not brmark-ing rele-vant information for navigation. On one hand, the chart contains highly accurate information provided by spot soundings while on the other hand great prominence is given to lesser depths. As reported in (NOAA, 1997, p. 4-11),“[cartographers]do, deliber-ately and knowingly, and on behalf of the navigator, include all lesser depths within a contour even if it means that[their]catch includes many deep ones as well”.
As a consequence, contour generalisation obtained by smoothing the terrain and regenerating the contours as done for topographic maps does not yield appropriate results. While terrain generali-sation on topographic maps is more relevant to cartographic gen-eralisation where the objective is to provide a legible representa-tion of the terrain, bathymetric generalisarepresenta-tion on nautical charts pertains to model generalisation where submarine features are se-lected according to their meaning for the purpose of the map.
In order to consider submarine features in the process, they must be identified from the contours and recorded in a topological data structure. Features are defined by sets of contours as perceived by the navigator. Constraints and operators can be defined and applied to contours based on feature data. The present paper discusses the constraints and operations to consider for feature-driven generalisation of a contour map. While most methods for contours are relevant to cartographic generalisation, the approach is more relevant to model generalisation as operators apply to fea-tures according to their meaning.
This paper defines continuous operators based on the snake model that take into account feature-related constraints and discrete op-erations that modify the feature data structure in the context of nautical chart generalisation. Operations that apply only to sin-gle contours such as smoothing and conflicts occurring between contours within a feature are not addressed.
The paper first reviews existing work on contour generalisation and terrain feature representation on contour maps. New gener-alisation operators are defined in section 3. Both constraint def-initions and the updating of the data structure are addressed. In section 4, operators are introduced into a multi-agent system and applied to nautical chart generalisation. Results are presented and discussed. Finally, conclusions and perspectives for future work are presented.
2 PREVIOUS WORKS
2.1 Contour generalisation
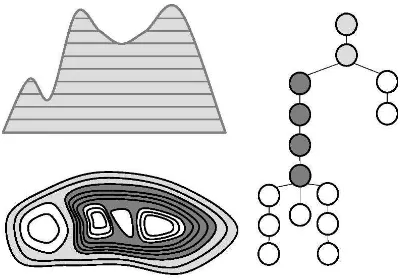
Figure 1: Contour tree and map. Branches at the bottom of the structure (white contours) represent peaks and pits.
contours. The main advantage of these methods on simple line smoothing operations is that local terrain characteristics can be taken into account to maintain the shape of the contours and the topological relationships between the contours. But the character of features modelled by the contours is not considered and only simplification is performed.
Other line generalisation operators can also apply to contours such as aggregation, smoothing, displacement or exaggeration. Earliest approaches consisted in defining dedicated rules for spe-cific operations or applications such as road or coastline sim-plification (Nickerson, 1988; Musti`ere, 1998; Wang and M¨uller, 1998). However, a difficulty for process automation is that ap-plying these methods is based on rules which apply for single lines but which are limited for processing groups of lines as they cannot handle side effects and the result may depends of the or-der in which operations are performed. Therefore, more recent techniques are based on the minimisation of constraints express-ing conditions to satisfy via continuous optimisation techniques (Harrie and Weibel, 2007).
Optimisation techniques are mostly based on energy minimisa-tion approaches such as snakes (Burghardt and Meier, 1997) or elastic beams (Bader, 2001). Methods apply to roads (Burghardt and Meier, 1997), buildings (Bader et al., 2005) or contour lines (Guilbert and Saux, 2008). The last method, based on snakes, takes into account position constraints so that a line can be smoothed while preserving a minimal distance with neighbouring objects or by pushing the line in one direction. It applies to iso-bathymetric line generalisation but terrain feature information is not considered and interaction with the cartographer is required. 2.2 Feature representation on a contour map
The most common topological data structure applied to a con-tour map is the concon-tour tree built on inclusion relationships be-tween the contours (Cronin, 1995). Two kinds of features are ex-tracted: peaks (or more generally, prominences) and pits (or more generally, depressions), which correspond to branches containing leaves of the contour trees (Kweon and Kanade, 1994) (Figure 1). However this representation does not take into account the different levels at which terrain features can be described. Only features at the highest level of detail are defined and depending on the level of detail considered, it is not possible to know which type of feature a given contour belongs to.
Characterisation of features at different levels from contours on a terrain model was tackled by Chaudhry and Mackaness (2008). Prominences are defined first by morphometric classification of
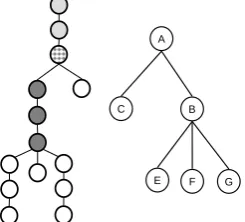
Figure 2: Terrain features and feature tree identified from Figure 1 contour tree (Zhang and Guilbert, 2011).
the DTM. Prominence extent is then defined by the largest con-tour containing the summit and no other higher point. A data structure storing terrain features at multiple levels which does not require the DTM is proposed by Zhang and Guilbert (2011). Fea-tures are defined by groups of contours forming a feature tree (Figure 2). A feature is characterised by a boundary contour rep-resenting its spatial extent and all the contours within. A feature is classified as a peak if its boundary contour is lower than all inner contours or as a pit if it is higher than the inner contours. Bound-ary contours are located at each base of a branch of the contour tree or inside a branch if a change of slope occurs. In comparison with (Chaudhry and Mackaness, 2008), more features are defined as one summit can be contained by several features at different levels.
3 FEATURE GENERALISATION
3.1 Generalisation constraints and operations
Generalisation requirements can be organised according to dif-ferent classes of constraints (Beard, 1991). Referring to Ruas and Plazanet (1997)’s classification, constraints in isobath gener-alisation for nautical charts can be categorised into:
• The legibility constraint: generalised contours must be legi-ble by observing a minimum size or distance between them; • The position and shape constraints: absolute position and shape of contours must be maintained. Relative distance between contours must be preserved as much as possible; • The structural and topological constraints: spatial
relation-ships between contours are maintained. Distribution and mean distance between contours are preserved;
• The functional constraint, specific to the purpose of the map: on a nautical chart, functional constraints are the safety con-straint indicating that a reported depth cannot be greater than the real depth and the preservation of navigation routes.
Guilbert, 2011) which records topological relationships between features modelled by contours.
Functional constraints apply to both single contours or groups of contours depending on the purpose. The terrain representation obtained on the chart is more schematised than on a topographic map as the objective is to clearly mark features on the seafloor rather than to provide a detailed description of the seafloor. Func-tional and structural constraints can be spatial and semantic as they include constraints related to the type of features and their relationships. On a nautical chart, generalising isobathymetric lines obeys to strict functional constraints:
• An isobath can only be moved towards greater depths; • An isobath can only be removed if the new representation is
not deeper than the original representation;
• Adjacent isobaths can be merged if they are at the same depth and the area in between is deeper;
• Isobaths delineating fairways must be preserved;
• Isobaths characterising features not relevant for navigation can be removed.
Integrating functional constraints in a generalisation process re-quires the classification of features as whether a too small isobath must be enlarged or removed depends on the type of feature it belongs to. Therefore, functional constraints can be expressed as semantic and spatial constraints on features.
• A feature on the chart must be large enough to contain a sounding marking its deepest or shallowest point.
• A pit cannot be enlarged or aggregated; • A too small or not relevant pit is removed; • A peak cannot be removed;
• A too small peak is enlarged or aggregated with an adjacent peak;
• Position of boundary lines of fairways (corresponding to elongated pits at global levels in the feature tree) must be maintained.
As a consequence, generalisation operations apply to features ac-cording to the type of conflict and constraints. Generalisation operators applying to features are:
• Selective omission: the feature is deleted with all its con-tours. Inner features are also deleted. Neighbouring or par-ent features in the feature tree may be updated;
• Enlargement: contour lines defining the feature boundary are enlarged. The feature tree is not modified;
• Aggregation: adjacent peaks are aggregated into one larger peak by merging their boundary contours. Boundary con-tours must be at the same elevation. The feature tree and composition of neighbouring features can be modified;
Operations are of two types: continuous operations which do not modify the feature tree or the feature definition and discrete oper-ations which trigger modification of the data structure by creating or removing features or modifying feature attributes. Aggrega-tion is performed in two steps: a continuous deformaAggrega-tion filling the gap between boundary segments and a discrete operation join-ing the feature boundaries.
The following section defines a model for performing continu-ous operations. Constraints are presented for enlargement and aggregation. On top of enlargement and aggregation performed on peaks, reduction and split may also be performed on pits. However, these operators are hardly used as, in model generalisa-tion, if a feature is considered not relevant, it is simply removed. Nonetheless, these operations can be easily added in the model as their definitions are similar to aggregation and enlargement. 3.2 Continuous operations
3.2.1 The snake model Snakes were originally derived by Kass et al. (1987). They are lines defined with their own energy from their geometrical features. A snake is defined by a para-metric curvef(s), sbeing the curvilinear abscissa, which is at an equilibrium position when its global energy is minimal. The global energy of the snake is expressed as
Esnake(f) =
Z b
a
[Eint(s) +Eext(s)]ds (1)
whereEintis the internal energy andEextis the external energy. The internal energy controls the shape of the snake and is defined from its derivatives: whereαandβare shape parameters, usually set by the user. The external energy represents application constraints and is not re-lated to the shape of the curve. Performing a generalisation op-eration consists in applying the appropriate external energy ex-pressing the conflict to correct. One interest of continuous opti-misation method is that different energies corresponding to differ-ent constraints can be added up resulting in combining differdiffer-ent operators together. The following sections describe the external energies for the continuous operations presented in section 3.1. 3.2.2 Enlargement Enlargement is performed by adding to each point an external energy related to the distance to a sound-ingΩinside the feature: the closer a point to the sounding, the larger the energy. Deformation is performed until points of the boundary are at a distance equal to or larger than a threshold dis-tanceεenlfrom the sounding.
Eenl(s) = 3.2.3 Aggregation Aggregation is performed by adding an attractive energy term on boundary segments to merge so that the two features move closer and eventually overlap (Figure 3). A discrete operator is then applied to create the feature and up-date the feature tree (section 3.3.2). The purpose of using this attractive energy is to obtain a smooth deformation and prevent potential conflicts with other neighbouring objects. For two given featuresFandGwhose boundaries are respectively notedfand
10 10.5 11 11.5 12
100 100.5 101 101.5 102 102.5 103 Original lines Line after deformation
Figure 3: Feature deformation for aggregation.
F E G
A
Figure 4: Contour tree and feature tree of Figures 1 and 2 after removal of feature C. Feature B has been removed because it is of the same class as feature A.
Eagr(s) =
d(f(s), g)2 ifd(f(s), g)< ε
agr
0 ifd(f(s), g)≥εagr
0 iff(s)is withinG
(4)
with functiondthe shortest distance from pointf(s)tog. Defor-mation is applied to points offwhich are at a distance smaller than thresholdεagr. Deformation is stopped whenfandg sect. The process also requires that the angle formed by inter-secting segments is large enough to get a smooth junction of both lines.
3.2.4 Distance constraint In order to prevent creation of new conflicts during the process, a distance constraint is also added to keep features away from their neighbours obtained from the feature tree. If the distance between the linefand those features is smaller than the legibility distanceεleg, an external energy is added to push back the line into its admissible area. The energy is defined by:
Eenl(s) =
ε2leg−d(f(s), g)2 ifd(f(s), g)< εleg
0 otherwise (5)
whered(f(s), g)is the distance betweenf(s)and a neighbour-ing featureg.
3.3 Discrete operations on features
3.3.1 Selective omission Removing a feature from the feature tree implies removing all its contours from the contour tree. If the parent feature is left with one descendant feature of the same class, the descendant feature is removed from the feature tree as it characterises the same feature with a smaller extent (Figure 4).
3.3.2 Feature aggregation The aggregation operation pre-sented in the previous section results in two overlapping features. A new isobath is obtained by aggregating the two intersecting boundaries. Aggregation can lead to the removal or creation of features and the new isobath can belong to a new feature or to an existing one (Figure 5).
C
F E G
A
B
Figure 5: Aggregation of features B and C. The merged contour (hashed) is part of feature A. Features B and C are defined with new boundary contours.
4 APPLICATION
4.1 The multi agent system
Generalisation constraints and operators were implemented for evaluation in a multi-agent system. Multi-agent systems are, like optimisation methods, constraint-based approaches. Agents can consider different operations and perform several plans to choose the best result. Such model provides more flexibility than a condition-action model where each action is determined by a set of fixed rules Harrie and Weibel (2007). Furthermore, agents can perform both discrete and continuous operations and thus op-erations on the data structure and the snake model can both be included in the agent model.
A multi-agent system for isobath generalisation was introduced by Zhang and Guilbert (2011). Following the approach devel-oped by Ruas (1999), map objects are defined as two different types of agents: isobaths are micro-agents and features formed by groups of isobaths are meso-agents. Each type of agent has its own constraints, evaluation methods detecting conflicts and operators performing generalisation actions. Zhang and Guilbert (2011) detail a list of constraints and actions for both types of agent and discuss the interest of the approach for feature-driven generalisation but plan evaluation and communication between agents are not addressed.
Each feature agent goes through a series of steps summarised in Figure 6. The feature first evaluates if generalisation must be performed by communicating with the contour agent that defines its boundary. The feature passes information about neighbouring features and admissible direction of deformation. Based on this information, the contour checks if any area or distance conflict occurs and returns the result to the feature.
Start
Evaluation
Evaluate size and distance conflicts
on contours
List of plans
Continuous operation
Discrete operation
End
Re-evaluation
Contour deformation
Figure 6: Flowchart of the feature generalisation process.
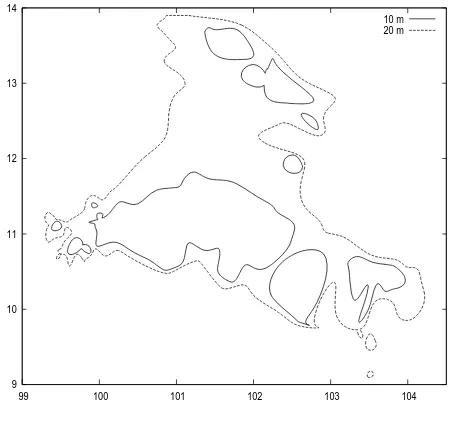
9 10 11 12 13 14
99 100 101 102 103 104 10 m 20 m
Figure 7: Boundary contours before generalisation. Units in cm and the next action in the plan, aggregation is performed. Once continuous operation is completed, the data structure is updated if required (Figure 6). During the process, topological and safety constraints are always maintained as any operation that would vi-olates these constraints would be rejected.
4.2 Results
The model was run on a set of bathymetric lines provided by the French Hydrographic and Oceanographic Service (SHOM). As soundings were not included in the model, the area constraint is computed using the centre of the isobath forΩ. Only constraints and operations described above were applied. Local constraints related to isobath smoothness and legibility inside a feature were not considered. An example from a 1:50,000 map is presented in Figure 7. Only contours modelling the boundaries of features are taken into account and generalised.
The result of the feature generalisation process is given in Figure 8. Six feature aggregation and two feature enlargement were
9 10 11 12 13 14
99 100 101 102 103 104 10 m 20 m
Figure 8: Map after generalisation. Units in cm. formed on peaks. The process was done automatically and the feature tree was updated preserving the topological information. Based on the type of feature (peak or pit), agents were able to choose and apply an operator. Plans are indeed limited as a peak is enlarged if there is enough room around otherwise it is ag-gregated with the closest feature even if several candidates are available. If the aggregated features is large enough, no more ag-gregation would be done while a human cartographer may have aggregated all neighbouring features. In the bottom part of Fig-ure 8, a small 20 metre contour was aggregated with the large 20 metre contour which was closer. Shape constraints are not con-sidered as this stage focuses on model generalisation, yielding a merged contour with acute angles. Contours still need to be smoothed in order to fit chart requirements.
5 CONCLUSION AND FUTURE WORKS
Although contour generalisation has been addressed in many dif-ferent ways, whether directly or by generalising the terrains, ex-isting methods do not apply to nautical chart generalisation due to its purpose. Previous works were mostly concerned with pro-viding a legible map and terrain features were not considered in the process while on a chart, contours must be selected and gen-eralised differently according to the type of terrain they repre-sent. Therefore, this paper presents an approach where contours are grouped into features and generalisation is performed on the features. Generalisation constraints and operations are described including continuous transformations (enlargement, aggregation) based on a snake model and updates brought to the data structure. The operators are introduced in a multi-agent model. Terrain fea-tures are processed by generalising their boundary contours ac-cording to feature attributes and constraints. In current results, operations are selected and performed automatically. At this stage, constraints on individual contours such as smoothness are not integrated in the model. Micro-agents can evaluate their en-vironment based on information from meso-agents and perform actions in line with (Ruas, 1999) however these actions follow plans set by meso-agents. A next stage is to have contours able to set their own plans to perform operations inside features follow-ing Duchˆene (2004)’s approach.
method currently does not take into account other elements on the chart. Second is that the method is more conservative because it tends to keep as much information as possible to preserve the morphology while a human cartographer tends to provide a more schematic representation. Soundings were not considered in this example but the constraints and snake energy can be modified to integrate sounding positions in the process. On a longer term, the objective is to integrate soundings as micro-agents and include them in generalisation plans. Sounding selection would be done according to feature attributes and adjacent contours.
ACKNOWLEDGEMENTS
The work presented in this paper is supported by the Research Grants Council of Hong Kong under General Research Fund grant PolyU 5172/08E. Authors are grateful to the SHOM who provided the bathymetric data.
References
Ai, T., 2004. A generalization of contour line based on the extrac-tion and analysis of drainage system. In: Proceedings of the XXth ISPRS congress, International Archives of Photogram-metry, Remote Sensing and Spatial Information Sciences, Vol. XXXV, part B4.
Bader, M., 2001. Energy minimization methods for feature displacement in map generalization. PhD thesis, Universit¨at Z¨urich.
Bader, M., Barrault, M. and Weibel, R., 2005. Building displace-ment over a ductile truss. International journal of geographical information science 19(8–9), pp. 915–936.
Beard, K., 1991. Constraints on rule formation. In: B. Butten-field and R. B. McMaster (eds), Map Generalization, London, pp. 121–135.
Burghardt, D. and Meier, S., 1997. Cartographic displacement using the snakes concept. In: W. F¨orstner and L. Pl¨umer (eds), Semantic modeling for the acquisition of topographic informa-tion from images and maps, Birkhauser Verlag, pp. 59–71. Chaudhry, O. and Mackaness, W., 2008. Creating mountains
out of mole hills: Automatic identification of hills and ranges using morphometric analysis. Transactions in GIS 12(5), pp. 567–589.
Cronin, T., 1995. Automated reasoning with contour maps. Com-puters and geosciences 21(5), pp. 609–618.
Duchˆene, C., 2004. G´en´eralisation cartographique par agents communicants: le mod`ele CartACom. PhD thesis, Universit´e Paris 6.
G¨okg¨oz, T., 2005. Generalization of contours using deviation an-gles and error bands. The Cartographic Journal 42(2), pp. 145– 156.
Guilbert, E. and Saux, E., 2008. Cartographic generalisation of lines based on a B-spline snake model. International Journal of Geographical Information Science 22(8), pp. 847–870. Harrie, L. and Weibel, R., 2007. Modelling the overall process
of generalisation. In: W. Mackaness, A. Ruas and L. Sar-jakoski (eds), Generalisation of Geographic Information: Car-tographic Modelling and Applications, Elsevier Science, Am-sterdam, pp. 67–87.
Kass, M., Witkin, A. and Terzopoulos, D., 1987. Snakes: active contour models. In: Proceedings of International Conference on Computer Vision, IEEE Computer Society Press, Washing-ton DC, pp. 259–268.
Kweon, I. S. and Kanade, T., 1994. Extracting topographic terrain features from elevation maps. CVGIP: Image Understanding 59(2), pp. 171–182.
Li, Z. and Sui, H., 2000. An integrated technique for automated generalization of contour maps. The Cartographic Journal 37(1), pp. 29–37.
Mackaness, W. and Steven, M., 2006. An algorithm for localised contour removal over steep terrain. The Cartographic Journal 43(2), pp. 144–156.
Matuk, K., Gold, C. and Li, Z., 2006. Skeleton based contour line generalization. In: A. Riedl, W. Kainz and G. A. Elmes (eds), Progress in Spatial Data Handling, Springer Berlin Heidelberg, pp. 643–658.
Musti`ere, S., 1998. GALBE: Adaptive generalisation, the need for an adaptive process for automated generalisation, an exam-ple on roads. In: GIS Planet 98, CDROM.
Nickerson, B., 1988. Automated cartographic generalization for linear features. Cartographica 25(3), pp. 15–66.
NOAA, 1997. Nautical Chart User’s Manual. National Oceanic and Atmospheric Administration, U.S. Department of Com-merce.
Ruas, A., 1999. Mod`ele de g´en´eralisation de donn´ees g´eogra-phiques `a base de contraintes et d’autonomie. PhD thesis, Uni-versit´e de Marne-la-Vall´ee.
Ruas, A. and Plazanet, C., 1997. Strategies for automated gen-eralization. In: M. Kraak, M. Molenaar and E. Fendel (eds), Advances in GIS research II, Proceedings of the 7th Interna-tional Symposium on Spatial Data Handling, Taylor & Francis, London, pp. 319–336.
Wang, Z. and M¨uller, J.-C., 1998. Line generalization based on analysis of shape characteristics. Cartography and Geographic Information Systems 25(1), pp. 3–15.