INTEGRATION OF GENETIC ALGORITHMS AND FUZZY LOGIC FOR URBAN
GROWTH MODELING
E. Foroutana, M.R Delavarb and B.N Araabic
a
MSc. student, GIS Division, Dept. of Surveying and Geomatics Eng., College of Eng., University of Tehran, Tehran,
Iran
[email protected]
b
Center of Excellence in Geomatics Eng. in Disaster Management, Dept. of Surveying and Geomatics Eng., College
of Eng., University of Tehran, Tehran, Iran
[email protected]
C
School of Electrical and Computer Eng., College of Eng., University of Tehran, Tehran, Iran
[email protected]
Commission II, WG II/4
KEY WORDS: Urban Growth modeling, Urban driving forces, Genetic Fuzzy System, Suitability mapping, Validation
ABSTRACT:
Urban growth phenomenon as a spatio-temporal continuous process is subject to spatial uncertainty. This inherent uncertainty cannot be fully addressed by the conventional methods based on the Boolean algebra. Fuzzy logic can be employed to overcome this limitation. Fuzzy logic preserves the continuity of dynamic urban growth spatially by choosing fuzzy membership functions, fuzzy rules and the fuzzification-defuzzification process. Fuzzy membership functions and fuzzy rule sets as the heart of fuzzy logic are rather subjective and dependent on the expert. However, due to lack of a definite method for determining the membership function parameters, certain optimization is needed to tune the parameters and improve the performance of the model.
This paper integrates genetic algorithms and fuzzy logic as a genetic fuzzy system (GFS) for modeling dynamic urban growth. The proposed approach is applied for modeling urban growth in Tehran Metropolitan Area in Iran. Historical land use/cover data of Tehran Metropolitan Area extracted from the 1988 and 1999 Landsat ETM+ images are employed in order to simulate the urban growth. The extracted land use classes of the year 1988 include urban areas, street, vegetation areas, slope and elevation used as urban growth physical driving forces. Relative Operating Characteristic (ROC) curve as an fitness function has been used to evaluate the performance of the GFS algorithm. The optimum membership function parameter is applied for generating a suitability map for the urban growth. Comparing the suitability map and real land use map of 1999 gives the threshold value for the best suitability map which can simulate the land use map of 1999. The simulation outcomes in terms of kappa of 89.13% and overall map accuracy of 95.58% demonstrated the efficiency and reliability of the proposed model.
1. INTRODUCTION
Modeling of cities and ecologies with geographic properties as complex systems which involve natural, social, spatial and temporal processes still remains as a challenge. Urban growth phenomenon as a dynamic process always was concomitant with the interaction of complex human based and non-human based parameters. Complexity of urban systems necessitates the consideration of interdependency among various factors for urban expansion modeling (Pijanowski et al., 2009). Recent decades were encountered with a number of modeling techniques which have been developed to better understand and predict urban growth (Clarke et al., 1997; Foroutan et al., 2012; Tayyebi et al., 2010; Wu, 1998; Yeh et al., 2002). Modeling is an essential tool for analysing and especially for the prediction, of the dynamics of urban growth for the future. Urban growth phenomenon as dynamic process temporally and spatially is subject to uncertainty and ambiguity. This inherent uncertainty cannot be fully addressed by the conventional methods based on the Boolean algebra. As urban dynamics are the product of both physical constraints and human decision-making behavior are characterized by ambiguity and uncertainty, the use of fuzzy logic is highly suitable for defining the rules controlling urban development (Al-Ahmadi
et al., 2009). Fuzzy logic can be employed to overcome this limitation. Fuzzy logic preserves the continuity of dynamic urban growth spatially by choosing fuzzy membership functions, fuzzy rules and the fuzzification-defuzzification process. Fuzzy logic theory has been proposed by Zadeh (1965) as an extension to the binary crisp set theory which deals with classification of elements or phenomena that have continuous values. Mimicking the continuous and non-deterministic nature of most complex processes, including urban growth and development, fuzzy logic theory fits the urban growth problem as a representation of inherited semantic knowledge to represent its gradual effect both spatially and temporally (Liu et al., 2003). The application of fuzzy logic to spatial problems in general and land suitability modeling in particular has several advantages over the conventional methods (Malczewski, 2004).
Although the fuzzy logic approach to land-use suitability modeling is shown to have fewer limitations than conventional techniques, the approach is not without problems. Fuzzy membership functions as one of the most important components of fuzzy logic are rather subjective and depend on the expert. Therefore, there is a need to tune and optimize the membership functions and select their most efficient parameters. In this case, the use of optimization algorithms ISPRS Annals of the Photogrammetry, Remote Sensing and Spatial Information Sciences, Volume I-2, 2012
such as genetic algorithms (GAs) can be regarded as the most efficient way to optimize the membership function parameters. The use of genetic algorithms for designing fuzzy system parameters provides them with the learning and adaptation capabilities and genetic fuzzy systems (GFSs) (Herrera, 2008). This paper intends to present an integration of genetic algorithms and fuzzy logic as a genetic fuzzy system (GFS) as an artificial intelligence and a rule-based method that aims at employing a framework for addressing vague and uncertain nature of urban growth phenomenon by using linguistic variables and reducing the requirement to the expert by calibrating membership function parameters by applying genetic algorithms as optimization tools. The proposed model is applied for modeling urban growth in Tehran Metropolitan Area in Iran in an interval of 11 years between 1988 and 1999. The produced suitability map has been validated using Relative Operating Characteristic (ROC) parameter. Using overall map accuracy (OMA) and kappa statistic index, the best threshold value for simulating ground truth have been extracted.
2. THE STUDY AREA
Tehran Metropolitan Area in north of Iran is considered as the study area for modeling urban growth. Tehran Metropolitan Area as has been witnessed an accelerated rate of urban growth especially over the last three decades. Figure 1 shows the changes in population of Tehran Metropolitan Area during 1956 to 2006. Concomitant with the fast change in the population, Tehran Metropolitan Area was witness to a vast growth in its urban areas. This fast change in the population may lead to a vast growth in urban area which is mainly due to concentration of the national government organizations and of commercial, financial, cultural and educational activities in Iran that resulted high rate of migration and land use changes.
Figure 1. Population of Tehran Metropolitan Area during 1956-2006
Registration errors were about 0.50 pixels. In addition, combinations of RGB bands of LANDSAT images were performed to prepare satellite imageries for better classification. After rectifying and registering the images, the next step is classification of the outcomes which are the inputs to the integration of genetic algorithms and fuzzy logic as genetic fuzzy systems (GFSs). For classification of Landsat imagery data, the Anderson Level I must be employed (Anderson et al., 1976); Therefore, all land use and land cover classes of Tehran were based on this classification standard. Four classes are defined based on support vector machines (SVMs) classification system namely road, urban, vegetation area and barren. In addition to these classified land uses, Digital Elevation Model (DEM) of Tehran at 90 m resolution is used. These parameters are considered as effective urban growth variables.
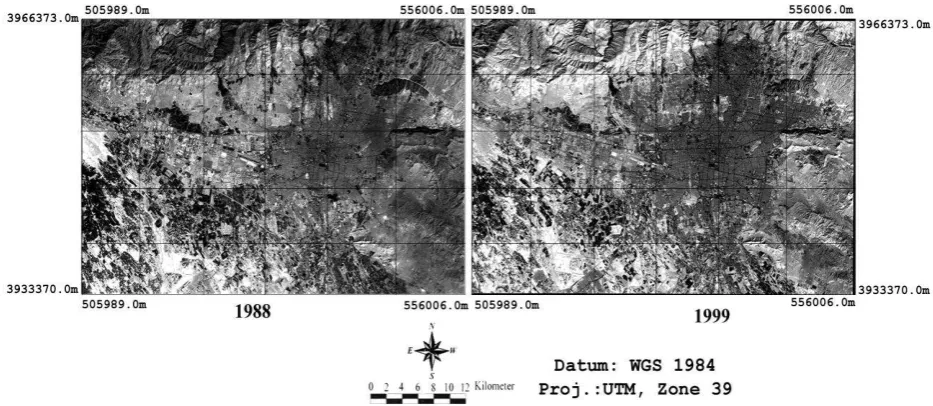
Figure 2. Satellite images of Tehran Metropolitan Area in 1988, 1999, respectively
The data that have been used for calibration and simulation include two historical satellite images covering a period of 11 years. These raw images include two 28.5 m resolution ETM+ images of the years 1988 and 1999 (Figure 2). These images were geometrically rectified and registered to the Universal Transverse Mercator (UTM) WGS 1984 Zone 39N.
3. IMPLEMENTATION
Urban growth phenomenon as an intricate spatio-temporal process can be regarded as a function of human factors, natural and social effects. From the natural and social point of view, suitability for urban growth is considered as the most important factor which has to be addressed. In the one hand, factors such ISPRS Annals of the Photogrammetry, Remote Sensing and Spatial Information Sciences, Volume I-2, 2012
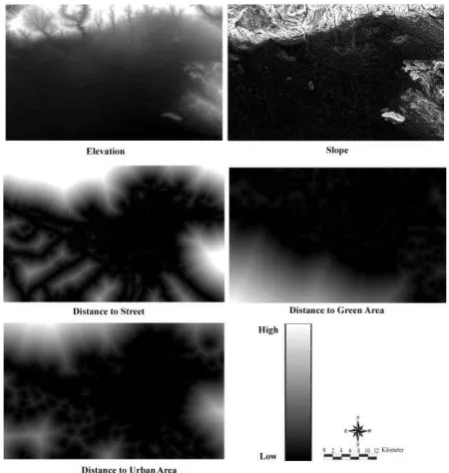
as accessibility to urban areas, streets and vegetation areas as facility parameters and on the other hand, suitability of areas for converting to urban areas which regarded as topography must be considered. Topography is an influential factor playing an important role to utilize building areas. Therefore, in this research we have considered these parameters as main physical driving forces of urban growth indicated in Eq. (1):
, ,
ij ij ij
Urb Str Grn ij ij
GS = f(D ,D ,D Slp Elv )
ij
(1)
Where GS
ij is growth suitability of cell ij and
ij
Urb
D
,
DStrij,
DGrnijare spatial distances between non-urbancell ij and the nearest urban, street, and green areas cells and
ij
Slp , Elvij are slope and elevation of the terrain of the cell ij, respectively. Figure 3 shows the normalized map of these parameters.
Figure 3. The normalized maps of input variables of the model
fis a Mamdani fuzzy inference system which is composed of a set of rules and membership functions. This fuzzy interface system as the most commonly used fuzzy methodology is employed for the fuzzification-defuzzification process to compute the output variable, which is urban growth suitability. The fuzzification-defuzzification process is described as follows. Based on urban growth driving forces maps for each non-urban pixel, five normalized values can be extracted as inputs of model including distance to urban areas, distance to street, and distance to green areas, elevation and slope. These values are entered into their corresponding fuzzy membership functions and based on the defined fuzzy rules, the degree of membership or the fuzzy output for each non-urban pixel is calculated. The final step is to defuzzify the fuzzy output to a single crisp value representing the urban growth suitability. There are several defuzzification methods, however, the most popular one seems to be the centroid technique (Tsoukalas et al., 1996).
In case of fuzzy rules, we can take into consideration a set of relevant rules. These rules are as follows:
1. If (D to Urb is Near) and (Slp is Low) and (Elv is Low) then (GS is High).
2. If (D to Urb is Near) and (Slp is Medium) and (Elv is Low) then (GS is High).
3. If (D to Urb is Near) and (Slp is High) and (Elv is Low) then (GS is Low).
4. If (D to Urb is Near) and (Slp is Low) and (Elv is Medium) then (GS is High).
5. If (D to Urb is Near) and (Slp is Low) and (Elv is High) then (GS is High).
6. If (D to Urb is Medium) and (Slp is Low) and (Elv is Low) then (GS is Medium).
7. If (D to Urb is Medium) and (Slp is Medium) and (Elv is Medium) then (GS is Medium).
8. If (D to Urb is Far) and (Slp is and (Elv is Low) then (GS is Low).
9. If (D to Urb is Far) and (Slp is Medium) and (Elv is Medium) then (GS is Low).
10. If (D to Urb is Far) and (Slp is High) and (Elv is High) then (GS is Low).
11. If (D to Urb is Near) and (D to Str is Near) and (Slp is Low) and (Elv is Low) then (GS is High).
12. If (D to Urb is Near) and (D to Str is Near) and (Slp is Medium) and (Elv is Low) then (GS is High).
13. If (D to Urb is Near) and (D to Str is Near) and (Slp is High) and (Elv is High) then (GS is Low).
14. If (D to Urb is Medium) and (D to Str is Medium) and (Slp is Medium) and (Elv is Medium) then (GS is Medium).
15. If (D to Urb is Medium) and (D to Str is Medium) and (Slp is High) and (Elv is High) then (GS is Low).
16. If (D to Urb is Far) and (D to Str is Far) and (Slp is High) and (Elv is High) then (GS is Low).
17. If (D to Grn is Near) and (D to Urb is Near) (D to Str is Near) and (Slp is Low) and (Elv is Low) then (GS is High).
18. If (D to Grn is Medium) and (D to Urb is Near) (D to Str is Near) and (Slp is Low) and (Elv is Low) then (GS is High).
19. If (D to Grn is Far) and (D to Urb is Near) (D to Str is Near) and (Slp is Low) and (Elv is Low) then (GS is High).
where D, Urb, Str, Slp, Elv and GS stand for distance, urban, street, slope, elevation and growth suitability, respectively.
3.1 Genetic fuzzy systems
A fuzzy system can be considered as a system, which needs to be optimized for increasing its performance for a specific application. Generally, a genetic fuzzy system (GFS) is a fuzzy system augmented by a learning process based on evolutionary computation algorithms in which an evolutionary algorithm is employed to learn or tune different components of a fuzzy rule-based system (Sanz et al., 2011) (Figure 4). The goal of genetic fuzzy systems is coding its structure to a set of parameters and optimizing these parameters by employing genetic algorithms. Generally, this optimization can be done in scaling function and fuzzy membership function or weight fuzzy rules. In case of adjusting scaling function or fuzzy membership function it called genetic tuning process (Herrera, 2008).
Input Interface Based System Fuzzy Rule Output Interface
Figure 4. Genetic fuzzy systems structure (Herrera, 2008)
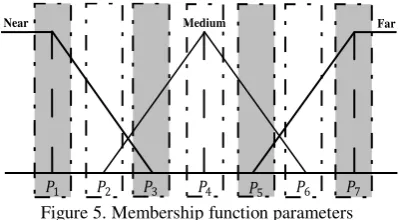
In this research, genetic tuning process is employed in order to adjust parameters of the fuzzy triangular membership functions. The proposed GFS model for urban growth modeling includes five inputs and one output. The input variables include the spatial distances, slope and elevation of the terrain. For the spatial distances, three fuzzy linguistic labels can be
considered namely “Near”, “Medium” and “Far” that
correspond to their triangular membership functions. In case of the slope and elevation, “Low”, “Medium” and “High” can be genetic algorithm tuning process. The general procedure of this algorithm is as follows:
Select parents for reproduction Perform recombination and mutation
Evaluate
Loop
For applying genetic algorithms to find an optimal solution we need to consider the following four principal problems (Kim et al., 2002).
3.1.1 Chromosome representation
As mentioned, we have (7×6) 42 parameters which must be calibrated. The encoding system which used in this research is value encoding system. This encoding system uses real value of the variable to which it corresponds. Therefore, an individual can be represented as a vector of real numbers. The proposed population size is 10 which mean that the population is a matrix of 70×6, includes 10 vectors with size of 6.
3.1.2 Initial population generation Characteristic (ROC), a quantitative parameter which is used to evaluate the suitability map of the urban growth by measuring the relationship between the simulated change and real change (Pontius et al., 2001). By using this parameter, there is no need to assign a predefined threshold value for generating simulated land use map and therefore, this method is known as threshold-independent method (Beguería, 2006). Employing a series of thresholds, a series of simulated land use map will be generated from suitability map. By comparing these simulated land use maps and real land use map, a series of confusion matrices can be generated (Table 1) (Pontius and Schneider, 2001): two dimensional graph, generate a curve whose the area under the curve (AUC) indicates the value of ROC (Eq. (6)) (Pontius and Schneider, 2001): new offspring which possesses the characteristics of both parents. In this work the arithmetic crossover with the rate of 0.6 is employed. Afterward the mutation operator must be ISPRS Annals of the Photogrammetry, Remote Sensing and Spatial Information Sciences, Volume I-2, 2012
applied in order to maintain diversity in the population set by deliberately changing some strings and prevents the solution from being trapped in local minima. The mutation rate of 0.3 is applied to the population by generating a set of random integer numbers between zero and one as solutions, like initial population.
4. RESULTS AND DISCUSSION
By employing genetic fuzzy algorithm for improving the efficiency of the fuzzy system for calibrating the fuzzy membership functions, a calibrated suitability map is produced shown in Figure 6. The ROC value of this suitability map is calculated 0.94.
Figure 6. The calibrated normalized urban growth suitability map
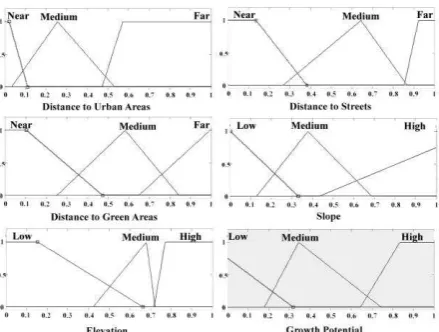
This calibrated suitability map can be generated by optimized parameters of fuzzy membership functions as shown in Figure 7.
Figure 7. Calibrated fuzzy membership functions of inputs and output
For extracting a land use map from the calibrated suitability map, a threshold value is required. A series of threshold values between 0 and 1 by 0.01 interval are applied into the calibrated suitability map. Each threshold value generates a simulated land use map which can be compared with the real land use map. Comparison is made using quantitative parameters namely overall map accuracy (OMA) calculated using on Eq. (7) (Pontius and Schneider, 2001) and kappa statistic (KS) calculated using Eq. (8) (Hagen, 2003)
D factors. First, during the modeling process, the calibration and validation data set were the same. This could lead to correlation between data and therefore increases the accuracy of modeling. Second, aside from the correlation, employing genetic fuzzy algorithms can extract the proper parameters for the membership function which therefore increases the modeling accuracy. phenomenon using linguistic variables and labels. The definition of the fuzzy membership function parameters can be identified empirically by an experiment involving human subjective. However, there is a need to optimize these parameters in order to improve the efficiency of the fuzzy logic. Therefore, a Genetic fuzzy system (GFS) has been employed in order to use the genetic algorithm abilities to optimize the fuzzy logic parameters. In this research a genetic tuning process has been applied in order to optimize the fuzzy membership function parameters to generate a calibrated urban growth suitability map. ROC value of 0.94 indicates that the suitability map is valid and can be used for predicting future urban growth dimensions and patterns.
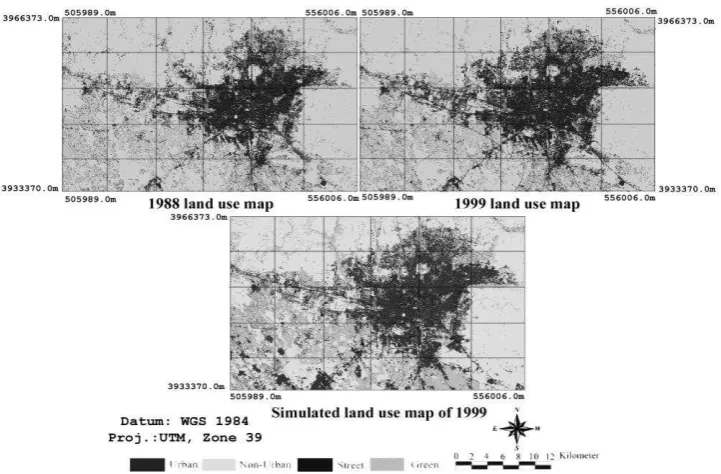
Figure 8. The real and simulated land use map of Tehran Metropolitan Area from 1988 to 1999
References
Al-Ahmadi, K., See, L., Heppenstall, A., and Hogg, J. (2009). Calibration of a fuzzy cellular automata model of urban dynamics in Saudi Arabia. Ecological Complexity, 6(2), 80-101.
Anderson, J. R., Hardy, E. E., Roach, J. T., and Witmer, R. E. (1976). A land use and land cover classification system for use with remote sensor data. Geological Survey Professional Paper 964. US Geological Survey Circular, 671, 7-33.
Beguería, S. (2006). Validation and evaluation of predictive models in hazard assessment and risk management.
Natural Hazards, 37(3), 315-329.
Clarke, K. C., Hoppen, S., and Gaydos, L. (1997). A self-modifying cellular automaton model of historical urbanization in the San Francisco Bay area.
Environment and Planning B, 24, 247-262.
Foroutan, E., and Delavar, M. R. (2012). Urban Growth Modeling Using Genetic Algorithms And Cellular Automata; A Case Study of Isfahan Metropolitan Area, Iran. Paper presented at the GIS Ostrava 2012, Ostrava, Czech Republic.
Hagen, A. (2003). Multi-method assessment of map similarity.
International Journal of Geographical Information Science, 17(3), 235-249.
Herrera, F. (2008). Genetic fuzzy systems: taxonomy, current research trends and prospects. Evolutionary Intelligence, 1(1), 27-46.
Kim, D., Choi, Y. S., and Lee, S. Y. (2002). An accurate COG defuzzifier design using Lamarckian co-adaptation of learning and evolution. Fuzzy sets and systems, 130(2), 207-225.
Liu, Y., and Phinn, S. R. (2003). Modelling urban development with cellular automata incorporating
fuzzy-set approaches. Computers, Environment and Urban Systems, 27(6), 637-658.
Malczewski, J. (2004). GIS-based land-use suitability analysis: a critical overview. Progress in Planning, 62(1), 3-65.
Pijanowski, B. C., Tayyebi, A., Delavar, M., and Yazdanpanah, M. (2009). Urban expansion simulation using geospatial information system and srtificial neural networks. International Journal of Environmental Research, 3(4), 493-502.
Pontius, R. G., and Schneider, L. C. (2001). Land-cover change model validation by an ROC method for the Ipswich watershed, Massachusetts, USA. Agriculture, Ecosystems & Environment, 85(1-3), 239-248. Sanz, J., Fernández, A., Bustince, H., and Herrera, F. (2011).
A genetic tuning to improve the performance of Fuzzy Rule-Based Classification Systems with Interval-Valued Fuzzy Sets: Degree of ignorance and lateral position. International Journal of Approximate Reasoning, 52(6), 751-766.
Tayyebi, A., Delavar, M. R., Yazdanpanah, M. J., Pijanowski, B. C., Saeedi, S., and Tayyebi, A. H. (2010). A Spatial Logistic Regression Model for Simulating Land Use Patterns: A Case Study of the Shiraz Metropolitan Area of Iran. Advances in Earth Observation of Global Change, Chapter 3, 27-42, Springer.
Tsoukalas, L. H., and Uhrig, R. E. (1996). Fuzzy and neural approaches in engineering: John Wiley & Sons, Inc. Wu, F. (1998). Simulating urban encroachment on rural land
with fuzzy-logic-controlled cellular automata in a geographical information system. Journal of Environmental Management, 53(4), 293-308. Yeh, A. G. O., and Li, X. (2002). Urban simulation using
neural networks and cellular automata for land use planning. Paper presented at the The Symposium on Geospatial Theory, Processing and Applications, Ottawa, Canada.
Zadeh, L. A. (1965). Fuzzy sets. Information and Control, 8(3), 338-353.