76
LAMPIRAN 1
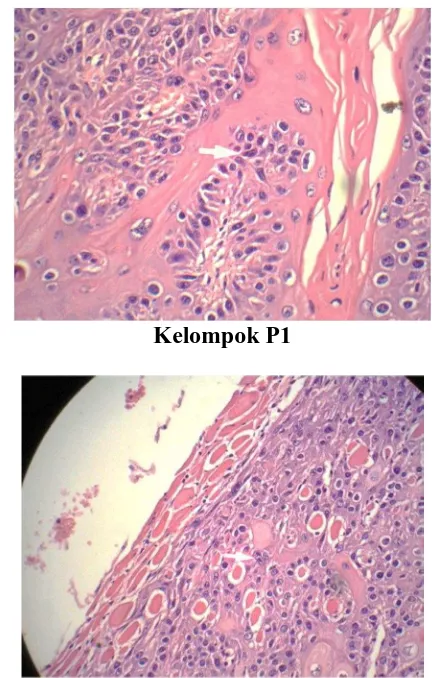
Gambar / foto sel mitosis pada jaringan karsinoma epidermoid (anak panah merah
dengan perbesaran 400x)
Kelompok kontrol
Kelompok P1
77
LAMPIRAN 2
Analisa Statistik Perubahan Diameter Tumor
Case Summaries
Selisih diameter tumor
3 1.1000 .26458 1.0000 .90 1.40
3 .4333 .25166 .4000 .20 .70
3 .4000 .10000 .4000 .30 .50
3 -.2667 .20817 -.2000 -.50 -.10
12 .4167 .53739 .4000 -.50 1.40
Kelompok
N Mean Std. Deviation Median Minimum Maximum
Case Summaries
3 3
1.3000 2.4000 1.47986 1.34536 .6000 2.0000
.30 1.30
3.00 3.90
3 3
.5667 1.0000 .55076 .78102
.3000 .6000
.20 .50
1.20 1.90
3 3
1.1000 1.5000 1.47986 1.57162
.4000 .8000
.10 .40
2.80 3.30
3 3
.9667 .7000
1.15902 .95394
.4000 .2000
.20 .10
2.30 1.80
12 12
.9833 1.4000 1.08362 1.22771 .4000 1.0500
.10 .10
3.00 3.90
N Mean
Std. Deviation Median Minimum Maximum N
Mean
Std. Deviation Median Minimum Maximum N
Mean
Std. Deviation Median Minimum Maximum N
Mean
Std. Deviation Median Minimum Maximum N
Mean
Std. Deviation Median tumor pre test
Diameter tumor post
78
NPar Tests Kruskal-Wallis Test
Tests of Normality
.314 3 . .893 3 .363
.219 3 . .987 3 .780
.175 3 . 1.000 3 1.000
.292 3 . .923 3 .463
Kelompok K P1 P2 P3 Selisih diameter tumor
Statistic df Sig. Statistic df Sig. Kolmogorov-Smirnova Shapiro-Wilk
Lilliefors Significance Correction a.
Test of Homogeneity of Variances
Selisih diameter tumor
1.129 3 8 .394
Levene
79
Mann Whitney Test
Test Statisticsb
.000 6.000 -1.964 .049
.100a Mann-Whitney U
Wilcoxon W Z
Asymp. Sig. (2-tailed) Exact Sig. [2*(1-tailed Sig.)]
Tumor diameter diference
Not corrected for ties. a.
Grouping Variable: Group b.
Test Statisticsb
.000 6.000 -1.964 .049
.100a Mann-Whitney U
Wilcoxon W Z
Asymp. Sig. (2-tailed) Exact Sig. [2*(1-tailed Sig.)]
Tumor diameter diference
Not corrected for ties. a.
80
Test Statisticsb
.000 6.000 -1.964 .049
.100a Mann-Whitney U
Wilcoxon W Z
Asymp. Sig. (2-tailed) Exact Sig. [2*(1-tailed Sig.)]
Tumor diameter diference
Not corrected for ties. a.
81
Test Statisticsb
.000 6.000 -1.964 .049
.100a Mann-Whitney U
Wilcoxon W Z
Asymp. Sig. (2-tailed) Exact Sig. [2*(1-tailed Sig.)]
Tumor diameter diference
Not corrected for ties. a.
Grouping Variable: Group b.
Test Statisticsb
.000 6.000 -1.964 .049
.100a Mann-Whitney U
Wilcoxon W Z
Asymp. Sig. (2-tailed) Exact Sig. [2*(1-tailed Sig.)]
Tumor diameter diference
Not corrected for ties. a.
82
LAMPIRAN 3
Analisa Statistik Indek Mitosis
NPar Tests
Kruskal-Wallis Test
Case Summaries
Index mitosis
3 3.2000 .34641 3.4000 2.80 3.40
3 1.1333 .11547 1.2000 1.00 1.20
3 1.0667 .11547 1.0000 1.00 1.20
3 .6667 .11547 .6000 .60 .80
12 1.5167 1.04606 1.1000 .60 3.40
Kelompok
N Mean Std. Deviation Median Minimum Maximum
Tests of Normality
.385 3 . .750 3 .000 Index mitosis
Statistic df Sig. Statistic df Sig.
Kolmogorov-Smirnova Shapiro-Wilk
Lilliefors Significance Correction a.
Test of Homogeneity of Variances
Index mitosis
5.333 3 8 .026
Levene
Statistic df1 df2 Sig.
Ranks Index mitosis
83
NPar Tests
Mann-Whitney Test
NPar Tests
Mann-Whitney Test
Test Statisticsa,b9.804 3 .020 Chi-Square
df
Asymp. Sig.
Index mitosis
Kruskal Wallis Test a.
Grouping Variable: Kelompok b. Index mitosis
N Mean Rank Sum of Ranks
Ranks Index mitosis
N Mean Rank Sum of Ranks
Test Statisticsb
.000 6.000 -2.023 .043 .100a Mann-Whitney U
Wilcoxon W Z
Asymp. Sig. (2-tailed) Exact Sig. [2*(1-tailed Sig.)]
Index mitosis
Not corrected for ties. a.
84
NPar Tests
Mann-Whitney Test
NPar Tests
Mann-Whitney Test
Ranks Index mitosis
N Mean Rank Sum of Ranks
Test Statisticsb
.000 6.000 -2.023 .043 .100a Mann-Whitney U
Wilcoxon W Z
Asymp. Sig. (2-tailed) Exact Sig. [2*(1-tailed Sig.)]
Index mitosis
Not corrected for ties. a.
Grouping Variable: Kelompok b. Index mitosis
85
NPar Tests
Mann-Whitney Test
Test Statisticsb3.000 9.000 -.745 .456 .700a Mann-Whitney U
Wilcoxon W Z
Asymp. Sig. (2-tailed) Exact Sig. [2*(1-tailed Sig.)]
Index mitosis
Not corrected for ties. a.
Grouping Variable: Kelompok b. Index mitosis
N Mean Rank Sum of Ranks
Test Statisticsb
.000 6.000 -2.023 .043 .100a Mann-Whitney U
Wilcoxon W Z
Asymp. Sig. (2-tailed) Exact Sig. [2*(1-tailed Sig.)]
Index mitosis
Not corrected for ties. a.
86
NPar Tests
Mann-Whitney Test
Ranks Index mitosis
N Mean Rank Sum of Ranks
Test Statisticsb
.000 6.000 -2.023 .043 .100a Mann-Whitney U
Wilcoxon W Z
Asymp. Sig. (2-tailed) Exact Sig. [2*(1-tailed Sig.)]
Index mitosis
Not corrected for ties. a.
87
LAMPIRAN 4
Uji Korelasi Selisih Diameter Tumor dan Indek Mitosis
Explore
Nonparametric Correlations
Case Summaries12 12
.4167 1.5167
.53739 1.04606
.4000 1.1000
-.50 .60
1.40 3.40
N Mean
Std. Deviation Median Minimum Maximum
Selisih diameter
tumor Index mitosis
Tests of Normality
.105 12 .200* .988 12 .999
.369 12 .000 .742 12 .002
Selisih diameter tumor Index mitosis
Statistic df Sig. Statistic df Sig.
Kolmogorov-Smirnova Shapiro-W ilk
This is a lower bound of the true significance. *.
Lilliefors Significance Correction a.
Correlations
1.000 .813**
. .001
12 12
.813** 1.000
.001 .
12 12
Correlation Coefficient Sig. (2-tailed) N
Correlation Coefficient Sig. (2-tailed) N
Selisih diameter tumor
Index mitosis Spearman's rho
Selisih diameter
tumor Index mitosis
88
LAMPIRAN 5
Patologi Anatomi Sampel, Ukuran Diameter Tumor Pre dan Post Perlakuan, Indek
Mitosis Post Perlakuan
SCORING INDEX M ITOSIS DALAM 5 LAPANG
PANDANG BESAR HASIL PATOLOGI ANATOM I
KELOM POK I II III IV V M ean
Kont rol
A 4 3 3 5 2 3.4 SQUAM OUS CELL CA WELL
DIFFERENTIATED
B 2 3 4 3 2 2.8 SQUAM OUS CELL CA Insit u
C 4 3 2 3 5 3.4 SQUAM OUS CELL CA Insit u
m ean 3.2
P1
A 1 2 1 1 1 1.2
KERATOACANTOM A DENGAN SQUAM OUS CELL CA
M IKROINVASIF
B 0 1 2 1 1 1 PAPILOM A CELL SQUAM OUS
DENGAN FOKUS CA
C 3 1 1 1 0 1.2 SQUAM OUS CELL CA Insit u
M ean 3.4
P2
A 1 1 1 0 2 1 SQUAM OUS CELL CA WELL
DIFF DENGAN NEKROSIS LUAS
B 2 2 0 1 1 1.2 SQUAM OUS CELL CA WELL
DIFFERENTIATED
C 1 0 2 2 0 1 SQUAM OUS CELL CA WELL
DIFFERENTIATED
m ean 1.06
P3
A 0 1 1 2 0 0.8 SQUAM OUS CELL CA WELL
DIFFERENTIATED
B 1 0 0 1 1 0.6 SQUAM OUS CELL CA Insit u
C 1 1 0 1 0 0.6 SQUAM OUS CELL CA INSITU +
M IKROINVASIF
89
Data Ukuran Diameter Tumor Pre dan Post Perlakuan
Kelompok
Diameter
tumor pre test
(cm)
Diameter
tumor post
test (cm)
Selisih diameter
tumor (cm)
Kontrol
A
3
3,9
0,9
Keterangan :
K
: Kontrol
P1
: Phaleria macrocarpa 0,0715 mg (0,36 ml/hari).
P2
: sitostatika Paclitaxel 175 mg/m
2dan cisplatin 50 mg/m
2P3
: sitostatika Paclitaxel 175 mg/m
2dan cisplatin 50 mg/m
2dan dikombinasikan
dengan Phaleria macrocarpa 0,0715 mg (0,36 ml/hari)
A
: tanda asam pikrat pada mencit di kepala
B
: tanda asam pikrat pada mencit di kaki depan
90
LAMPIRAN 6
Foto Mencit yang Diinduksi Tumor, Perlakuan, dan Pengukuran Tumor
Gambar. Mencit yang diinduksi
karsinoma epidermoid
Gambar. Pemberian Phaleria macrocarpa
via sonde
Gambar. Penyuntikan sitostatika
91
LAMPIRAN 7
92