ANALYSIS
A simple bioeconomic model of a marine reserve
John C.V. Pezzey
a,*, Callum M. Roberts
b, Bjorn T. Urdal
c aCentre for Resource and En6ironmental Studies,Australian National Uni6ersity,Canberra,ACT0200,AustraliabEn6ironment Department,Uni6ersity of York,York YO10 5DD,UK cDepartment of Economics,Uni6ersity College London,London WC1E6BT,UK Received 5 February 1999; received in revised form 3 September 1999; accepted 9 September 1999
Abstract
We model the effect of a no-take reserve in a marine fishery management area, such as on a coral reef. Implicitly, eggs and larvae are mobile but adults are not; and there is open access fishing outside the reserve. A reserve is found to increase equilibrium catch if the prior ratio of stock to carrying capacity is less than a half, and the catch-maximising reserve proportion rises towards a half as this ratio falls towards zero. After initial adjustment, long-run stability is improved by a reserve. We estimate that coral reef reserves could increase world wide annual catches by about a billion dollars. © 2000 Elsevier Science B.V. All rights reserved.
Keywords:No-take marine reserves; Bioeconomic equilibrium; Open access fishing; Coral reefs
Nomenclature
a rate of adjustment of effort to rent (person/$) relative cost of catching fish (:=w/pc) (1)
j
fishing effort (person)
E
G(.) natural growth function (t/year)
R fish catch (t/year)
proportion of management area that is fishing ground (1)
KF
proportion of management area that is reserve (1)
KR
p price of fish ($/t)
q catchability parameter for R=qES model (1/person year)
www.elsevier.com/locate/ecolecon
* Corresponding author. Tel.: +61-2-6249-4143; fax: +61-2-6249-0757. E-mail address:[email protected] (J.C.V. Pezzey)
c catchability parameter for R=cES/K model (t/person year) intrinsic growth rate of fish biomass (per year)
r
w unit cost of effort ($/person year)
S stock on total management area (t) stock on fishing ground (t)
SF
stock on reserve (t)
SR
open access equilibrium
O
O* open access equilibrium with maximal size of reserve
1. Introduction
Following sustained interest from policymak-ers, recent years have seen a number of biological or bioeconomic models examining effects of ‘no-take’ marine reserves, where fishers are perma-nently banned from designated parts of a total fishing management area (Polacheck, 1990; Holland and Brazee, 1996; Sanchirico and Wilen, 1996, 2000; Brown and Roughgarden, 1997; Hannesson, 1998; Lauck et al., 1998; Conrad, 1999). Here we develop another model whose main features are its minimal data requirements, its analytical simplicity, and its relevance to wide-spread problems of coral reef fisheries. Such fisheries provide about 6 – 7% or 6 Mt/year of world catches (Munro, 1996), worth about 18 billion US dollars per year, and are an important source of food for the typically poor, developing nations that most reefs surround (Birkeland, 1997). Many reef fisheries now suffer from a ‘tragedy of open access’, with widespread and severe stock depletion as human populations have expanded and unmanaged fishing pressure has grown (McManus, 1996). Overfishing has not only reduced overall fish stocks, but also trans-formed fish stocks from diverse communities dominated by large, high value carnivorous spe-cies, to impoverished communities of small, low value fish (Roberts, 1995a; Jennings and Lock, 1996).
Efforts to reverse this trend using conventional fishery management approaches have usually failed (Polunin and Roberts, 1996). Coral reefs support the most diverse fish assemblages on the planet, and catches are obtained using gears with
low selectivity. For example, at least 60 species are caught in trap fisheries of Caribbean reefs (Rakitin and Kramer, 1996). The sophisticated fishery management schemes usually recom-mended by resource economics, such as taxes, catch quotas, effort or gear restrictions, have proved difficult to implement in reef fisheries be-cause of this diversity (Munro, 1996). Related problems are the pervasive lack of data on types and costs of effort, and on catches and their composition by species, which is typical of small developing countries (Russ, 1991), and the few resources there available for enforcement. No-take reserves are promising in this respect, since checking that no one is fishing on a reserve is about the simplest possible scheme to enforce, and data requirements for effective management are low. So it should be an acceptable approxima-tion to ignore reserve enforcement and informa-tion costs, as we do here. In practice marine reserves are often combined with community-based management methods to redirect fishing effort to other locations or occupations (see Feeny et al., 1996 for further discussion). We will see later that dynamic adjustment problems indeed make these approaches desirable, but for simplic-ity our model leaves them out.
We will compare our model to existing ones in detail as we develop it, but some further features are worth highlighting here. Firstly, whether or not a reserve is created, fishers are assumed to have pure open access1to any fishing ground (the
area not in the reserve), and thus to dissipate all rent (profit) in equilibrium.
Secondly, our model is based on an ad hoc growth function which implicitly reflects two age classes with completely different movements, as in Brown and Roughgarden (1997): eggs and larvae, which are dispersed evenly throughout the reserve and fishing ground, and adults, which do not migrate at all. These are appropriate assumptions for coral reef fish, and also most shellfish such as abalone, scallops and clams, and some demersal fish. They might also be empirically acceptable approximations for the whole systems of marine reserves now being suggested (McGlade et al., 1997; Halfpenny and Roberts, 1998) to protect overfished migratory species in temperate areas such as the North Sea. This is why we call our model one of a ‘marine’ reserve, not just a ‘reef’ reserve; though clearly there are many existing or proposed marine reserves, particularly in temper-ate wtemper-aters, to which it would not apply. Finally, for simplicity, the model is spatially homoge-neous, and so ignores biological variation within a management area.
It is the combination of open access fishing economics, (implicitly) age-dependent dispersal, and analytical simplicity which distinguishes our model from other models of marine reserves. We derive a simple analytic formula, requiring only two data points for any management area, for the proportional size of a reserve which maximises sustainable catch. In Section 2, we develop the model, compare its assumptions to those of other models, derive its equilibrium theoretical proper-ties, and consider their empirical plausibility in three Caribbean locations; data are not yet avail-able to test them completely. In Section 3, we simulate the dynamic effects of reserve creation and Section 4 concludes.
2. A modified Schaefer – Gordon model of the equilibrium of a marine fishery reserve
Here we describe our model in Sections 2.1 and 2.3, compare it to other models in Section 2.4, briefly consider a couple of important ‘off-model’ effects in Section 2.5, and then consider some
empirical applications in Section 2.6. We start with the standard Schaefer – Gordon assumptions of neglecting both the age structure of fish popu-lations, and the complex ecological interdepen-dencies within coral reefs, such as predator – prey relationships and inter- or intra-specific competi-tion among organisms. Instead we assume a sin-gle, undifferentiated fish biomass and then make two key modifications, as follows.
2.1. Dependence of carrying capacity on area,
and of catch on density
A standard assumption is that the carrying capacityKfor the biomass of a certain fish species is determined once the species and a broad geo-graphical area are defined: for example, the North Sea Herring, or the Pacific Whiting in Conrad (1995). Another is that the catch (often, if rather inappropriately, called harvest) R(in tonnes/year, say) per unit of fishing effortEis proportional to the total fish stock S (in tonnes), irrespective of the sea area over which the stock is spread: R= qES, whereqis the catchability parameter (Clark, 1990). Neither assumption is appropriate for coral reefs, where the dominant fish species are largely non-migratory as adults and tied to small areas of reef (Polunin and Roberts, 1996). So instead we assume that the carrying capacity K for biomass (of any species) of a given sea surface area of a reef is proportional to its areaA, and that catchR
from the reef per unit effort E expended is pro-portional to the areal stock density S/A. The catch function then becomes
R=cES/K, (1)
wherec is a catchability parameter with different size and units fromq, andS/Kis the stock density (in relation to carrying capacity) of the area.
2.2. The ecological linkage between reser6e and
fishing ground
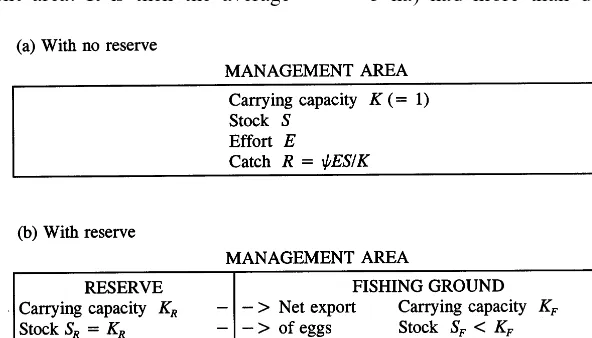
A reserve (denotedR) of carrying capacityKRis
created within a total management area of capac-ity K, which is normalised to 1, soKRalso
management area has carrying capacityKF=1−
KR. The stocks on the management area, reserve
and fishing ground are, respectively, S, SR, and
SF=S−SR, as depicted in Fig. 1. The
manage-ment area is spatially homogeneous, so the reserve can be anywhere in it and need not be contiguous; we say nothing about edge effects or the optimal shape of the reserve. The scaleK of the manage-ment area also plays no role in the model, but in practice there will be both a minimum worthwhile scale, below which relative enforcement costs be-come excessive; and a maximum worthwhile scale, probably exceeding tens of kilometres for coral reefs, above which the dispersal effects mentioned below would be weaker (Roberts, 1997b).
The model then has to describe the ecological linkages between reserve and fishing ground in some way. There are three main linkages:
1. The density of (adult) fish in the reserve will rise after fishing is banned there. This causes greater egg production per unit of reef area, and net export of eggs and larvae via pelagic dispersal to the surrounding fishing ground (Bohnsack, 1992; Sluka et al., 1997; Nowlis and Roberts, 1999). The dispersal of eggs and larvae is actually very complex and remains poorly understood (Boehlert, 1996; Roberts, 1997b), but we follow Nowlis and Roberts (1997) and assume that eggs and larvae are dispersed by sea currents evenly throughout the management area. It is then the average
fish density over the area, which determines egg and larval density in both reserve and fishing ground. However, we ignore the effect of the reserve on fish size. Since larger female fish are much more fecund than smaller ones, egg output per unit biomass will in fact be higher in the reserve (Sluka et al., 1997). In this respect our model will thus understate the reserve’s effect, and we briefly discuss this ‘off-model’ in Section 2.5.
2. There will be some net flow of adult fishes from the reserve to the fishing ground, caused by the greater population density in the re-serve (Rakitin and Kramer, 1996; Russ and Alcala, 1996). However, most studies of coral reef fishes have found that movements of adults and juveniles are limited, even among species for which higher mobility was origi-nally suspected (Holland et al., 1996; Roberts, 1996). Tagging studies suggest high site fidelity and very limited movements (typically tens of metres) with only a few percent of individuals moving out of reserves (Holland et al., 1993; Corless et al., 1999). Reef fishes are especially reluctant to cross areas of sand or open water, and so reserves with their boundaries coincid-ing with reef boundaries will retain almost all of the fish within them (Kramer and Chap-man, 1999; Chapman and Kramer, 1999). An extremely small reserve in St. Lucia (less than 3 ha) had more than double the biomass of
reef fish inside it in adjacent fished areas after only 3 years of protection, suggesting a high level of retention of fish (Roberts and Hawkins, 1997). Our implicit assumption is therefore that adult fish migration is zero be-tween reserve and fishing ground.
3. The reserve will cause changes in species com-position, both within the marine reserve and on the fishing ground, but we ignore these in our model. Fishing pressure can sequentially eliminate species from multispecies stocks on reefs, according to their vulnerability to cap-ture and intrinsic rate of population increase. At low fishing intensities (and hence high stock densities), the biomass is usually dominated by carnivorous species, but these are generally easier to catch because they are bolder and more inquisitive, so they tend to disappear first when fishing intensities increase (Roberts, 1997a). This is economically important since they are larger and more valuable as food, commanding a higher market price per unit weight (Polunin and Roberts, 1993). In Sec-tion 2.5, we also discuss this effect ‘off-model’. We implicitly combine assumption (i) of uni-form dispersal of eggs and larvae with assumption (ii) of completely sedentary adults by modifying the logistic growth function (Clark, 1990) as follows:
Assumption: The absolute rate of natural in-crease of fish biomass in the fishing ground is
GF(XF)=rKF(XF+XR)(1−XF/KF) (2)
whereris the intrinsic growth rate of the biomass. The rationale for this is that the stock relevant to juvenile growth in the fishing ground at rate r is not SF, but KF(SF+SR), since KF is the
propor-tion of the eggs and larvae from the total manage-ment area stock SF+SR which will be in the
fishing ground, given uniform dispersal. But the carrying capacity that ultimately limits growth is that of the fishing ground alone, hence the (1− SF/KF) factor in Eq. (2). Unlike other models of
marine reserves cited in the Introduction, ours has no explicit term for migration between reserve and fishing ground because we assume that the biomass of eggs and larvae that disperse out of the reserve is negligible, and adult fish are
seden-tary. The rationale for formula Eq. (2) is thus rather rough, but not greatly more so than that of the logistic function itself, which does not specify whether S should be population number (May, 1981) or population biomass (Clark, 1990), and does not explicitly take account of growth in body size. Ultimately Eq. (2) is a formula that should be judged on its empirical usefulness. By the same arguments, stock growth in the reserve is assumed to be:
GR(SR)=rKR(SF+SR)(1−SR/KR) (3)
With no catch from the reserve, the equilibrium reserve stock is SR=KR.
From Eq. (1), the catch from the fishing ground is
R=cESF/KF (4)
The fishing ground stock will be in biological equilibrium when growth GF equals catch R.
From Eqs. (2) and (4), with KF=1−KR and
zero rent (profit) in an open access, and denoting open access equilibrium variables by O, rent
=
Maximising catch is thus the same as maximising effort here.
Together, Eq. (4) and Eq. (6) give
RO We call j the relative cost of catching fish (the cost of effort divided by fish price times catchabil-ity). We assume jB1 because j]1 means that fish are not worth catching at all under open access. In the initial open access equilibrium with no reserve,KR=0,SF
O
becomesSO
, which is also the stock density sinceK=1, and Eq. (7) becomes
SO
=j=w/pc. (8)
This initial stock density is in fact the only bio-nomic information needed to find the maximal size of the reserve in this model. Also, note that with or without the reserve, a ceteris paribus reduction in fishermen’s wages or improvement in fishing technology (either of which will lower w) will cause resource degradation (a lower stock density) in the fishing ground.
Eq. (5) is true in any equilibrium, so we can add O superscripts to S
F and E there and
substi-tute forSFO from Eq. (7) to give This predicts the equilibrium effort (and hence catch, from Eq. (6)) given any reserve proportion
KR. It is a negative quadratic in KR, so its local
maximum will also be the global one. The sign of the partial derivative, #EO
/#K
R=[rp(1−j)/w]
[(1−2j)−2(1−j)KR], as both j and KR vary,
shows that if 1/25jB1, a reserve will reduce equilibrium effort and catch, and so is not
worth-while in terms of our objectives. But if jB1/2, a reserve will increase effort and catch until
KR=KRO*:=(1/2−j)/(1−j)
=(1/2−SO)/(1−SO), (10)
where we denote values in maximal (catch-max-imising) open access equilibrium by O*. This
max-imal reserve proportionKRO*rises from 0 to 1/2 as
j falls from 1/2 to 0. For KR\KRO*, effort and
catch fall, becoming the same as in the no-reserve equilibrium when KR=2KRO
*
.
Our main result is thus: If a management area’s initial stock density SO
in relation to carrying capacity is in an open access fishing equilibrium (hence SO
B1), then making a proportion KR of
the area into a no-take marine reserve will in-crease equilibrium catch on the remaining fishing ground if and only if SOB1/2 and 0BK
RB2(1/
2−SO)/(1−SO). Catch will be maximised at the
midpoint of this range, where reserve sizeKR=(1/
2−SO)/(1−SO).
However, as shown below, the dynamic, pre-equilibrium impact of the reserve will be to reduce catch initially, creating an obvious transitional problem for fishermen (and hence fishery man-agers) to overcome.
Henceforth, we assume the initial stock density
SO (
=j)B1/2 unless otherwise stated. This is realistic for reef fisheries that are moderately to heavily exploited (Polunin and Roberts, 1996). Table 1 gives the equilibrium values of stock, effort and catch without the reserve (KR=0) and
with a maximal reserve (KR=KR
O*); open access
stock comes from Eq. (7), effort from Eq. (9), and catch from Eq. (6). Also given are corresponding values for statically (zero-discounting) optimal management by controlling effort to maximise sustainable rent instead of creating a reserve (an approach which we ignored because of its likely information and enforcement costs in coral reef situations).
Appropriate inequalities between the values are also noted: the maximal reserve enables a greater catch than the static optimum (1/4r\1/4(1−
j2)r), but using proportionally more effort (1
/
con-Table 1
Comparison of theoretical equilibrium results
(Static) optimum: No reserve,
max-Variable Maximal reserve plus open access to No reserve, open access imum sustainable rent fishing ground (denotedO*) (denotedO)
(1+j)/2 \
straint of banning fishing on part of the manage-ment area. And there is some empirical evidence for the increase in effort compared to the no-re-serve, open-access equilibrium, for Goodridge et al. (in press) observed an increase in effort follow-ing the creation of reserves in St Lucia, though this was before final equilibrium had been reached. Also, since Eq. (7) gives SFO*/KFO*=jB
1/2, the stock density in the fishing ground is less than half that in the reserve (where SR/KR=1).
So there will indeed be net flow of eggs and larvae from the reserve, although this is only implicit in our model.
2.4. Comparison with existing models
Having set out our model, we can now compare it more precisely to the existing literature. It is the combination of open access fishing economics, age-dependent dispersal, and analytical simplicity that distinguishes our model. Polacheck (1990) examined the effect of permanently closing part of a fishery using a model with several age classes derived from Beverton and Holt (1957), but nei-ther of these models contained any economic ele-ments; neither does Lauck et al. (1998), which models the role of marine reserves in coping with irreducible scientific uncertainty in marine ecosys-tems combined with only probabilistic control of catch levels. Holland and Brazee (1996) included many age classes and maximised the present value of catches, but their maximisation did not allow any economic response of fishing effort to changes in rents. Brown and Roughgarden’s (1997) model was specifically designed for temperate species
such as scallops and clams, but could also be applied to coral reefs since it assumed mobile larvae and stationary adults, as we do. Their model has explicit terms for these two age classes explicitly, so it is technically more sophisticated than ours; but its assumption of (dynamically) optimal fishing management is less applicable to developing country situations, for reasons noted earlier, and results in no recommendation for optimal reserve size.
Other existing models ignore any age effects on migration rates, and are thus less relevant to the coral reefs, but they have many interesting fea-tures which we have ignored. Thus Hannesson (1998) includes discrete as well as continuous time, which allows season length to be studied; Sanchirico and Wilen (1996, 2000) consider source-sink as well as density-dependent systems of migration; and Conrad (1999) extends Homans and Wilen’s (1997) model of regulated open access to include a reserve or sanctuary.
2.5. Does the reser6e gi6e any economic benefit?
Here we consider two ‘off-model’ economic benefits of marine reserves that strengthen the case for them, and point to further research needed. Firstly, consider the reserve’s economic benefit in terms of fishing. The derivation of the maximal reserve size (Eq. (10)) assumed both a constant price of fish (in common with almost all existing models) and a constant unit cost of effort, so indeed there is apparently no net fishing benefit from the increase in catch achieved by the reserve. The higher fish catch gives no benefit to con-sumers because the price of fish does not fall; and the higher effort expended is of no benefit to producers (for example, to fishermen), since the unit payment does not rise. All the reserve achieves in the model is a larger catch from the management area, but with all rent still being dissipated by open access.
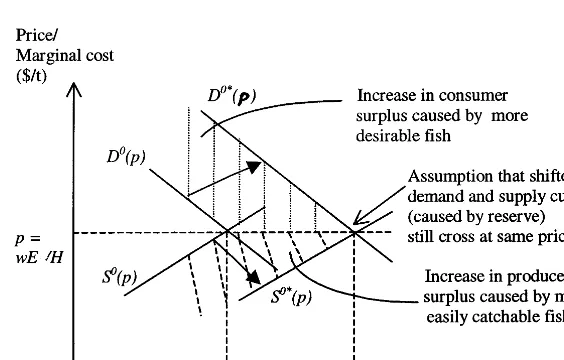
However, a maximal reserve would actually give an economic gain in practice because of four features ignored by our model. Consider Fig. 2, where as before the no-reserve equilibrium is de-notedO, and the reserve equilibrium is denotedO*.
On the demand side, our model ignores the fact that at a national or regional (if not local) level, a lower price would be needed to induce people to buy more fish, giving a downward slope of the
demand curve for fish. But it also ignores the increase in average fish size and improvement in species composition that the reserve will produce, as described in Section 2.2(i) and (iii) above. Together, these two features would mean that creating a reserve would shift a falling demand schedule out from, say, DO(p) to some schedule
further to the right.
The two features ignored on the supply side are the increase in payment per unit needed to induce more fishing effort at a national or regional level, and the higher catchability of the larger fish re-sulting from the reserve, as described in Section 2.2(iii). Together, these would mean that the re-serve shifts a rising supply schedule outwards from, say, SO(p) to a schedule further right.
The net effect of these outward shifts could be that the fish price rises, stays the same, or falls. Our simplifying assumption shown on Fig. 2, that the schedules shift to DO*(p) and SO*(p) which
intersect at an unchanged price p, is therefore a special but perfectly acceptable case. The assump-tion of a constant unit cost wis similarly restric-tive but acceptable, though it does amount to subsuming an increase in catchability c as a de-crease in winstead. Fig. 2 shows that the reserve increases both consumer and producer surplus, giving a more conventional economic case for the reserve, though our maximal reserve size will gen-erally not be the economic optimum.
Table 2
Bioeconomic variables and maximal reserve sizes
Bonaire
Parameter Belize St. Lucia Jamaica
(heavily fished)
(moderately fished) (intensively fished) (no fishing)
3.241
aStock in 150 m2‘count’ (kg)b 8.85 1.883 1.447
1 0.3662 0.2127
Hence initial stock densityS(=j=w/pc=relative 0.1636 cost of catching fish)
– 0.2111
Hence (0.5−j)/(1−j), maximal (catch-maximising) 0.3649 0.4022 reserve proportion, from Eq. (10)
1/4j(1−j), predicted factor by which reserve will – 1.077 1.493 1.827 increase catch and effort, from Table 1
aInitial daily catch (kg/person day)c – 7.6 5 2.86
300 300
– 300
aLength of season (days fishing/person year)
–
Hence catch per unit effortR/E(t/person year) 2.280 1.500 0.858
6.226 7.052
Hencec, catchability (=(R/E)/S)) (t/person year) – 5.245
2530 4100
– 4250
ap=price (US$/t, 1998 values)d
– 5768
Hence w=unit cost of effort (=pR/E, assuming 6150 3647 open access equilibrium) ($/person year)e
1.11
aIntrinsic rate of growthr(per year)f – 1.15 1.20
aEmpirically measured values; all other values are derived from them.
bFish stocks in each area were estimated from direct, underwater, visual census data collected as described in Roberts (1995b). Figures are based on a large number of replicated counts (between 70 and 330) made at 5 and 15 m intervals at each site.
cFigures are based on trap catch data from Sary (1995) for Jamaica, Goodridge et al. (in press) for St. Lucia, and one of the author’s (CR) field notes from Belize.
dValues are converted to 1998$ from Polunin and Roberts (1993) for Belize, from Sary (1995) for Jamaica, and from personal observation for St. Lucia.
eIncludes labour and costs of traps, fuel, boat depreciation etc.
fChosen to be most appropriate to the species dominating catches at each site, and based on limited available data given by Nowlis and Roberts (1997).
The second economic benefit of the reserve which deserves a mention is that the original (and often still prime) purpose of conservationist pro-posals for no-take reserves is to improve the ecological ‘value’, and thereby also the tourism potential, of the marine reserves themselves. This is positively related to the biomass (see Man et al., 1995; Nowlis and Roberts, 1997, 1999, for mod-elling studies; Alcala, 1989; Polunin and Roberts, 1993; Jennings and Polunin, 1995; Roberts, 1995b; McClanahan and Kaunda-Arara, 1996, for empirical results; and Cesar et al., 1997 for an economic analysis). Such value, which could per-haps be partially estimated by a survey of willing-ness to pay by reef-diving tourists, would obviously lead to numerically calculated, optimal reserve sizes being larger than on grounds of fishing benefit alone.
2.6. Typical empirical 6alues
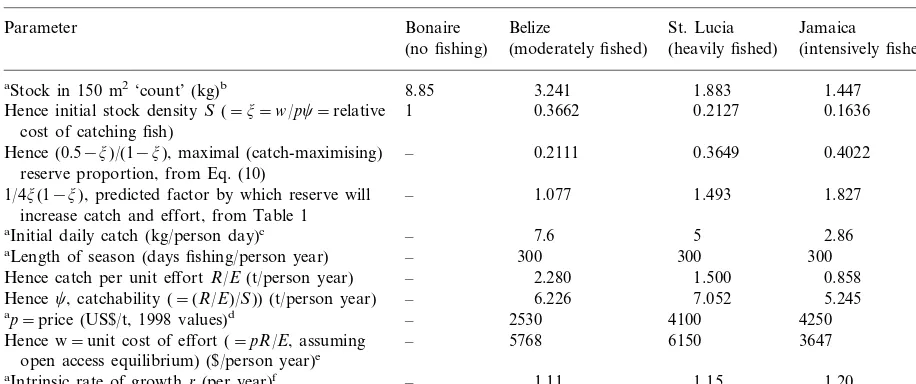
To see what our model might mean in practice, we give in Table 2 some typical values from three Caribbean fisheries with different levels of fishing intensity. We report the measured stock density
SO without a reserve, which (given no contrary
evidence) we assume to be in open access equi-librium, and then use Eq. (10) to calculate the maximal reserve proportionKR
O*
Table 1) we report intrinsic growth rates. Foot-notes give the sources of the data.
The initial stock densities shown are clearly in the region where the model predicts a fishery benefit from a reserve. However, such reserves as exist have either not been established for the several years that it takes to reach equilibrium, or have been managed with communal access restric-tions rather than by open access (Alcala, 1989; Goodridge et al., in press). So our main predic-tions, which are that the stock density on the fishing ground is unchanged by the reserve, but catch and effort rise by a factor 1/4j(1−j), remain untested empirically.
However, there is rough empirical support for our model from three sources. Firstly, the three derived figures for catchability are within an ac-ceptable range of variation for what are consid-ered to be fundamentally similar reef ecosystems. Secondly, the ratio of the inferred unit costs for Belize and Jamaica ($5768/$3647=1.582) is fairly close to the ratio of their per capita GNPs ($2450/
$1440=1.701, from WRI, 1996), even though GNP per capita obviously may not reflect the living standards of fishermen. Thirdly, the initial stock density in Conrad’s case study was 0.60 (=j), so that our model concurs with his qualita-tive prediction that a reserve will reduce catches in that case. But his reserve proportion was 43.3% (=KR), so Eq. (9) would predict a catch equal to
73.1% of what it was before the reserve, whereas his result was a fall to 57.9%. Also, our results differ markedly from Hannesson’s (Hannesson, 1998) calculation of a maximal reserve size of about 75% for (effectively) a relative cost of catching j=0.15, similar to our figure for Ja-maica where we find a maximal reserve size of about 40%.
If our result is empirically valid, an average increase of 30% in catch from overexploited coral reef fisheries could well be feasible. A conservative estimate is that a third of all reefs worldwide are threatened by overexploitation (Bryant et al., 1999). Applying this to the $18 billion annual catch value calculated at the outset, and noting that proportionally less of this will be coming from over-exploited reefs, we estimate conserva-tively that reef fishery reserves could increase the
annual world catch by the order of one billion US dollars per year at current prices.
3. The dynamic effect of a marine reserve
The dynamic effect of the reserve is determined by three equations of motion:
Fishing ground stock: comes from Eq. (3), and Eq. (13) uses the assump-tion that fishing effort adjusts at a rate propor-tional to the rent rate (Clark, 1990). With no reserve, the local stability of the two-variable system Eq. (11) and Eq. (13) could be analysed by techniques set out by Clark (1990), who shows that the only two possible types of dynamic be-haviour around the open access equilibrium are a stable focus or a stable node. But with a reserve, it is impossible to analyse the three-equation sys-tem Eqs. (11) – (13) analytically in this way.
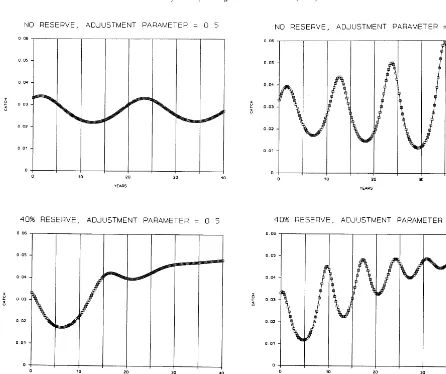
density on the reserve is not shown because in all but extreme cases behaviour is similar, with den-sity rising fairly steadily towards 1 (i.e. carrying capacity), and reaching over 0.9 within 40 years.
Figs. 3 and 4 show that the effect of the reserve on ‘stability’ depends on how stability is mea-sured. In all cases a reserve improves convergence: either creating faster convergence to equilibrium on the fishing ground, or allowing it to happen when the no-reserve system does not converge at all. However, reserves tend to make oscillations more rapid during convergence, with the period length shortening over time. A reserve also makes the first few oscillations larger because the initial level of effort is suddenly confined to the much smaller fish stock on the fishing ground. These faster and deeper initial oscillations mean that
some redirection of fishing effort to other loca-tions or occupaloca-tions during the transition to re-serve equilibrium — a redirection our model ignores — will be very important in securing broad-based support for creating marine reserves. In keeping with the dynamic economic analysis in Sanchirico and Wilen (1996), present dis-counted values of transitional fishing rents are shown in Table 3 for both 5 and 10% discount rates. The effect of the reserve on present value depends on the discount rate, so no generalisation is possible.
Finally, mention is due of the possible effect of the reserve on open-access stock extinction. This is a complex issue, and our model excludes sev-eral, potentially relevant features, such as a mini-mum viable population size (included by Berck,
Fig. 4. Dynamic effect of reserve on catch.
1979), the effect of discrete time (Bjorndal and Conrad, 1987), a low stock elasticity of produc-tion (Bjorndal et al., 1993), and uncertainty over catch levels (Lauck et al. 1998). Also, in the multispecies situations of coral reefs, any extinc-tion would probably be of just the economically
worthwhile species, rather than of all fish biomass. Nevertheless, in our (single species) model a reserve obviously does protect against extinction. Even if the fishing ground stock SF
becomes momentarily extinct because of a sudden burst of overfishing, it will recover, thanks to the flow of eggs and larvae from the reserve (from Eq. (11), SF=0[S:F=rKFKR\0).
4. Conclusions
We have given a simple model of a marine reserve which is particularly appropriate to coral reef fisheries in developing countries, as well as
Table 3
Present values of rents caused by reserve creationa With reserve Without reserve
5% discount rate −66.6 134.7 10% discount rate −36.1 −39.2
temperate fisheries with similar biological features, such as most shellfish and some demersal species. The policy investigated is just to ban fishing on a reserved proportion of a marine management area, a policy that should often be simple enough to be administratively feasible. Since this still al-lows open access fishing, rent is still dispersed, but the goal set here of maximising the sustainable catch and its associated employment seems plausi-ble in terms of political economy, if not in terms of formal cost – benefit analysis. Only the initial, pre-reserve density of fish stock in relation to carrying capacity is needed to calculate the catch-maximising reserve proportion. Allowance is made implicitly (without using dispersal terms as such) for the assumption that fish dispersal occurs only at the egg and larval stages.
The central analytic result is that if the initial density SO of fish stock is at least 1/2 in open
access equilibrium, the reserve lowers rather than raises overall catches, though it may still be justified on ecological and tourist grounds. But if
SO is B1/2, the reserve will increase the overall,
equilibrium catch, and maximises it when the reserve proportion equals (1/2−SO)/(1−SO).
The main numerical, dynamic result is that the reserve increases the speed of convergence of the management area to an open access equilibrium, but causes a larger and more rapid initial fall and then rise in fish stock and fishing effort in so doing.
Calibrating the model parameters with pre-re-serve stock, catch and fish price data from three Caribbean sites predicts catch-maximising reserve sizes in the range 20 – 40% and resulting catch increases in the range 10 – 80%, together with plau-sible estimates of catchability and unit cost of effort. Applied to coral reef fisheries worldwide, reserves could thus increase equilibrium catches by the order of one billion US dollars per year. However, there are no monitored reserves that have yet produced equilibrium data to test these predictions. This remains for further work, as does a detailed consideration of how best to manage politically and economically the initial, transitory fall in stock, catch and effort caused by creating a reserve.
Acknowledgements
We thank Jo Burgess, Ed Barbier and five referees for helpful comments and Pamela Mason and Roberto Martinez-Espineira for research assistance.
References
Alcala, A.C., 1989. Effects of protective management of marine resources on fish abundance and fish yields. Ambio 17, 194 – 199.
Berck, P., 1979. Open access and extinction. Econometrica 47, 877 – 882.
Beverton, R.J.H., Holt, S.J., 1957. On the Dynamics of Ex-ploited Fish Populations. Fisheries Investigations Series 2(19). Ministry of Agriculture, Fisheries and Food, London.
Birkeland, C. (Ed.), 1997. Life and Death of Coral Reefs. Chapman and Hall, New York.
Bjorndal, T., Conrad, J.M., 1987. The dynamics of an open access fishery. Canadian Journal of Economics 87, 74 – 85. Bjorndal, T., Conrad, J.M., Salvanes, K.G., 1993. Stock size, catching costs, and the potential for extinction: the case of sealing. Land Economics 69 (2), 156 – 167.
Boehlert, G.W., 1996. Larval dispersal and survival in tropical reef fishes. In: Polunin, N.V.C., Roberts, C.M. (Eds.), Reef Fisheries. Chapman and Hall, London, pp. 61 – 84. Bohnsack, J.A., 1992. Reef resource habitat protection: the
forgotten factor. Marine Recreational Fisheries 14, 117 – 129.
Brown, G., Roughgarden, J., 1997. A metapopulation model with private property and a common pool. Ecological Economics 22, 65 – 71.
Bryant, D., Burke, L., McManus, M., Spalding, M., 1999. Reefs at Risk: A Map-Based Indicator of Potential Threats to the World’s Coral Reefs. World Resources Institute, Washington, DC.
Cesar, H., Lundin, C.G., Bettencourt, S., Dixon, J., 1997. Indonesian coral reefs: an economic analysis of a precious but threatened resource. Ambio 26 (6), 345 – 350. Chapman, M.R., Kramer, D.L., 1999. Gradients in coral reef
density and size across the Barbados Marine Reserve bounday: effects of reserve protection and habitat charac-teristics. Marine Ecology Progress Series 181, 81 – 96. Clark, C.W., 1990. Mathematical Bioeconomics — The
Opti-mal Management of Renewable Resources, second ed. Wiley InterScience, New York.
Conrad, J.M., 1995. Bioeconomic models of the fishery. In: Bromley, D.W. (Ed.), The Handbook of Environmental Economics. Blackwell, Oxford, pp. 405 – 432.
Corless, M., Hatcher, B.G., Hunte, W., Scott, S., 1999. Assess-ing the potential for fish migration from marine reserves to adjacent fished areas in the Soufriere Marine Management Area, St Lucia. In: Proceedings of the Forty-ninth Gulf and Caribbean Fisheries Institute, Bridgetown, Barbados, 1996.
Feeny, D., Hanna, S., McEvoy, A.F., 1996. Questioning the assumptions of the tragedy of the commons model of fisheries. Land Economics 72 (2), 187 – 205.
Goodridge, R., Oxenford, H.A., Hatcher, B.G., Narcisse, F. Changes in the shallow reef fishery associated with imple-mentation of a system of fishing priority and marine reserve areas in Soufriere, St. Lucia. In: Proceedings of the Forty-ninth Gulf and Caribbean Fisheries Institute, Brid-getown, Barbados, 1996, in press.
Gordon, H.S., 1954. The economic theory of a common-prop-erty resource: the fishery. Journal of Political Economy 62, 124 – 142.
Halfpenny, H., Roberts, C.M., Designing a network of marine reserves for north-western Europe. Ecol. Applications (in review).
Hannesson, R., 1998. Marine reserves: what would they ac-complish? Marine Resource Economics 13, 159 – 170. Holland, D.S., Brazee, R.J., 1996. Marine reserves for fisheries
management. Marine Resource Economics 11, 157 – 171. Holland, K.N., Peterson, J.D., Wetherbee, B.M., Lowe, C.G.,
1993. Movements, distribution and growth rates of the white goatfish (Mulloides fla6olineatus) in a fisheries con-servation zone. Bulletin of Marine Science 52, 982 – 992. Holland, K.N., Lowe, C.G., Wetherbee, B.M., 1996.
Move-ments and dispersal patterns of blue trevally (Caranx melampygus) in a fisheries conservation zone. Fisheries Research 25, 279 – 292.
Homans, F.R., Wilen, J.E., 1997. A model of regulated open access resource use. Journal of Environmental Economics and Management 32, 1 – 21.
Jennings, S., Lock, J.M., 1996. Population and ecosystem effects of reef fishing. In: Polunin, N.V.C., Roberts, C.M. (Eds.), Reef Fisheries. Chapman and Hall, London, pp. 193 – 218.
Jennings, S., Polunin, N.V.C., 1995. Relationships between catch and effort levels in Fijian multispecies reef fisheries subject to different levels of exploitation. Fisheries Man-agement and Ecology 2, 89 – 101.
Kramer, D.L., Chapman, M.R., 1999. Implications of fish home range size and relocation for marine reserve func-tion. Environmental Biology of Fishes 55 (1), 65 – 79. Lauck, T., et al., 1998. Implementing the precautionary
princi-ple in fisheries management through marine reserves. Eco-logical Applications Supplement 8 (1), S72 – S78.
Man, A., Law, R., Polunin, N.V.C., 1995. Role of marine reserves in recruitment to reef fisheries: a metapopulation model. Biological Conservation 71, 197 – 204.
May, R.M. (Ed.), 1981. Theoretical Ecology: Principles and Applications, second ed. Blackwell, Oxford.
McClanahan, T.R., Kaunda-Arara, B., 1996. Fishery Recov-ery in a Coral-reef Marine Park and its Effects on the
Adjacent Fishery. Conservation Biology 10 (4), 1187 – 1199.
McGlade, J., Price, A., Klaus, R., Metuzals, K., 1997. Recov-ery Plans for the North Sea Ecosystem, With Special Reference to Cod, Haddock and Plaice. World Wildlife Fund, Godalming, UK.
McManus, J.W., 1996. Social and economic aspects of reef fisheries and their management. In: Polunin, N.V.C., Roberts, C.M. (Eds.), Reef Fisheries. Chapman and Hall, London, pp. 249 – 281.
Munro, J.L., 1996. The scope of tropical reef fisheries and their management. In: Polunin, N.V.C., Roberts, C.M. (Eds.), Reef Fisheries. Chapman and Hall, London, pp. 1 – 12.
Nowlis, J.S., Roberts, C.M., 1997. You can have your fish and eat it too: theoretical approach to marine reserve design. In: Proceedings of the Seventh International Coral Reef Symposium, Panama, vol. 2, pp. 1907 – 1910.
Nowlis, J.S., Roberts, C.M., 1999. Fisheries benefits and opti-mal design of marine reserves. Fishery Bulletin 97 (3), 604 – 616.
Polacheck, T., 1990. Year around closed areas as a manage-ment tool. Natural Resource Modeling 4 (3), 327 – 354. Polunin, N.V.C., Roberts, C.M., 1993. Greater biomass and
value of target coral-reef fishes in two small Caribbean marine reserves. Marine Ecology Progress Series 100, 167 – 176.
Polunin, N.V.C., Roberts, C.M. (Eds.), 1996. Reef Fisheries. Chapman and Hall, London.
Rakitin, A., Kramer, D.L., 1996. Effect of a marine reserve on the distribution of coral reef fishes in Barbados. Marine Ecology Progress Series 131, 97 – 113.
Roberts, C.M., Hawkins, J.P., 1997. How small can a marine reserve be and still be effective? Coral Reefs 16, 150. Roberts, C.M., 1995a. Effects of fishing on the ecosystem
structure of coral reefs. Conservation Biology 9 (5), 988 – 993.
Roberts, C.M., 1995b. Rapid build-up of fish biomass in a Caribbean marine reserve. Conservation Biology 9 (4), 815 – 826.
Roberts, C.M., 1996. Settlement and beyond: population regu-lation and community structure. In: Polunin, N.V.C., Roberts, C.M. (Eds.), Reef Fisheries. Chapman and Hall, London, pp. 85 – 112.
Roberts, C.M., 1997a. Ecological advice for the global fisheries crisis. Trends in Ecology and Evolution 12, 35 – 38. Roberts, C.M., 1997b. Connectivity and management of
Caribbean coral reefs. Science 278, 1454 – 1457.
Russ, G.R., Alcala, A.C., 1996. Do marine reserves export adult fish biomass? Evidence from Apo Island, Central Philippines. Marine Ecology Progress Series 132, 1 – 9. Russ, G.R., 1991. Fisheries and management. In: Sale, P.F.
(Ed.), The Ecology of Fishes on Coral Reefs. Academic Press, San Diego, CA, pp. 601 – 635.
Sanchirico, J.N., Wilen, J.E., 2000. A bioeconomic model of marine reserve creation. Journal of Env. Econ. and Man-agement (in press).
Sary, Z., 1995. Responses of an overexploited Caribbean trap fishery to the introduction of a larger mesh size in Discov-ery Bay, Jamaica. Masters Thesis. University of the West Indies, Barbados.
Sluka, R., Chiappone, M., Sullivan, K.M., Wright, R., 1997. The benefits of a marine fishery reserve for Nassau grouper Epinephelus striatusin the central Bahamas. In: Proceed-ings of the Eighth International Coral Reef Symposium, Panama, vol. 2, pp. 1961 – 1964.
World Resources Institute, 1996. World Resources 1996 – 97. Oxford University Press, New York.