Cellular automaton of idealized brain tumor growth
dynamics
A.R. Kansal
a, S. Torquato
b,*, G.R. Harsh IV
c, E.A. Chiocca
d,e,f,
T.S. Deisboeck
d,e,f,1aDepartment of Chemical Engineering,Princeton Uni6ersity,Princeton,NJ08544,USA bSchool of Mathematics,Institute for Ad6anced Studies,Princeton,NJ08540,USA
cDepartment of Neurosurgery,Stanford Uni6ersity Medical School,Stanford Uni6ersity,Stanford,CA94305,USA dNeurosurgical Ser6ice,Massachusetts General Hospital East,Har6ard Medical School,Charlestown,MA02129,USA
eBrain Tumor Center,Massachusetts General Hospital East,Har6ard Medical School,Charlestown,MA02129,USA fMolecular Neuro-Oncology Laboratory,Massachusetts General Hospital East,Har6ard Medical School,Charlestown,
MA02129,USA
Abstract
A novel cellular automaton model of proliferative brain tumor growth has been developed. This model is able to simulate Gompertzian tumor growth over nearly three orders of magnitude in radius using only four microscopic parameters. The predicted composition and growth rates are in agreement with a test case pooled from the available medical literature. The model incorporates several new features, improving previous models, and also allows ready extension to study other important properties of tumor growth, such as clonal competition. © 2000 Elsevier Science Ireland Ltd. All rights reserved.
Keywords:Cellular automaton; Tumor modeling; Proliferative dynamics
www.elsevier.com/locate/biosystems
1. Introduction
The incidence of primary malignant brain tu-mors remains high. The majority consists of
high-grade malignant neuroepithelial tumors such as glioblastoma multiforme (GBM), with a median survival time of only 8 months (Black 1991; Whit-tle 1996). Tumors such as GBM have such a grim outcome in part due to their rapid volumetric growth, but also because the tumor has already grossly invaded the surrounding brain tissue long before it can be diagnosed (Burger et al., 1988; Nazzaro and Neuwelt 1990; Silbergeld and Chicoine 1997). Even after surgical removal of a tumor, the invasive cells left behind can cause recurrence.
* Corresponding author. Present address: Princeton Materi-als Institute, Bowen Hall, Room 417, Princeton University, 70 Prospect Avenue, Princeton, NJ 08544-5211, USA. Tel.:+ 1-609-2583341; fax: +1-609-2586878.
E-mail address: [email protected] (S. Torquato)
1T.S. Deisboeck is also affiliated with the New England
Complex Systems Institute and the Departmnt of Neuro-surgery, University of Munich (Germany).
Also, since tumors can adapt to a wide range of environmental conditions, developing resistance to even the most aggressive therapies, it is unlikely
that tumors are simply random masses of rapidly dividing cells. Instead, it suggests that tumors are opportunistic, self-organizing systems and must be studied and treated as such on a micro- and macroscopic level (Kraus and Wolf 1993). The computational models needed to simulate tumors as systems must be developed using techniques from a range of disciplines, including medical, engineering and statistical physics research.
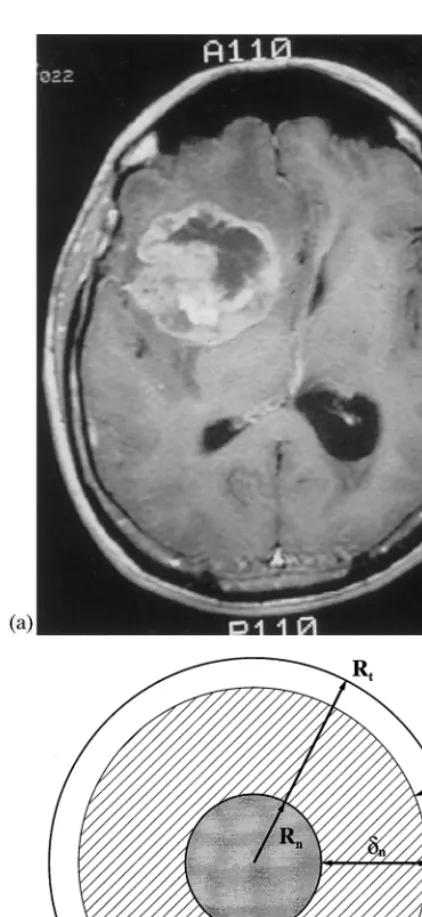
We have developed a three-dimensional cellular automaton (CA) model which describes prolifera-tive tumor growth as a function of time (Kansal et al., 1999). The algorithm tracks the growth and composition of a virtual tumor from roughly 1000 real cells, through several clinically designated time points, to a fully developed macroscopic size. Our approach models a GBM tumor as an enor-mous idealized multicellular tumor spheroid (MTS), mathematically described by a Gompertz function (see Eq. (1)) (Marusic et al., 1994). This approach is especially suited for a GBM, because this tumor comprises a large area of central necro-sis surrounded by shells of viable cells (Fig. 1). In this paper, we summarize the model and an-nounce the major idealized results that we have obtained (see Kansal et al. (1999) for complete details, as well as non-ideal results).
This model is designed with the evaluation of clinically important criteria in mind. In particular, the fraction of the tumor which is able to divide (GF), the non-proliferative quiescent (G0/G1
ar-rest) and necrotic fractions, and the rate of growth (volumetric doubling time) are tracked at every time step. The simulation data produced is in agreement with a test case derived from the medical literature, indicating that a relatively small set of microscopic parameters can be used to simulate solid tumor growth.
Several new features have been incorporated into our model. One of the most fundamental algorithmic changes alters the way in which cells are able to divide. This allows for a more biologi-cally reasonable transition between proliferative and growth-arrested cells. In addition, the under-lying lattice of the model has been improved. This is the first use of the Voronoi tessellation to study tumor growth in a cellular automaton. The Voronoi lattice is isotropic in space, and so avoids
the anisotropies associated with more ordered lat-tices. The lattice used also incorporates an adap-tive grid. This allows tumor growth to be simulated with greater resolution at small sizes, while still growing the tumor to a large size.
An important advantage to the use of CA modeling is the flexibility to treat more realisti-cally complex situations (Kauffman, 1984; Wol-fram, 1984). In particular, the addition of a heterogeneous environment, such as the influence of a vascular network or proximity to the skull (mechanical confinement), can be studied with relatively minor alterations to the model. Simi-larly, the ability to treat a heterogeneous (multi-clonal) tumor can also be incorporated directly into the same modeling framework. Finally, this model is intended as a first iteration in the devel-opment of a comprehensive tumor system model. A comprehensive model will necessarily include invasive growth explicitly, the nature of which is ideally suited to study using discrete modeling.
In the following section (Section 2) we outline some of the earlier work that has been done in the field of tumor modeling. Section 3 discusses the details of the procedure for the simulation. A summary of our results is contained in Section 4. This is followed by a discussion and concluding remarks regarding our current work, as well as future work, in Section 5.
2. Previous work
Some of the earliest work in modeling of tu-mors using a three-dimensional cellular automa-ton on a cubic lattice was carried out by Du¨chting and Vogelsaenger (1985) for very small tumors. These automaton rules were designed to reflect nutritional needs for tumor growth. Other impor-tant factors, such as surrounding cells and me-chanical pressure, however, remained unconsidered. Qi et al. (1993) considered a two-di-mensional cellular automaton tumor model that reproduced idealized Gompertz results. However, cells could only divide if one of their nearest neighbors was empty. This created an unrealisti-cally small fraction of a tumor which may divide. Work by Smolle and Stettner (1993) showed that
the macroscopic behavior of a tumor can be affected by the presence of growth factors at the microscopic level and added the concept of cellu-lar migration to the behavior of the cells. This work, however, was qualitative and intended to show the range of behaviors obtainable from a simple model. In addition, all of the above models rely on square (or cubic) lattices. While this pro-vides a simple method of organizing the au-tomata, it also introduces undesirable asymmetries and other artificial lattice effects.
Another approach that has been taken by a number of researchers is to create equations which describe the tumor phenomenologically. The best known is the Gompertz model, which describes the volume,V, of a tumor versus time,t, as
V=V0 exp
A
B(1−exp(−Bt))
(1)whereV0is the volume at timet=0 andAandB
are parameters (Brunton and Wheldon, 1977; Steel, 1977). Qualitatively, this equation gives ex-ponential growth at small times which then satu-rates at large times. While the Gompertz equation only considers a single clonal population within a tumor, heterogeneity is an important element of GBM tumors. Cruywagen et al. (1995) has sought to apply the Jansson – Revesz logistic equations to tumor growth with two populations. In addition, they have included a diffusive term to each equa-tion, to account for passive cellular motion. These mathematical models are useful to describe the general size of a tumor under relatively simple conditions (two populations, Fickian diffusion). They do not, however, account for active cell motility or other complicating factors. A review of several other mathematical models is contained in Marusic et al. (1994).
3. Simulation procedure
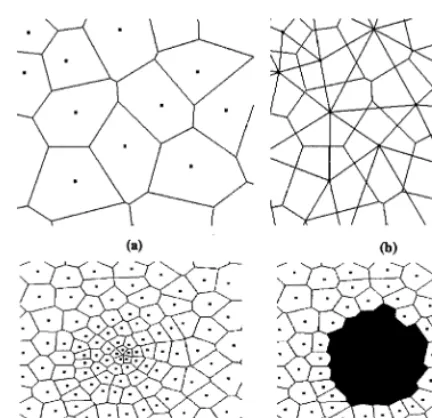
Fig. 2. Two-dimensional space tiled into Voronoi cells. Points represent sites and lines denote boundaries between cells. Figures (a) and (b) depict a very small section of a lattice. (a) shows the Voronoi cells, while (b) shows both the Voronoi cells and the Delaunay tessellation. Figures (c) and (d) show a more representative section of the lattice, with the variable density of sites evident. Figure (c) shows the entire lattice section, (d) shows the same section with the darkened cells representing a tumor.
orders of magnitude in volume, the lattice was designed with a variable grid size. In our lattice, the density of site was allowed to vary continu-ously with radial position. The density of lattice sites near the center of the lattice was significantly higher than that at the edge. A higher site density corresponds to less real cells per automaton cell, and so to a higher resolution. The higher density at the center enables us to simulate the flat small-time behavior of the Gompertz curve. In the current model, the innermost automaton cells rep-resent roughly 100 real cells, while the outermost automaton cells represent roughly 106
real cells. The average distance between sites is described by the relation
z=1
6r
2/3 (2)
where zis the average distance between sites and
ris the site’s radial position. Note the 2/3 appear-ing in the exponent, which is intended to reflect a surface area to volume type relation. This con-forms to the diffusion of nutrients through the surface of the tumor, which is know to be a crucial factor in governing a tumor’s growth dy-namics (Folkman and Hochberg, 1973).
In three spatial dimensions, 1.5×10⁶
lattice sites are used. This has been found to be the minimum required to give adequate spatial resolu-tion over the entire range of tumor growth mod-eled here. The Delaunay tessellation is generated from the RSA point list using a program written by Mucke (1997) called detri. Once the lattice is generated, the proliferation algorithm can be run. The initial tumor is composed of a few automaton cells, representing roughly one-thousand real cells, located at the center of the lattice.
An idealized model of a macroscopic tumor is a spherical body consisting of several concentric shells. The inner core, the grey region in Fig. 1, is composed of necrotic cells. The necrotic region has a radiusRn, which is a function of time,t, and
is characterized by its distance from the prolifera-tive rim, dn. The next shell, the cross-hatched
region in the figure, contains cells which are alive but in the G0 cell-cycle rest state. This is termed
the non-proliferative quiescent region and is defined in terms of its distance from the edge of into an isotropic lattice. Each cell of the lattice is
assigned to a single site. The Delaunay triangula-tion then defines those cells that are nearest neigh-bors of one another. Both of these constructions are depicted (in two-dimensions) in Fig. 2.
While an isotropic Voronoi tessellation can be generated from any list of random points, a care-fully designed list will yield a more useful lattice. A purely random distribution of points (the Pois-son distribution) will have regions in which the density of points is very high and regions with a very low density, corresponding to small and large Voronoi cells, respectively. While some variation in the size and shape of cells is important to ensure isotropy, it is biologically unreasonable to have overly large variations. To avoid these large variations, a technique common in statistical physics known as the random sequential addition (RSA) process was used (Cooper, 1988).
the tumor, dp. This thickness is the maximum
distance from the tumor edge with a high enough nutrient concentration to maintain active cellular division. In real MTS tumors, however, only about one-third of the remaining viable cells in-crease the tumor size by proliferation. The others are actively dividing, but the new cells leave the central tumor mass and invade the surrounding tissue, supposedly triggering invasion (Landry et al., 1981; Freyer and Schor, 1989). Finally, as discussed below, an individual cell can only divide if free space exists within a certain distance of it. This distance must also be dp (as defined above)
to properly account for the nutrient gradient basis for the transition of cells between the actively dividing and G0 arrested states. This distance is
depicted as a small broken circle in Fig. 1. Both real tumors and our simulated tumors, however, are not perfectly spherical. As such, the values of
RtandRnvary over the surface of the tumor. The
single values used in the algorithm and listed in our results are obtained by averaging the radii of all the cells at the edge of the tumor or of the necrotic region, respectively, according to the relations:
whereNPdenotes the number of cells on the edge
of the proliferative region and NN denotes the
number of cells on the edge of the necrotic core. In summary, the four key quantities Rt,dp, dn,
and pdare functions of time calculated within the
model. To find them, the simulation utilizes four microscopic parameters: p0, a, b and Rmax
(sum-marized in Table 1). These parameters are linked to the cell doubling time, the nutritional needs of growth-arrested cells, the nutritional needs of di-viding cells, and the effects of confinement pres-sure, respectively.
These quantities are calculated according to the algorithm below. In it, four distinct cells types are identified: tumorous, and proliferative, non-proliferative and necrotic tumor cells.
Initial setup: The cells within a fixed initial
radius of the center of the grid are designated proliferative. All other cells are designated as non-tumorous.
Time is discretized and incremented. At each
time step:
Healthy (non-tumorous) cells and necrotic
tu-morous cells are inert.
Non-proliferative cells more than a certain
dis-tance from the proliferative rim are turned necrotic. This is designed to model the effects of a nutritional gradient. The formula used is
dn=aRt
2/3 (4)
in which a is a parameter, termed the base necrotic thickness.
Proliferative cells are checked to see if they will
attempt to divide. The effect of mechanical confinement pressure requires the use of an additional parameter, termed the maximum tu-mor extent, Rmax. This probability is
deter-mined by the equation:
pd=p0
1−r Rmax
(5) If a cell attempts to divide, it will search for
sufficient space for the new cell beginning with its nearest neighbors and expanding outwards until either an available (non-tumorous) space is found or nothing is found within the prolif-eration radius,dp. The radius searched is
calcu-lated as:
Table 1
Summary of time-dependent functions and input parameters for our model.
Functions within the model(time dependant) Average overall tumor radius Rt
dp Proliferative rim thickness (determines growth frac-tion)
dn Necrotic radius (determines necrotic fraction) Probability of division (varies with time and posi-pd
tion)
Parameters(constant inputs to the model)
Base probability of division, linked to cell doubling p0
time
Base necrotic thickness, controlled by nutritional a
needs
b Base proliferative thickness, controlled by nutritional needs
Rmax Maximum tumor extent, controlled by pressure
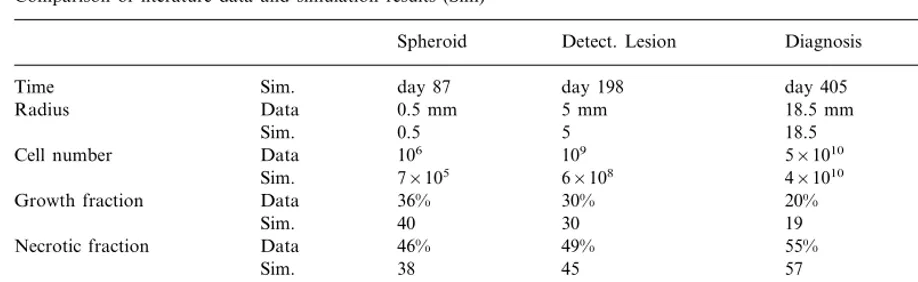
Table 2
Comparison of literature data and simulation results (Sim)a
Spheroid Detect. Lesion Diagnosis Death
day 87 day 198
Time Sim. day 405 day 492
Radius Data 0.5 mm 5 mm 18.5 mm 25 mm
0.5 5 18.5 25
Sim.
106 109
Data 5×10¹⁰
Cell number 1011
Sim. 7×10⁵ 6×10⁸ 4×10¹⁰ 9×10¹⁰
36% 30%
Growth fraction Data 20% 9%
40 30
Sim. 19 13
Data
Necrotic fraction 46% 49% 55% 60%
38 45 57
Sim. 60
6 days 45 days
Data 70 days
Doubling time 105 days
5 38 72
Sim. 112
aNote that the time row is simulation data only and is taken from the start of the simulation (R
t=0.1 mm) not from the
theoretical start of the tumor growth.
dp=bRt2/3 (6)
in which b is a parameter, termed the base proliferative thickness. Healthy cells are treated as empty in the current model. This should not be interpreted as the cells disappearing when a tumor cell divides near them, but rather that they are forced into the surrounding mass of indistinguishable healthy tissue.
If a cell attempts to divide but cannot find
space it becomes a non-proliferative cell. The final two steps listed above constitute the redefinition of the proliferative to nonproliferative transition that is one of the most important new features of the model. They allow a larger number of cells to divide, since cells no longer need to be on the outermost surface of the tumor to divide, but rather only within dp of the surface. In
addi-tion, they ensure that cells that cannot divide are correctly labeled as such.
4. Results
Results for the growth of a simulated tumor have been compared with a test case derived from the medical literature for an untreated GBM tu-mor (see Kansal et al. (1999) for details). Qualita-tively, it has been shown that as a tumor grows its
volumetric growth slows (corresponding to a in-creased doubling time) and it’s growth fraction decreases. (Folkman and Hochberg, 1973; Durand, 1976; Landry et al., 1981; Freyer and Sutherland, 1986; Mueller-Klieser et al., 1986; Rotin et al., 1986; Freyer and Schor, 1989). Quan-titatively, several clinical parameters have been compared. These were cell number, growth frac-tion, necrotic fracfrac-tion, and volumetric doubling time. These data are significant medically, where they can be used in assessing a tumor’s malig-nancy and the patient’s prognosis (Blankenberg et al., 1995; Hoshino and Wilson, 1979).
Summarized in Table 2 is the comparison be-tween simulation results and the test case. On the whole, the simulation data match the medical results very well at the compared clinically rele-vant time-points. The virtual patient would die roughly 11 months after the tumor radius reached 5 mm and roughly 3.5 months after the expected time of diagnosis. The fatal tumor volume is about 65 cm3
.
These data were created using a tumor which was grown from an initial radius of 0.1 mm.The following parameter set was used:
p0=0.192, a=0.42 mm 1/3
,
b=0.11 mm1/3, R
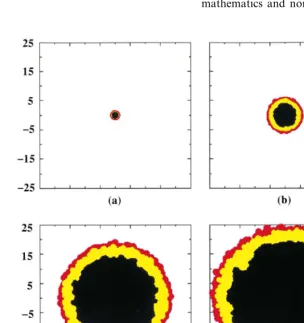
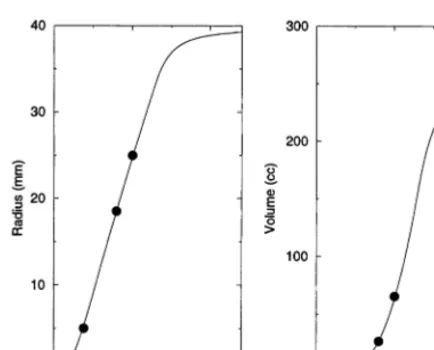
Since a three-dimensional CA image is difficult to visualize, cross-sections of the tumors are shown instead. The growth of the central cross-section of the tumor can be followed graphically over time in Fig. 3. Note that the plotted points do not depict the exact shape of the Voronoi cells, but rather just their positions. In this ideal exam-ple, the environment is isotropic, leading to tu-mors that are essentially spherical (within some degree of randomness). As such the central cross-section is a representative view. The volume and radius of the developing tumor are shown versus time in Fig. 4. Note that the virtual patient dies from the untreated GBM within the rapid growth phase.
5. Discussion and conclusions
Substantial progress has been made in the various very specialized areas of cancer research. Yet the complexity of the disease on both the single cell level as well as the multicellular tumor stage has led to the first attempts to describe tumors as complex, dynamic, self-organizing biosystems, rather than merely focusing on single features (Bagley et al., 1989; Schwab and Pienta, 1996; Coffey, 1998; Waliszewski et al., 1998). To begin to understand the complexity of the proposed system, novel simulations must be developed, incorporat-ing concepts from many scientific areas such as cancer research, statistical mechanics, applied mathematics and nonlinear dynamical systems.
Fig. 4. Plots of the radius and volume of the tumor, versus time, as determined from the simulation.
models in order to determine some of the factors which may drive the formation of the structural elements within the proposed self-organizing, adaptive invasive network (Habib et al., 1999).
Acknowledgements
S.T. gratefully acknowledges the Guggenheim Foundation for his Guggenheim fellowship to conduct this work. This work is also supported in part by grants CA84509 and CA69246 from the National Institutes of Health. Calculations were carried out on an IBM SP2, which was kindly provided by the IBM Corporation (equipment grant to Princeton University for the Harvard-Princeton Tumor Modeling Project). The techni-cal assistance provided by Drs Kirk E. Jordan and Gyan V. Bhanot of the IBM T.J. Watson Labs is gratefully acknowledged. The authors would also like to thank Drs Stuart A. Kauffman of the Santa Fe Institute for Complex Science, Jerome B. Posner of Memorial Sloan Kettering Cancer Center, Michael E. Berens of the Barrows Neurological Institute and Hans-Juergen Reulen of the University of Munich Neurosurgical De-partment for valuable discussions.
References
Bagley, R.J., Farmer, J.D., Kauffman, S.A., Packard, N.H., Perelson, A.S., Stadnyk, I.M., 1989. Modeling adaptive biological systems. Biosystems 23, 113 – 138.
Black, P.M., 1991. Brain tumors, part 2. N. Engl. J. Med. 324, 1555 – 1564.
Blankenberg, F.G., Teglitz, R.L., Ellis, W., et al., 1995. The influence of volumetric doubling time, DNA ploidy, and histological grade on the survival of patients with intracra-nial astrocytomas. Am. J. Neuroradiol. 16, 1001 – 1012. Brunton, G.F., Wheldon, T.E., 1977. Prediction of the
com-plete growth pattern of human multiple myeloma from restricted intial measurements. Cell Tissue Kinet. 10, 591 – 594.
Burger, P.C., Heinz, E.R., Shibata, T., Kleihues, P., 1988. Topographic anatomy and CT correlations in the un-treated glioblastoma multiforme. J. Neurosurg. 68, 698 – 704.
Coffey, D.S., 1998. Self-organization, complexity and chaos: the new biology for medicine. Nat. Med. 4, 882 – 885.
To create a useful tumor model, a heteroge-neous environment must be included. Examples include regional differences in structural confi-nement and the influence of environmental fac-tors, such as blood vessels. The discrete nature of our model enables us to directly simulate these more complex physiological situations with only minor alterations (Kansal et al., 1999). The im-pact of surgical procedures or other treatments can also be modeled. Further, we can currently include tumorous sub-populations with different growth behaviors. These tumor sub-populations represent a clear step forward from previous ‘monoclonal’ (single population) models. This will lead to important information about intratumoral competition and cooperation and how tumors adapt to maintain their fitness in the environment they are presented (Gatenby, 1996).
Cooper, D.W., 1988. Random sequential packing simulations in 3D for spheres. Phys. Rev. A 38, 522 – 524.
Cruywagen, G.C., Woodward, D.E., Tracqui, P., Bartoo, G.T., Murray, J.D., Alvord, E.C., 1995. The modelling of diffusive tumours. J. Biol. Sys. 3, 937 – 945.
Du¨chting, W., Vogelsaenger, T., 1985. Recent progress in modelling and simulation of three-dimensional tumor growth and treatment. Biosystems 18, 79 – 91.
Durand, R.E., 1976. Cell cycle kinetics in an in vitro tumor model. Cell Tissue Kinet. 9, 403 – 412.
Folkman, J., Hochberg, M., 1973. Self-regulation of growth in three dimensions. J. Exp. Med. 138, 745 – 753.
Freyer, J.P., Schor, P.L., 1989. Regrowth kinetics of cells from different regions of multicellular spheroids of four cell lines. J. Cell. Physiol. 138, 384 – 392.
Freyer, J.P., Sutherland, R.M., 1986. Regulation of growth saturation and development of necrosis in EMT6/Ro mul-ticellular spheroids by the glucose and oxygen supply. Cancer Res. 46, 3504 – 3512.
Gatenby, R.A., 1996. Applications of competition theory to tumour growth: Implications for tumour biology and treat-ment. Eur. J. Cancer 32A, 722 – 726.
Habib, S., Perumpanani, A., Torquato, S. and Deisboeck, T.S. 2000 (in preparation).
Hoshino, T., Wilson, C.B., 1979. Cell kinetic analyses of human malignant brain tumors (gliomas). Cancer 44, 956 – 962.
Kansal, A.R., Torquato, S., Harsh IV, G.R., Chiocca, E.A. and Deisboeck, T.S., 2000. Simulated brain tumor growth dynamics using a three-dimensional cellular automaton, J. Theor. Biol. (in press).
Kauffman, S.A., 1984. Emergent properties in random com-plex automata. Physica 10D, 145 – 156.
Kraus, M., Wolf, B., 1993. Emergence of self-organization in tumor cells: relevance for diagnosis and therapy. Tumor Biol. 14, 338 – 353.
Landry, J., Freyer, J.P., Sutherland, R.M., 1981. Shedding of mitotic cells from the surface of multicell spheroids during growth. J. Cell. Physiol. 106, 23 – 32.
Marusic, M., Bajzer, Z., Freyer, J.P., Vuc-Pavlovic, S., 1994. Analysis of growth of multicellular tumour spheroids by mathematical models. Cell Proliferat. 27, 73 – 94. Mucke, E. 1997. http://www.geom.umn.edu/locate/cglist/
GeomDir.
Mueller-Klieser, W., Freyer, J.P., Sutherland, R.M., 1986. Influence of glucose and oxygen supply conditions on the oxygenation of multicellular spheroids. Br. J. Cancer 53, 345 – 353.
Nazzaro, J.M., Neuwelt, E.A., 1990. The role of surgery in the management of supratentorial intermediate and high-grade astrocytomas in adults. J. Neurosurg. 73, 331 – 344. Okabe, A., Boots, B, Sugihara, K. 1992. Spatial Tesselations,
John Wiley and Sons, New York.
Qi, A.S., Zheng, X., Du, C.Y., An, B.S., 1993. A cellular automaton model of cancerous growth. J. Theor. Biol. 161, 1 – 12.
Rotin, D., Robinson, B., Tannock, I.F., 1986. Influence of hypoxia and an acidic environment on the metabolism and viability of cultured cells: potential implications for cell death in tumors. Cancer Res. 46, 2821 – 2826.
Schwab, E.D., Pienta, K.J., 1996. Cancer as a complex adap-tive system. Med. Hypotheses 47, 235 – 241.
Silbergeld, D.L., Chicoine, M.R., 1997. Isolation and charac-terization of human malignant glioma cells from histologi-cally normal brain. J. Neurosurg. 86, 525 – 531.
Smolle, J., Stettner, H., 1993. Computer simulation of tumour cell invasion by a stochastic growth model. J. Theor. Biol. 160, 63 – 72.
Steel, G.G. 1977. Growth Kinetics of Tumors, Clarendon Press, Oxford.
Waliszewski, P., Molski, M., Konarski, J., 1998. On the holistic approach in cellular and cancer biology: nonlinear-ity, complexity and quasi-determinism of the dynamic cel-lular network. J. Surg. Oncol. 68, 70 – 78.
Whittle, I.R., 1996. Management of primary malignant brain tumours. J. Neurol. Neurosurg. Psych. 60, 2 – 5.
Wolfram, S., 1984. Cellular automata as models of complexity. Nature 311, 419 – 424.