www.elsevier.com / locate / econbase
Are the Penn World Tables data on government consumption
and investment being misused?
*
Stephen Knowles
Department of Economics, University of Otago, PO Box 56, Dunedin, New Zealand Received 30 May 2000; accepted 6 December 2000
Abstract
This paper argues that it is inappropriate to measure G / Y and I / Y using Penn World Tables data. The empirical results of Barro and Lee (Carnegie–Rochester Conference Series on Public Policy, 40 (1994) 1–46) are sensitive to whether G / Y and I / Y are measured in local or international prices. 2001 Elsevier Science B.V. All rights reserved.
Keywords: Penn World Tables; International prices; Economic growth; Investment; Government consumption
JEL classification: O40
1. Introduction
Many empirical studies on the determinants of economic growth across countries include the investment share in output (I / Y) and the share of government consumption in output (G / Y) as explanatory variables. More often than not these ratios are measured using data from the Penn World Tables (PWT). This means that I / Y and G / Y are calculated, for each country, using the relative prices that prevail in the world economy on average, rather than the relative prices that exist in that country. This paper will argue that this distorts the data, in some countries quite substantially. Section 2 will discuss more fully the issue of whether G / Y and I / Y should be measured in local or international prices. Section 3 will analyse whether the empirical results of Barro and Lee (1994), a paper that measures both G / Y and I / Y in international prices from the PWT, are sensitive to whether these ratios are measured in local or international prices. Section 4 will conclude.
*Tel.:164-3-479-8350; fax: 164-3-479-8174.
E-mail address: [email protected] (S. Knowles).
2. Measuring G / Y and I / Y in local versus international prices
The development of version 4 (Summers and Heston, 1988) and version 5 (Summers and Heston, 1991) of the PWT has led to a vast quantity of empirical research on the determinants of economic growth. The PWT data adjust United States dollar based measures of income per capita to allow for the different purchasing power of a United States dollar in different countries. This is sometimes referred to in the literature as measuring variables in ‘international dollars’ or ‘international prices’. The construction of the PWT data involves setting relative prices for each individual good equal to the weighted average of relative prices for the same goods in all countries. Therefore, relative prices in each country are determined by the world average. The level of prices is then normalised so that GDP in the United States is identical in American and international dollars (Summers and Heston, 1991, p. 334).
Data on I / Y and, to a lesser extent, G / Y from the PWT have often been included as explanatory 1
variables in cross-country growth regressions. Not only is the conversion to an international currency unnecessary for such ratios, as they can be measured validly in local currencies, but it also distorts the data by imposing a set of international relative prices on each country. Conversion to international prices tends to increase the share of output devoted to government consumption for poor countries, but reduce it for rich countries. This is because the price of labour, relative to capital, in poor countries is lower than in rich countries and the government sector tends to be labour intensive in poor countries (see Collins and Bosworth, 1996). This leads to the relative price of government output being lower in poor countries than in rich countries, artificially increasing G / Y for low-income countries.
How then should G / Y be measured, in local currencies or in international dollars? It would seem strange to calculate the size of government in Somalia, using relative prices that prevail in other countries, but this is exactly what conversion to international prices achieves. What we really want to know is what the government’s share of output is in Somalia, given the relative prices that prevail in Somalia. The fact that government’s share in output would increase if an alternative set of relative prices were used seems irrelevant.
As Summers and Heston (1991, pp. 337–339) point out, the conversion to international dollars also reduces I / Y in low-income countries and increases it in high-income countries. This is due to the fact that investment goods are capital intensive in nature and that the price of labour relative to capital is higher in high-income than in low-income countries. Again, the question has to be asked whether it is more valid to measure I / Y in local, rather than international prices. If it is inappropriate to measure G / Y in international prices, the same arguments presumably apply to I / Y. Summers and Heston (1991, p. 360) appear to agree, arguing that ‘if the share of GDP devoted to capital formation is the form the country’s savings takes, the share calculation should be based on domestic prices rather than international prices.’
The discussion so far raises the question of just how sensitive the data are to whether G / Y and I / Y are measured in international or local prices. The Barro and Lee (1994) data set contains data on G / Y and I / Y from World Bank sources (which are measured in local prices) and from the PWT versions 4
1
and 5 (which are measured in international prices). Given that Barro and Lee (1994) use data from version 4 of the PWT the most relevant comparison would seem to be between the World Bank data and the PWT version 4 data.
For the 117 countries for which data are available for both measures of G / Y, the PWT measure exceeds the World Bank measure by 10 percentage points or more for 15 countries. All 15 countries are developing countries. For 26 additional countries, the PWT measure exceeds the World Bank measure by 5 percentage points or more. The most extreme example is Somalia: G / Y is 12.3% in the World Bank data set, but 33.5% in the PWT data set. For most industrialised countries and oil-exporting countries the World Bank measure is higher than the PWT measure. The correlation
2 coefficient between the two data sets is 0.65.
The World Bank measure of I / Y exceeds the PWT version 4 measure by 10 percentage points or more for 17, out of a total of 116, countries. For an additional 34 countries the World Bank measure is greater by 5 percentage points or more. The vast majority of these countries are developing countries. For one country the World Bank measure is less than the PWT version 4 measure by 10 percentage points or more. For an additional four countries the World Bank measure is 5 percentage points or
3 more lower than the PWT measure.
Whether I / Y and G / Y are measured in local or international prices does make a difference, suggesting that empirical work examining the effect of these variables on economic growth will be sensitive to which measure is used. One paper which makes use of PWT data for both G / Y and I / Y is Barro and Lee (1994). The remainder of this paper will explore how sensitive the Barro and Lee (1994) empirical results are to the use of G / Y and I / Y data measured in local, rather than international, prices.
3. Empirical results
Barro and Lee (1994) estimate the following system of two equations using the seemingly unrelated regressions (SUR) technique:
Dln(GDP)1j5b101b11ln(GDP )1j 1b12MALE1j1b13FEMALE1j1b14ln(LE )1j
(1)
1b15(I / Y)1j1b16(G / Y)1j1b17ln(11BMP )1j 1b18REVOL1j1e1j
where j51, . . . 85
Dln(GDP)2j5b201b21ln(GDP )2j 1b22MALE2j1b23FEMALE2j1b24ln(LE )2j
(2)
1b25(I / Y)2j1b26(G / Y)2j1b27ln(11BMP )2j 1b28REVOL2j1e2j
2
It is also interesting to note that there are some large discrepancies between versions 4 and 5 of the PWT. For example, G / Y for Nepal is 11.9% in version 4 and 47.4% in version 5. For 11 countries there is a difference of more than 10 percentage points between the two measures; in some cases the version 4 measure is higher, in other cases the version 5 measure is higher. The correlation coefficient between PWT versions 4 and 5 is only 0.61.
3
where j51, . . . 95
Subscript i denotes time period 1 (1965–1975) and time period 2 (1975–1985) and subscript j denotes country j. Dln GDP is the average annual growth rate in GDP per capita over the relevant decade (1965–1975 for time period 1 and 1975–1985 for time period 2). GDP is base-period GDP (1965 for time period 1 and 1975 for time period 2). MALE and FEMALE denote base period average years of secondary schooling for males and females, respectively. LE is life expectancy at birth, averaged over the preceding 5 years (1960–1964 for time period 1 and 1970–1974 for time period 2). I / Y and G / Y are the respective shares of real investment and real government consumption (net of nominal spending on education and defence) in real GDP, averaged over the relevant time period. BMP is the black market premium on foreign exchange, averaged over the relevant 10-year period and REVOL is the number of revolutions and coups from 1960 to 1985.
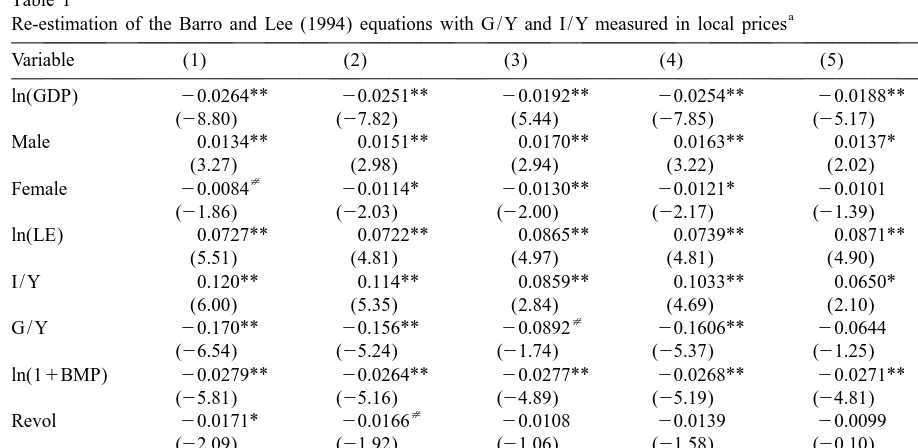
Note that Barro and Lee (1994) estimate an unbalanced panel in the sense that there are ten more observations for 1975–1985 than for 1965–1975. Barro and Lee (1994) do not discuss how they obtained estimates for this unbalanced panel. However, Lorgelly and Owen (1999) show that very similar empirical results to Barro and Lee (1994) are obtained if Eqs. (1) and (2) are estimated for a balanced panel of 85 countries. Column (1) of Table 1 reproduces the results from Barro and Lee (1994), whereas column (2) gives the results obtained by Lorgelly and Owen (1999).
The results reported in column (3) are obtained by re-estimating the Barro and Lee (1994) equation
Table 1
a
Re-estimation of the Barro and Lee (1994) equations with G / Y and I / Y measured in local prices
Variable (1) (2) (3) (4) (5)
ln(GDP) 20.0264** 20.0251** 20.0192** 20.0254** 20.0188**
(28.80) (27.82) (5.44) (27.85) (25.17)
Male 0.0134** 0.0151** 0.0170** 0.0163** 0.0137*
(3.27) (2.98) (2.94) (3.22) (2.02)
[
Female 20.0084 20.0114* 20.0130** 20.0121* 20.0101
(21.86) (22.03) (22.00) (22.17) (21.39)
ln(LE) 0.0727** 0.0722** 0.0865** 0.0739** 0.0871**
(5.51) (4.81) (4.97) (4.81) (4.90)
I / Y 0.120** 0.114** 0.0859** 0.1033** 0.0650*
(6.00) (5.35) (2.84) (4.69) (2.10)
Revol 20.0171* 20.0166 20.0108 20.0139 20.0099
(22.09) (21.92) (21.06) (21.58) (20.10)
2
R 0.7597 0.6681 0.7670 0.5984
N 85, 95 85, 85 81, 81 81,81 77, 77
a [
for a balanced panel of 81 countries, but with G / Y (net of spending on education and defence) and I / Y data measured in local prices. The data are originally from World Bank sources and are reported in the Barro and Lee (1994) data set. The coefficient on I / Y remains significant at the 1% level, but the t-statistic is substantially lower than that obtained by Barro and Lee (1994). The coefficient on G / Y is now only significant at the 10% level, with the point estimate having fallen by almost one half.
Another possible explanation for the reduced significance of G / Y and I / Y could be due to the reduction in sample size from column (2) to column (3). To eliminate this possibility, the Barro and Lee (1994) equations (with G / Y and I / Y measured in international prices) were re-estimated for the reduced sample of 81 countries. The results are reported in column (4). As the absolute value of the point estimate and t-statistic for G / Y are higher than in column (2) it would seem that the omission of these four countries is not responsible for the reduced significance of G / Y in column (3).
Lorgelly and Owen (1999) have shown that the significance of the human capital variables is reduced if Hong Kong, Singapore, Taiwan and South Korea are omitted from the sample. It is, therefore, of interest to see how sensitive the results in this paper are to the exclusion of these four countries. The results obtained when these countries are omitted from the data sample are reported in column (5). Note that G / Y is now insignificant. Once G / Y is measured in local currencies and four potentially influential observations are removed from the sample, there is no significant partial correlation between economic growth and G / Y. I / Y is now significant at the five percent, rather than the 10%, level.
4. Conclusion
Several studies examining the effect of G / Y and I / Y on economic growth have used data from the PWT to measure these ratios. The PWT data are transformed so that world average relative prices are imposed on all economies. This has the effect of artificially increasing G / Y for developing countries and reducing it for developed countries. The opposite pattern occurs for I / Y. This paper has argued that this is inappropriate. It has been shown that the empirical results of Barro and Lee (1994) are sensitive to whether these ratios are measured in local or international prices. The PWT data are appropriate when comparing income per capita across countries, but ratios such as G / Y and I / Y are more appropriately measured in local currencies.
Acknowledgements
I am grateful to Robert Alexander, Mike Bleaney, Richard Cornes, Rod Falvey, Arlene Garces, Norman Gemmell, Alan King and Dorian Owen for their helpful comments on this paper.
References
Barro, R.J., 1991. Economic growth in a cross section of countries. Quarterly Journal of Economics 106, 407–443. Barro, R.J., Lee, J.-W., 1994. Sources of economic growth. Carnegie–Rochester Conference Series on Public Policy 40,
Barro, R.J., Sala-i-Martin, X., 1995. Economic Growth. McGraw-Hill, New York.
Collins, S.M., Bosworth, B.P., 1996. Economic growth in East Asia: Accumulation versus assimilation. Brookings Papers on Economic Activity 2, 135–191.
Gemmell, N., 1995. Endogenous growth, the Solow model and human capital. Economics of Planning 28, 169–183. Gemmell, N., 1996. Evaluating the impacts of human capital stocks and accumulation on economic growth: Some new
evidence. Oxford Bulletin of Economics and Statistics 58, 9–28.
Knowles, S., Owen, P.D., 1995. Health capital and cross-country variation in income per capita in the Mankiw–Romer–Weil model. Economics Letters 48, 99–106.
Knowles, S., Owen, P.D., 1997. Education and health in an effective-labour empirical growth model. Economic Record 73, 314–328.
Knowles, S., Lorgelly, P.K., Owen, P.D., 2001. Are educational gender gaps a brake on economic development? Some cross-country empirical evidence. Oxford Economic Papers, forthcoming.
Lorgelly, P.K., Owen, P.D., 1999. The effect of female and male schooling on economic growth in the Barro–Lee model. Empirical Economics 24, 537–557.
Mankiw, N.G., Romer, D., Weil, D.N., 1992. A contribution to the empirics of economic growth. Quarterly Journal of Economics 107, 407–437.
Ram, R., 1986. Government size and economic growth: a new framework and some evidence from cross-section and time-series data. American Economic Review 76, 191–203.
Summers, R., Heston, A., 1988. A new set of international comparisons of real product and price levels estimates for 130 countries, 1950–1985. Review of Income and Wealth 34, 1–25.
Summers, R., Heston, A., 1991. The Penn World Tables (mark 5): an expanded set of international comparisons, 1950–1988. Quarterly Journal of Economics 106, 327–368.