ANCIENT STRUCTURES AND NEW TECHNOLOGIES: SURVEY AND DIGITAL
REPRESENTATION OF THE WOODEN DOME OF SS. GIOVANNI E PAOLO IN
VENICE
C. Balletti a, M. Berto b, C. Gottardi b, F. Guerra a
a
Laboratorio di Fotogrammetria, Sistema dei Laboratori, Università IUAV di Venezia, Santa Croce 191, 30135, Venice, Italy - (balletti, guerra2)@iuav.it
b
(matteo.berto.86, caterina.gottardi)@gmail.com
Commission V, WG V/2
KEY WORDS: Survey, Cultural Heritage, Laser Scanning, Complex Architecture, 3D Modelling
ABSTRACT:
The aim of this research is to study the wooden structure of the dome of SS. Giovanni e Paolo in Venice. The main purpose of this work is to analyse the shape and the geometrical and spatial knowledge of a very articulated structure that was very common in the Venetian architectural tradition of the XIV and XV century. Because of its complexity, a laser scanning survey, with the support of more traditional methods, such as direct and topographic survey, seemed to be the best way to analyse this type of structure and to obtain the information directly in a 3D environment. It was decided to use this technique given the features of the space: the reduced visibility, due to the absence of lighting, a very small planking level and a high number of wooden elements with irregular shapes make this structure fascinating and complex and the same time. The laser scanning survey allowed a quick and accurate data acquisition; from the elaboration of the data it was possible to create a 3D model of each individual element in the environment, without applying a simplification of shape and spatial geometry. The result of this research is not only the creation of a 3D model of a wooden dome, studying its formal and spatial complexity, but also the identification of an operational workflow that can be applied in surveys of complex wooden structures. This paper analyses the difficulties encountered during the survey process, and it illustrates the solutions chosen to overcome them.
1. INTRODUCTION
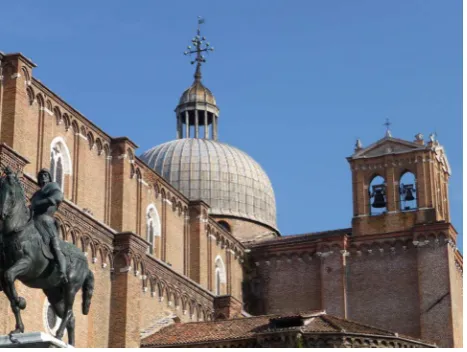
This work arose from the will of studying and analysing one of the most fascinating and particular architectural techniques in Venice: the wooden domes. The dome of SS. Giovanni e Paolo was the perfect case study: it had not been entirely studied yet and it was possible to access it safely to carry out the survey and the necessary geometrical analysis.
Figure 1. The dome of SS. Giovanni e Paolo.
The aim of this research was to analyse the shape and the spatial complexity that distinguish this particular architectural structure. We tried to create a specific methodology to study the structure and we also obtained an operational procedure for
future surveys of similar structures. The result, obtained after the editing of point-clouds, is a 3D model of each one of the dome’s elements, regardless if it is a wooden, wall, or metallic element. Different phases were needed to achieve the final result: on-site inspections in the Basilica and the dome, on-site data acquisition which was carried out in two days and finally data elaboration and creation of the 3D model. It was also necessary to scan the interior of the Basilica, in order to study the curvature of the wall intrados of the dome. The survey has been carried out together with an historical research with the aim of acquiring as much information and drawings as possible on the architectural evolution: the graphic and bibliographic documentation of the wooden dome was indeed scarce. The survey allowed us to obtain a deeper knowledge of the structure and therefore to read the XIX-century drawings and historical representations in a more critical way than when we first started. The model shows the formal differences of the structure in comparison with the historical representations. Not only the wooden elements are represented in a different position, but also they are represented with a more regular and simplified geometry than it is in reality.
Data acquisition through laser scanner and the further 3D modelling is a very well known method in architecture and in the field of cultural heritage. Thanks to the laser scanning technique it is possible to analyse and study the object in a 3D environment, even from the georeferencing of the point-clouds obtained from the scans. In addition, with this model it is possible to understand the geometry of the wooden beams and it also works as a support for further analysis, for example in the conservation field. The representation of the three dimensions allows the reading of the condition of elements, and the model can be used as a database of the architectural parts (Fregonese et al., 2009a).
A wooden system as complex as the one of the venetian domes can only be represented with a 3D model. This is the only way to clearly read the whole structure in its complexity. At first, the big architectural structures can be very difficult to read and to separate into their different parts; this happens because more elements were added during the restoration works that can alter the original shape, which becomes often more complex. However, with the model it is possible to read the single parts and understand the hierarchical structure.
The laser scanning technique was the best procedure to create a 3D model of such a geometrical complex structure as is the dome of SS. Giovanni e Paolo. The model had to be not only accurate, but also easily understandable in each of its different elements and this was possible only thanks to the applied survey method. Moreover, the model was not thought to be only an end in itself, but to be measured and analysed in the future, adding new information, if necessary (Fassi et al., 2011).
In the following paragraphs a brief historical introduction of the dome of SS. Giovanni e Paolo will be made (Sec. 2), followed by a description of the methods used to carry out the survey of the wooden and wall structure. Data acquisition (Sec. 3) and elaboration processes (Sec. 4) are described together with the creation of the 3D digital representations (Sec. 5). To conclude, final considerations on the research and the aims achieved are presented (Sec. 6,7).
2. THE DOME OF SS. GIOVANNI E PAOLO BASILICA
The dome of SS. Giovanni e Paolo was built around the half of the XV century, even though there is not a certain date (Merotto Ghedini, 2000). What is known is that this dome is part of an architectural tradition that was born with the 5 domes of St. Mark’s Basilica: wooden structures that start from the tambour of the wall domes and that rise on the lagoon landscape, looking for the volumetric elevation in comparison to the surrounding buildings. The structure of the SS. Giovanni e Paolo dome, as well as all the domes of the same period, presents a few differences in some of the structure’s wooden elements from St. Mark’s Basilica, but the architectural model is pretty much the same. It is only in the second half of the XVI century, with the construction of the San Giorgio Dome by Palladio, that tradition undergoes a simplification process, influencing the wooden structures from now on (Piana, 2009).
Figure 2. Historical dome's images of the second half of the XX century.
As far the architectural evolution of the dome of SS. Giovanni e Paolo is concerned, the documents we have found are dated from the XIX century. Around the half of the century substantial changes were carried out that modified the wooden structure radically. In addition to some important but common
maintenance works, such as the reconstruction of the wooden roof and of the external lead, a new complex system of wooden and metal elements was added and this changed the overall architecture of the wooden dome completely. In the following years until today, all changes were made to preserve the structure but no substantial alterations were made to the wooden system.
3. DATA ACQUISITION
Since the first inspections we were aware of the survey problems in such a complex environment as it is the one of the SS. Giovanni e Paolo. The reduced visibility due to the absence of lighting, a very small planking level and a high number of wooden elements with irregular shapes make this structure extremely complex to be surveyed. The base has a width of approximately 14.5 metres, the height from the planking level to the roof is approximately 10 metres and these become 23 metres if you add the lantern and the cross on the top. The planking level where the wooden elements of the structure are based, has a width of 60cm. It became clear the difficulty of using traditional survey methods such as direct or photogrammetric survey, and therefore it was decided to use the laser scanning technique for the metric survey (Balletti et al., 2003). With this technique it was possible to overcome all the problems described above: contrary to the passive sensors (topography and photogrammetry), while making the measure the laser huge amount of points has allowed us to accurately identify the geometry of the structure and thanks to the short scanning time it was possible to reduce the in situ survey time. Moreover, the reduced dimensions and weight of the laser scanner we used - definitely more handy than those used a few years ago - allowed us to take it up to the dome with no problems.
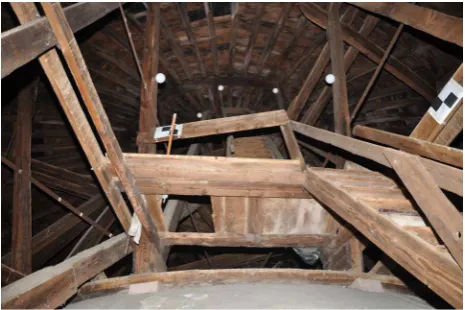
Figure 3. The wooden structure of the dome and of the staircase that takes people up to the top.
The structure has an octagonal scheme, but with the changes made in the XIX century, the observer will perceive a different division, highlighted by the 12 systems of wooden elements. This is the reason why we decided to put the laser scanner in each of the twelve spans. The other scans were carried out from the intermediate and top landing of the staircase that takes you to the top part of the dome, and from the stairs that goes outside: in this way it was possible to scan a great part of the lantern.
For all the scans we used the laser scanner phase shift FARO Focus 3D. This laser scanner has a range from 0.6m to 120m, with an accuracy of ±2mm for distances included in a range from 10 to 25 meters. It has a vertical visual field of 305° and a horizontal one of 360°. Moreover, it has a measurement speed up to 976.000 points/sec. A digital camera with a 70 megapixel resolution is integrated in the laser scanner.
The acquisition resolution selected for this work was set up to have 1 point every 6 mm at a distance of 10 meters; however the high number of scans and their very close distance to the analysed object have permitted to obtain very dense point clouds, for a total of 800 millions points.
In this case, the selected speed of acquisition (244 kpt/sec) allowed fast scanning times (approximately 7-8 minutes per scan). The main problem of such a huge quantity of data acquisition is the very difficult management in the next phase of data processing.
In the processing phase the scans’ elaboration programme recognises easily some signalization systems. For this reason high-contrast and spherical targets (with a diameter of 12cm) were positioned. The acquisition of the scans with the laser scanner was carried out together with a topographic support for a better control in the alignment and registration phases and especially due to the complexity and the structure of the space: for the acquisition of the points we used the total station Leica TCR 1103. In this case, for the collimation of the control points, local lighting systems were used to identify the targets.
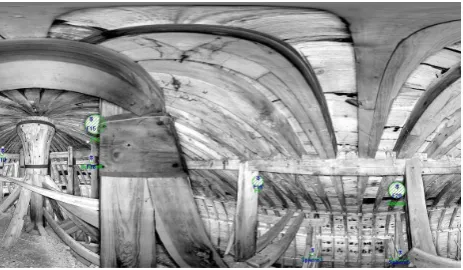
Figure 4. The wooden structure and one of the spherical target that we used for the survey.
Data acquisition was carried out in two days. During day one we created the topographic support with the total station, we carried out the scans from the intermediate landing, the top landing and three scans of the planking level. During day two we finished all the spans at the basement. A total of 20 scans and 860 million points were acquired inside the wooden dome. During the modelling phase, to analyse the curvature of the intrados, it was necessary to do other two scans from inside the Basilica. In this case the targets were positioned in the apsidal part and in the last two columns of the aisle before the transept.
4. DATA PROCESSING
The twenty scans have been aligned through the semi-automatic recognition of the targets positioned on the timber elements in the acquisition phase; the average precision obtained in the scans alignment was 4 mm. Some targets were collimated with the total station to guarantee the verticality of the local reference system and to georeferentiate the point-clouds in the same reference system, after their alignment.
Figure 5. The recognition of the targets using FARO Scene.
In this case, due to the weak lighting conditions illustrated before, the point-clouds were exported with the intensity value: the scans have not been “coloured” with RGB values recorded by the laser scanner camera. The same processing job was done with the two scans inside the Basilica. However, in this case the scans have been “coloured” with images, as the light conditions made it possible to realise a better photographic acquisition than the one done in the dome.
At the end of the process we obtained a very dense and detailed quantity of data: in the case of the 20 scans of the wooden system a total of 863.665.301 points were scanned, processed and registered. The point-clouds were then edited: all the data recorded by the laser scanner that were considered unnecessary were deleted, like a few parts of the roof that could be seen through the holes at the base of the dome. At the end of the elaboration process, the cloud had a total of 861.912.073 points.
Figure 6. On the left the sectioned point-cloud; on the right the entire point-cloud inclusive of the 20 scans at the 4 different
levels.
Figure 7. Image of the point-cloud of the intrados of the Basilica's dome.
The software that we used for data processing are FARO Scene, for the alignment and the registration of the point-clouds, and Pointools, that allows a better management of the data and a rapid visualization of them.
The final elaboration of the data allows to obtain a representation for the 1:50 scale, as previously set during the survey's project phase; however the traditional drawings allow only in part to understand the wooden system in its spatial complexity and to analyse the process carried out during the technical construction phase. On the contrary a 3D model allows visualizing the structure’s complexity clearly and in an immediate way; for this reason at the end we choose a 3D digital representation.
5. MODELLING AND DATA REPRESENTATION
Once the point-clouds were processed, we moved on to the 3D modelling. The entire model was created using Autocad. The workspace choice doesn't allow any automation during the modelling process, and it guarantees the coherence of the model with the surveyed data. In fact, thanks to Pointools for Autocad plug-in, it was possible to visualize and work directly on the point-cloud, "coloured" or with intensity values, to extract the sections or the useful profiles.
Each vertical and oblique element was modelled with solid and loft surfaces from the extraction of profiles derived from horizontal sections of the cloud at different heights. The horizontal elements, geometrically simpler, were then created with the extrusion of solids from vertical profiles. For the curved objects, such as the wall dome, sections were extracted radially, with respect to a common centre.
The solid modelling and loft surfaces allow keeping a good adherence to the data surveyed; in fact, the cross sections define the profile of the resulting solid. With the more complex elements we made a high number of sections and we specified the path or the guides for a better control on the surface or solid shape, as for the curved roof elements. Thanks to the boolean operations, all the wooden system's joints were made. These conditions, together with the possibility of using a high number of profiles directly from the point cloud, guarantee the geometrical coherence with the real data.
All data for the graphical part come from the processing of the twenty scans of the wooden dome and the two scans from inside the Basilica. Only for the modelling of the external cross, aerial Lidar data were used, acquired for a bigger research of Venice and of SS. Giovanni e Paolo insula; in this way we were able to read some of the measures between the summit points, despite being sparse, and getting the size of the cross on the lantern.
Figure 8. Generation of solids from laser data sections.
The modelling process of the wood, metal and masonry elements present in this environment, was carried out without applying a general simplification of geometry and space. We
did not use the rationalization of the structure, which instead was represented by its spatial irregularities and formal anomalies of the elements that compose it.
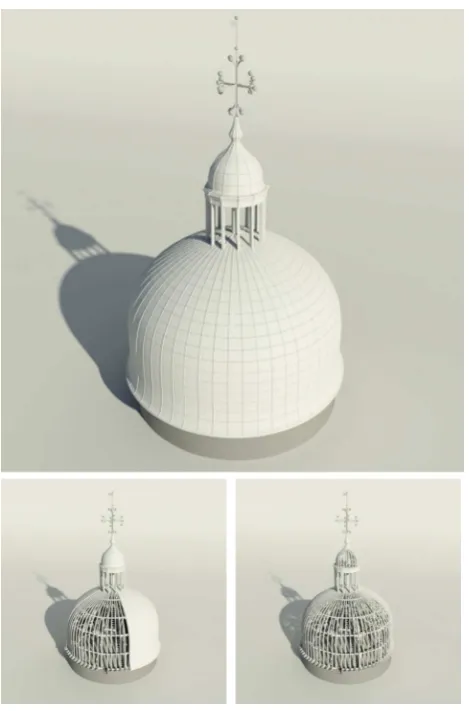
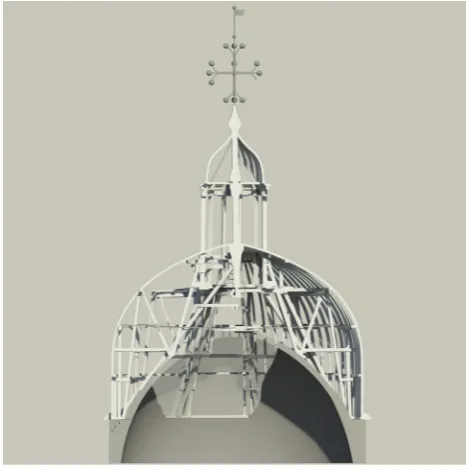
Figure 9. Images of the entire 3D model made with 3DStudioMax.
Figure 10. 3D digital representations made using 3DStudioMax.
Although the regularisation of the wooden structure would have allowed a process simplification, especially in the modelling timing, we decided not to do any rationalization of the shapes, in order to analyse the real geometry and to allow future applications of the model in the restoration and structural analysis fields, if required. For this reason, every single element was modelled according to the geometry and the real position. The final result was obtained after some months of data elaboration and modelling in Autocad. The 3D model visualisation and the video-animations were made by 3D Studio ISPRS Annals of the Photogrammetry, Remote Sensing and Spatial Information Sciences, Volume II-5/W1, 2013
Max; in particular, these are very important to understand the constructive process of this Venetian architectural technique. Thanks to the 3D digital representation, and to subsequent animations that can be achieved the 3D representation, it is possible to clearly grasp the spatial distribution of all the elements that compose the dome of SS. Giovanni e Paolo.
6. RESULTS AND READING OF THE MODEL
The knowledge method applied in this study case, with the laser scanning survey and digital modelling, allowed us to understand the geometry and the spatial complexity of one of the most particular techniques of the Venetian architectural tradition. Because of the complexity and constructive peculiarity of this structure, there are very few examples on the wooden systems of domes that can be compared, except for the analysis conducted on two of the five domes of St. Mark’s Basilica: Pentecoste and Profeti (Fregonese et al., 2009b). In fact, often, survey and structural analysis campaigns are carried out on the walls and on the intrados of the domes and vaults (Tucci et al.,2011).
Moreover, even though the general organization of the wooden beams derives from St. Mark’s domes, each Venetian dome is a case on its own with a different element composition and its collocation in space.
The 3D model, allows an immediate reading of the information about shape and dimensions of the structure; the virtual navigation allows perceiving the whole architectural system, which is impossible to clearly recognize in the real environment. In addition, the animations created allow spreading the knowledge of this construction technique to people who are not specialized in this sector.
The analysis of the shapes of this structure is fundamental not only for the knowledge of the complicated wooden system and of the ranking composition of the elements that create it, but also for other analysis and considerations, for example about the state of condition and decay (Fregonese et al., 2009b) or its historical architectural evolution.
Figure 11. Comparison between the historical section (1850s) and the actual one obtained with a laser scanning survey.
Thanks to the model obtained through the above described procedure, it has been possible to confront a section of the actual state of the dome with a drawing realised around the 1850s. As we can see from the pictures, the XIX-century drawing was realised with some simplification of the elements, preferring a much artistic but geometrically less correct view.
Not only some wooden beams are represented in a different position compared to reality, but also the geometry of some elements, as the curvature of the roof and of the wall dome, is represented with a regular shape, whereas the model shows us that they cannot be brought back to a known geometry.
7. CONCLUSION
To conclude it can be said that this research showed that the SS. Giovanni e Paolo dome was the perfect study case of the laser scanning survey for complex structure analysis. In fact, thanks to the accuracy and the large amount of laser scanner data acquisition in a relatively short time, it was possible to study in a very detailed way an architecture with such a geometrical and spatial complexity (Vacca et al., 2012).
The 3D model allows to clearly and quickly understand a structure that is otherwise hard to comprehend. Moreover, the model was created not only as an instrument for the geometrical and spatial knowledge of the dome, but also in order to be useful for further researches: the survey is firstly an analysis of the shapes and then it can be used as a support for the other investigations in the architectural field. For example, its application in the conservative field becomes obvious as a spatial support for every worthwhile analysis: the model becomes an important documentation of the state of condition of the wooden beams and it also might be used as an archive of each one of the objects that contributes to compose such an interesting structure and with such an important architectonic value.
Figure 12. Image of a section of the 3D model made with 3DStudioMax.
The survey and the subsequent 3D modelling, allow an easy comprehension of the wooden elements of this complex constructive system and they are the basis for the creation of a database where it is possible to georeferenciate the information about the wooden structure. Every single element can be catalogued, for example, according to its structural function, type of wood, conservation status and maintenance and renovation interventions carried out in the past. The results allow many future applications, especially in the conservative and diagnostic field.
At the end of this work, we would like to present this methodology as an operational workflow for the survey of Venetian historical wooden roofs and, in particular, for wooden domes.
8. REFERENCES
References from Journals:
Piana, M., 2009. San Giorgio e le cupole lignee lagunari. Annali
di Architettura, 21, pp. 79-90.
References from Books:
Guidi, G., Russo, M., Beraldin, J.A., 2010. Acquisizione 3D e
modellazione poligonale, McGraw-Hill Companies.
References from Other Literature:
Balletti, C., Guerra, F., Gerbaudi, F., 2003. The survey of the wooden structure of the roof of Palazzo Ducale in Venice. In:
The International Archives of Photogrammetry, Remote
Sensing, and Spatial information Sciences, Ancona, Italy, vol.
XXXIV, Part 5/W12, pp. 49-53.
Fassi, F., Achille, C., Gaudio, F., Fregonese, L., 2011. Integrated Strategies for the modeling of very large, complex architecture. In: The International Archives of the Photogrammetry, Remote Sensing and Spatial Information
Sciences, Trento, Italy, vol. XXXVIII, Part 5/W16, pp. 105-112.
Fregonese, L., Scaioni, M., Taffurelli, L., 2009a. Generation of a spatial information system for architecture with laser scanning data. In: The International Archives of Photogrammetry,
Remote Sensing, and Spatial information Sciences, Paris,
France, vol. XXXVIII, Part 3/W8, pp. 87-92.
Fregonese, L., Taffurelli, L., 2009b. 3D model for the documentation of cultural heritage: the wooden domes of St. Mark’s Basilica in Venice. In: The International Archives of the Photogrammetry, Remote Sensing and Spatial Information
Sciences, Trento, Italy, vol. XXXVIII, Part 5/W1, pp. 1-6.
Merotto Ghedini, M., 2000. Santi Giovanni e Paolo. In:
L’architettura gotica veneziana, ed. by Francesco Valcanover
and Wolfgang Wolters, Venice, Italy, Istituto Veneto di Scienze, Lettere ed Arti, pp. 115-122.
Tucci, G., Nobile, A., Riemma, M., 2011. The Basilica della Madonna dell’Umiltà in Pistoia: survey, analysis and documentation. In: Proceedings of XXIII International CIPA
Symposium, Prague, Czech Republic, 12-16 September, pp. 1-8.
Vacca, G., Deidda, M., Dessi, A., Marras, M., 2012. Laser scanner survey to cultural heritage conservation and restoration.
In: The International Archives of the Photogrammetry, Remote
Sensing and Spatial Information Sciences, Melbourne,
Australia, vol. XXXIX, Part B5, pp. 589-594.