EMPIRICAL RELATIONSHIP BETWEEN LEAF BIOMASS OF RED PINE FORESTS
AND ENHANCED VEGETATION INDEX IN SOUTH KOREA USING LANDSAT-5 TM
A. Gussoa*, J. Leeb, Y. Sonb, Y. M. Sonc
a Environmental Engineering, Polytechnic School, UNISINOS, São Leopoldo, Brazil – [email protected]
b Dept. of Environmental Science and Ecological Engineering, Graduate School, Korea University, Seoul, Korea – [email protected], [email protected]
c Dept. of Forest Industry Research, Korea Forest Research Institute, Seoul, Korea – [email protected]
Commission VIII, WG VIII/7
KEY WORDS: Vegetation Index Profile, Multi-temporal, Foliage Biomass, Tree Age, Red Pine Development, Carbon Storage
ABSTRACT:
Research on forest carbon (C) dynamics has been undertaken due to the importance of forest ecosystems in national C inventories. Currently, the C sequestration of South Korean forests surpasses that of other countries. In South Korea, Pinus densiflora (red pine) is the most abundant tree species. Thus, understanding the growth rate and biomass evolution of red pine forest in South Korea is important for estimating the forest C dynamics. In this paper, we derived empirical relationship between foliage biomass and the no blue band enhanced vegetation index (EVI-2) profile using both field work and multi-temporal Landsat-5 TM remote sensing data to estimate the productivity of forest biomass in South Korea. Our analysis combined a set of 84 Landsat-5 TM images from 28 different dates between 1986 and 2008 to study red pine forest development over time. Field data were collected from 30 plots (0.04 ha) that were irregularly distributed over South Korea. Individual trees were harvested by destructive sampling, and the age of trees were determined by the number of tree rings. The results are realistic (R2=0.81, p< 0.01) and suggest that the EVI-2 index is able to adequately represent the development profile of foliage biomass in red pine forest growth.
1. INTRODUCTION
1.1 South Korean Forest
Forest ecosystems contain a substantial amount of carbon (C) and contribute to global C cycles (Dixon et al., 1994; Pan et al., 2011). Forest C dynamics have been studied due to the importance of forest ecosystems in national forest C inventories. Thus, it is crucial to understand forest C dynamics to report national C inventories and implement optimal policies.
South Korean forests sequester atmospheric C (Lee et al., 2014). These forests were almost destroyed after being exploited by the Japanese and the Korean War. However, South Korean forests started recovering after the national scale reforestation program was started in 1973. Currently, the C sequestration of South Korean forests surpasses that of other countries (Lee et al., 2014). Pinus densiflora (red pine) is the most abundant tree species in South Korea (KFRI, 2011). Therefore, understanding the growth rate and biomass evolution of red pine forests in South Korea is important to estimate the impacts and vulnerability of forests to the natural and anthropogenic processes of forest C dynamics. In South Korea, the forest biomass has naturally increased with small variations from disturbances created by natural processes and seasonal variations or disturbances, such as fire, extreme weather and insects. The main anthropogenic process is harvesting.
1.2 Biomass Estimation
Estimation of forest biomass by satellite remote sensing has been investigated at various spatial scales and environments (Huete et al., 2006; Schroeder et al., 2006; Haidar et al., 2013),
and the most frequently used data continue to be from moderate resolution optical sensors.
Although temperate coniferous forests are abundant, few remote sensing studies have estimated the biomass of pine forests. Changes in the foliage biomass can be an indicator of total biomass changes of South Korean forests. In this paper, we derive the empirical relationship between foliage biomass and the no blue band enhanced vegetation index (EVI-2) values, based on both field work and multi-temporal remote sensing data. We aimed to study the relationship between foliage biomass and the EVI-2 values as a preparatory step for estimating the productivity of biomass in South Korea. The original EVI is an index of canopy photosynthetic capacity (Huete et al., 2006) that maintains sensitivity to canopy structural variations and canopy type, even in high LAI canopies (Huete et al., 2002). The EVI is less prone to saturation in temperate forests (Huete et al., 2006), with moderate or finer spatial resolution (Huete et al., 2002). Thus, the EVI-2 can be used to observe changes in the gross primary productivity (GPP) of forests, and this relationship could be used in modelling.
2. MATERIALS AND METHODS
2.1 Study Area
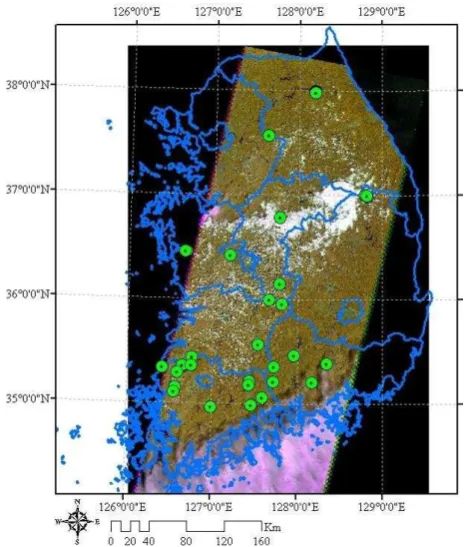
Figure 1. Landsat-5 TM image (RGB 453) of the study area acquired on Sep. 9th 2007 and sampling plot in South Korea.
2.2 Field Work
The field surveys were conducted during the summer of 2007. The data were collected from 30 plots that were irregularly distributed over South Korea, with each area covering approximately 0.04 ha. In the sampling procedure, five individual trees were harvested by destructive sampling and the foliage biomass was directly weighed at each plot. The weighed foliage biomass of individual trees was converted to a total foliage biomass for each plot. The stand age of the trees was determined by the number of tree rings on a disc. In this procedure, annual rings were measured on the discs of the remaining stump 0.2 m above ground, counting from the centre outwards and marking every 5th ring (years) (KFRI, 2010). Then, the observations of tree age were averaged for each sampling plot. The estimated foliage biomass and stand age were paired at each plot.
2.3 Landsat-5 TM Data Set Calibration
Our analysis combined a set of 84 Landsat-5 TM images on 28 different acquisition dates from 1986 to 2008 to study red pine forest development through time in the visible spectrum. The analysis procedure consisted of monitoring multi-temporal changes in the red pine forests that lead to the spatial and temporal variations in the vegetation index for each site sampled. Regarding the seasonal effects and fluctuation of vegetation cover conditions, particularly in drought-free years, well-developed vegetation only reflects a small portion of incident solar radiation in the visible bands of the spectrum because of the absorption properties of chlorophyll and other plant pigments that absorb sunlight (Gusso and Ducati, 2012). Background contamination can cause an imbalance in the relation between bands 3 and 4 (EVI-2 calculation), potentially
leading to decreases in the resulting EVI-2 values. In the near infrared (NIR) region of the spectrum, plants show increased reflectance because of the scattering effect caused by the internal structure and water content of leaves (Jensen, 2007). However, obtaining a high quality-image is essential to avoid seasonal and cloud contamination effects in our analysis. For an accurate combination of images, it is important to consider temporal separation. Based on the proximity of acquisition dates, 3 groups of images were established by decade, as shown in Table 1. In this study, the data sources used for vegetation index analysis included the following:
i. For the multi-temporal analysis, we selected 10 sampling plots (20 m x 20 m) that were dominated by red pine tree species no older than 35 years after planting;
ii. Landsat-5 TM images were obtained from Earth Explorer, distributed at no charge by the U.S. Geological Survey (USGS). Landsat-5 TM satellite data in digital numbers (DN) with a 30-m spatial resolution was used to perfor30-m the at30-mospheric calibration and extract the EVI-2 profile.
Table 1. Selected Landsat-5 TM imagery
surface reflectance data, the images were also atmospherically corrected according to Chavez (1996), as variations of atmospheric conditions are spatially and temporally significant (Chander et al., 2009). Full absolute image correction includes the atmospheric- and sensor-related parameters and the derivation of physical units, such as reflectance (Schroeder et al., 2006).
The atmospheric correction process is based on the Dark-Object Subtraction concept, which depends on the wavelength of visible bands and is related to a weighted displacement effect of each band on a per-pixel-basis, according to the work of Chavez et al. (1988, 1996). Using this approach, the data necessary to perform atmospheric correction in the visible bands 1–5 from Landsat-5 TM can be obtained from the image itself (Sobrino et al., 2004) by restricting the atmospheric influence, as there is radiation transfer from the Earth’s surface to orbiting sensors. As an additional control for the radiometric quality and reduction of the atmospheric effects, the Landsat-5 TM images were held to a threshold criterion in the image processing protocol (Gusso et al., 2014). In this condition, the image was not used when the amount of atmospheric contamination effects exceeded 70 DN in the blue band (452–518 µm).
Initially, the TOA calculation step consisted of applying a simple radiance–reflectance conversion for each band of the Landsat-5 TM image according to Equation 1.
(1)
where L is the spectral radiance at the sensor (Wm−2sr−1 m−1);
d is the distance between the Earth and the Sun in astronomic units (UA);
ESUN is the average solar exoatmospheric irradiance (Wm−2 m−1);
and θz is the solar zenith angle (degrees).
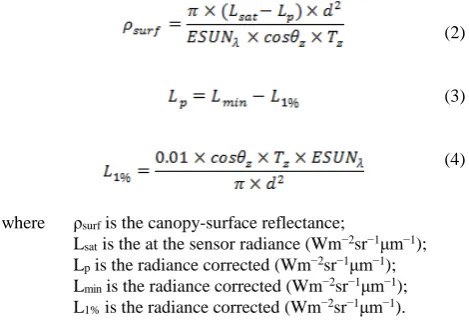
The atmospheric correction process is applied by substituting the term L obtained during the DN to radiance conversion, as the L parameter is converted to canopy-surface reflectance, as shown in Equations 2, 3 and 4.
(2)
(3)
(4)
where ρsurf is the canopy-surface reflectance;
Lsat is the at the sensor radiance (Wm−2sr−1 m−1); Lp is the radiance corrected (Wm−2sr−1 m−1); Lmin is the radiance corrected (Wm−2sr−1 m−1); L1% is the radiance corrected (Wm−2sr−1 m−1).
After performing the atmospheric correction from DN values to canopy-surface reflectance, bands 3 and 4 were used to generate the EVI-2 according to Jiang et al. (2008). Adequate correction of atmospheric effects is very important because it allows for the generation of a representative value for red pine forest development. The EVI-2 is a two-band version of the EVI that
has been developed for sensors without a blue band that is equivalent to the EVI (Jiang et al., 2008). However, regarding atmospheric and soil contamination effects, the EVI-2 was found to be less sensitive to aerosol contamination (Huete et al., 2002; Huete et al., 2006) due to poor quality data from atmospheric scattering in the blue band (Didan and Huete, 2006). Thus, the EVI-2 calculation (Equation 5) can be used as an acceptable substitute for EVI over atmospherically corrected pixels (Jiang et al., 2008), especially when using satellite imagery with a 30-m spatial resolution.
In the equation below, NIR and Red represent the corrected canopy-surface reflectance in the near-infrared and red bands, respectively, of the Landsat-5 TM image.
(5)
where NIR is the surface reflectance in band 4; Red is the surface reflectance in band 3.
The generated image product is composed of cloud-free images and good-quality geo-referencing metrics.
3. RESULTS AND DISCUSSION
3.1 Red Pine Forest Growth
Considering the continuous growth of the red pine tree cycle, we chose a negative second-order polynomial function. Once the red pine forest EVI-2 profile reaches its maximum and plateaus after 90 years of age, it enters the senescence period. Table 2 shows the basic statistics of the minimum EVI-2 values for a 3×3 pixel window, with the age and standard deviation (SD) for each measurement.
Table 2. Sample plot ID, age and EVI-2 values from a combined image from 2005 to 2008.
3.2 EVI for Forest Soil Surface
As the results from the analysis of sampling plots show, the development cycle of red pine increases over the first 35 years after planting. Starting with the first sample plot with 10 years after planting (Table 2), we needed to estimate the ground zero value of the EVI-2 related to the forest soil surface at age zero. Reports from the Korean Forest Service state that there was a clear cut procedure in 2007, but does not specify where. To identify sampling plots representative of clear cut, we analysed the basic statistics of the most recent composite of maximum Sample plots Age SD_Age EVI-2 SD_EVI-2
EVI-2 images that combined 6 images from 2007 and 2008. Table 3 shows basic statistics with the minimum EVI-2 values for a 3×3 pixel window and the minimum values found at sampling plots IDs 9 and 22. By averaging these two minimum EVI-2 values, we estimated a 0.269 EVI-2 value to be used as representative of the above ground forest soil surface.
Table 3. Sampling plots of clear cut with EVI-2 values
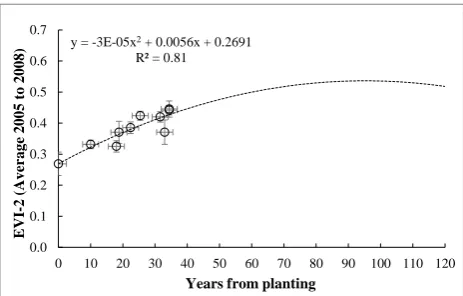
Using this approach, a negative second-order polynomial relation can be described by the mathematical equation y=−α×x2+ ×x+ . On the sampling plot scale, the results show a non-linear correlation (R²=0.81, p< 0.01) between EVI-2 and stand age. Figure 2 shows the relationship between EVI-2 and red pine forest growth.
y = -3E-05x2+ 0.0056x + 0.2691
R² = 0.81
0.0 0.1 0.2 0.3 0.4 0.5 0.6 0.7
0 10 20 30 40 50 60 70 80 90 100 110 120
EVI
-2
(A
ver
age
2005 t
o
2008)
Years from planting
Figure 2. Relationship between the average EVI-2 and age of red pine forest for each sampling plot.
4. CONCLUSIONS
The results suggest that EVI-2 data from Landsat-5 TM images are able to adequately represent the development profile of foliage biomass related to red pine forest growth. We also described a new mathematical approach for representing the development profile of foliage biomass related to red pine forest growth in South Korea. Our results can aid further studies that explore this relationship, helping to improve the reliability of C storage models using satellite imagery.
ACKNOWLEDGEMENTS
We wish to thank the National Aeronautics and Space Administration (NASA) and the U.S. Geological Survey (USGS) for providing information and the Landsat-5 TM data. We also thank the University of Vale do Rio dos Sinos (UNISINOS) and the Korea Forest Service (S111315L100120) for support. Thanks are also due to the Korea Forest Research Institute for sharing field data.
REFERENCES
Chander, G., Markham, B.L., Helder, D.L. 2009. Summary of current radiometric calibration coefficients for Landsat MSS, TM, ETM+, and EO-1 ALI Sensors. Remote Sens. Environ., 113, 893–903.
Chavez, P.S., Jr. 1988. An improved dark-object subtraction technique for atmospheric scattering correction of multispectral data. Remote Sens. Environ., 24, 459–479.
Chavez, P.S., Jr. 1996. Image-Based Atmospheric Correction— Revisited and Improved. Photogramm. Eng. Remote Sens., 62, 1025–1036.
Didan, K., Huete, A. 2006. MODIS vegetation index product series- collection 5 change summary. TBRS Lab. Documents.
Dixon, R.K., Brown, S., Houghton, R.A., Solomon, A.M., Trexler, M.C., Wisniewski, J. 1994. Carbon pools and flux of global forest ecosystems, Science, 263, 185–19.
Haidar, R.F., Fagg, J.M.F., Pinto, J.R.R, Dia, R.R., Damasco, G., Silva, L.C.R., Fagg, C.W. 2013. Seasonal forests and ecotone areas in the state of Tocantins, Brazil: structure, classification and guidelines for conservation. Acta Amazonica, 43, 261–290.
Jensen, J.R. 2007. Remote Sensing of the Environment: An Earth Resource Perspective; Prentice Hall: Upper Saddle River, NJ, USA; p. 592.
Jiang, Z., Huete, A.R., Didan, K., Miura, T. 2008. development of a two-band enhanced vegetation index without a blue band. Remote Sens. Environ., 112, 3833–3845.
Gusso, A., Ducati, J.R. 2012. Algorithm for soybean classification using medium resolution satellite images. Remote Sens., 4, 3127–3142.
Gusso, A., Veronez, M.R., Robinson, F., Roani, V., Da Silva, R.C. 2014. Evaluating the thermal spatial distribution signature for environmental management and vegetation health monitoring. Int. J. Adv. Remote Sens. GIS, 3, 433–445.
Jensen, J.R. 2007. Remote Sensing of the Environment: an earth resource perspective; Prentice Hall: Upper Saddle River, NJ, USA, p. 592.
Huete, A., Didan, K., Miura, T., Rodriguez, E.P., Gao, X., Ferreira, L.G. 2002. Overview of the radiometric and biophysical performance of the MODIS vegetation indices. Remote. Sens. Environ., 83, 195–213.
Huete, A., Didan, K., Shimabukuro, Y.E., Ratana, P., Saleska, S.R., Hutyra, L.R., Yang, W., Nemani, R.R., Myneni, R. 2006. Amazon rainforests green-up with sunlight in dry season. Geophys. Res. Lett., 33, 1–4.
Köppen, W. 1948. Climatologia: Con un Estúdio de los Climas de la Tierra. Fondo de Cultura Econômica: Tlalpan, Mexico, p. 466. (In Spanish).
Korea Forest Research Institute (KFRI). 2010. Survey manual for biomass and soil carbon. KFRI, Seoul, Republic of Korea.
Korea Forest Research Institute (KFRI). 2011. The 5th national forest inventory report. KFRI, Seoul, Republic of Korea. Sampling plots Maximum EVI-2 (2007 to 2008)
Mean Min. SD
Point_ID09 0.345 0.288 0.045
Point_ID22 0.300 0.249 0.029
Korea Forest Service (KFS). 2012. Statistical yearbook of forestry. Daejeon, Korea.
Lee, J., Yoon, T.K., Han, S., Kim, S., Yi, M.J., Park, G.S., Kim, C., Son, Y.M., Kim, R., Son, Y. 2014. Estimating the carbon dynamics of South Korean forests from 1954 to 2012. Biogeosciences, 11, 4637–4650.
Markham, B.L., Barker, J.L., 1987. Thematic mapper band pass solar exoatmospherical irradiances. Int. J. Remote Sens., 8, 517–523.
National Aeronautical and Space Administration (NASA) - Landsat Science. Available online: http://landsat.gsfc.nasa.gov/ (accessed on 12 June 2011).
Pan, Y., Birdsey, R.A., Fang, J., Houghton, R., Kauppi, P.E., Kurz, W.A., Phillips, O.L., Shvidenko, A., Lewis, S.L., Canadell, J.G., Ciais, P., Jackson, R B., Pacala, S.W., McGuire, A.D., Piao, S., Rautiainen, A., Sitch, S., Hayes, D. 2011. A large and persistent carbon sink in the world’s forests. Science, 333, 988–993.
Schroeder, T.A., Cohen, W.B., Song, C., Canty, M.J., Yang, Z. 2006. Radiometric correction of multi-temporal landsat data for characterization of early successional forest patterns in western Oregon. Remote Sens. Environ., 103, 16–26.
Sobrino, J.A., Jiménez-Munõz, J.C., Paolini, L. 2004. Land surface temperature retrieval from LANDSAT TM 5. Remote Sens. Environ., 90, 434–440.