METHODOLOGY FOR LANDSLIDE MONITORING IN A ROAD CUT BY MEANS OF
TERRESTRIAL LASER-SCANNING TECHNIQUES
M.A. Hernándeza, J.L. Pérez-Garcíaa, T. Fernándeza, F.J. Cardenala, E. Mataa, A. Lópeza, J. Delgadoa, A. Mozasa
a
Dept. of Cartographic and Geodetic Engineering and Photogrammetry, Campus de las Lagunillas, Ed. Tecnología e
Ingeniería, University of Jaén, 23071 Jaén (acaro, jlperez, tfernan, jcardena, emata, alarenas, jdelgado,
antmozas)@ujaen.es
VIII/1: Disaster Management
KEY WORDS: displacements measurement, landslide, road cut, terrestrial laser-scanning.
ABSTRACT:
After the heavy rains of 2009/10 winter, a road cut in the national highway A-44 and the upper slope became unstable; the mass invaded the way and caused important traffic interruptions by several months. The landslide was measured by means of terrestrial laser-scanner techniques and, because of the zone morphology, the used methodology involved scanning the mobilized zone from different stations with several captures from each point. Two scanning campaigns were carried out in a time interval of 14 days. The antenna phase centers were determined by GPS techniques and incorporated to the point clouds as an additional point in the TLS reference system; next, the relative orientation of the different point clouds of each scan station is made, adjusting and merging them in a single point cloud; finally, we proceed to data transformation to a reference system global and common to both campaigns, in which surface and terrain models can be compared. From field data, a digital surface model have been built, and then filtered and edited to have digital elevation models of centimeter spatial resolution. The results obtained by the comparison of models show two rupture zones in the road cut affecting also to the upslope, in which an important volume material flowed with superficial displacements of about 0,55-0,65 m day-1. We also calculated 210 m3 of depleted material and 124,5 m3 of accumulated material; the differences between these volumes (wasting material) are explained because the civil works that were made to clear the road of materials.
1. INTRODUCTION
Landslides are one of the most widespread earth surface hazards, causing hundred of human victims and billions of dollars in damages per year. One of the goods more affected by slope movements are lineal works (highways and roads, railways, etc.) where processes such as falls of weathered block, slides or flow of materials on the road produces traffic and other problems in these infrastructures. These movements are sometimes unpredictable, although slope instability methods help us to resolve certain unstable areas. In this case the determination of the geometry of the unstable area is capital to resolve that problem, because of that it is necessary the improvement of geomatic tools to capture, define and analyze that geometry in an accurate way.
In the last years, different geomatic techniques from data acquisition (optical remote sensing, photogrammetry, radar, LiDAR, GPS, surveying ...) to data processing (especially GIS) are being used to landslide characterisation, monitoring and analysis. Among them, terrestrial laser scanner (TLS) is becoming one of the most used to deformation monitoring because it gives a high density and spatial accuracy data in a short time interval (Abellán et al, 2006; Abellán et al., 2009; Montserrat & Crosetto, 2008, Monserrat et al., 2008; Lichun et al., 2009). In this way, natural and man-made slopes can be captured with a high reliability and speed in comparison with other measurement techniques not based in images (conventional surveying and GPS).
However, there are some difficulties in TLS data processing related with the management of large amount of data, the geo-referencing and adjustment of TLS data and the requirement of data filtering and classifications. The management of TLS are carried out by means of several commercial applications of high
level to manage TLS data, but many times these software are not enough and a global automatic processing of these data are not yet possible.
However, the most important issue is the correct georeferencing of TLS data that must be carried out in a unique and stable reference system. Uncertainty in the system definition and in the adjustment and orientation of the different point clouds will make the results are not accurate and the useful. There are several methodologies available to georeferencing TLS point clouds used to terrain deformation monitoring; this approaches are different depending on TLS instrument, involved distances, number and distribution of measurement stations, terrain characteristics (morphology, stability, visibility, accessibility …) and the data processing software.
The reference system (global or local) can be defined in different ways. The first of them is the use of targets (circular planes, cylindrical and spherical) placed on stable or unstable zones of the studied terrain and measured by a GPS or total station (Miller, 2008, Cardenal et al., 2008; Bu & Zhang, 2008) to define an internal system. Other option, used in multi-temporal analysis, requires the inclusion of stable zones in the different campaigns to define the reference system common to all of them (Montserrat & Crosetto, 2008; Travelleti et al, 2008).
A third way is the data georeferencing using the position of the different scan stations; this position can be measured with accuracy by GPS. It will be necessary to measure at least three well distributed stations (not located in the same straight line) to transform the local reference system of the scanner to a common and global system. Pesci et al. (2007a y 2007b) employs this procedure to deformation monitoring in the Vesuvio volcano. In this case, the scanned terrain and scan stations not have to be in stable zones.
In this work we apply a methodology based on the last option to monitoring a mobilized mass affecting to a road cut and the upslope. The use of ETSR89 –the official reference system that are being adopted in Spain for the next years- as stable system for the two field campaigns allow carry out a multi-temporal study in a reliable way. This procedure, in which the position of measurement stations are obtained using GPS, is applied because of the unfavorable conditions of the study zone: the instability of the whole scanned terrain where not enough wide stable zones can be found, the poor or null accessibility making impossible the use of targets, a not very adequate geometry stations network located in the opposite slope, and a complex terrain with a lot of fallen blocks and vegetation.
The improvement of techniques to TLS data capture and processing is the goal of this work. In this paper, we describe a methodological approach for referencing terrestrial laser scanner data for multi-temporal studies in landslide monitoring. Currently, this methodology is being tested with additional works based on the integration of different techniques of data capture besides TLS: close range photogrammetry, aerial photogrammetry with current and historical images and airborne LiDAR.
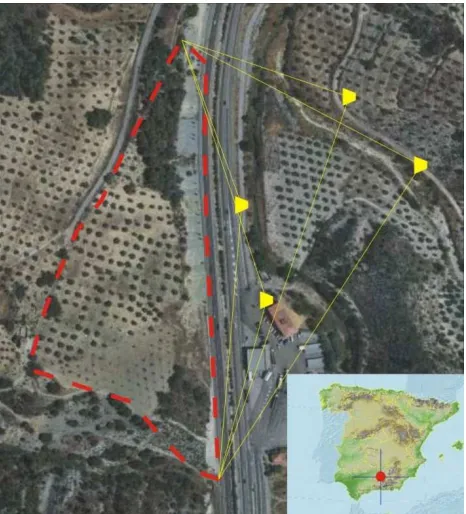
Figure 1. Orthophotograph of the study area in Jaén province (Southern Spain). The landslide zone is delimited by dotted red
line. Positions of scan stations are drawn in yellow.
2. STUDY AREA AND LANDSLIDE DESCRIPTION
The studied road cut are located at the South of Jaén province (Spain), around and along a section of A-44 national highway that connect Granada and Madrid, practically in the provincial boundary between Granada and Jaén (figure 1). In fact, landslide has been called “La Frontera” (the frontier) because it is located opposite to a petrol station near the mentioned boundary (figure 1).
As a consequence of a heavy rainfall in 2009/10 winter, in which accumulated precipitations between December and March reach more than 400 mm in the region (double of the
mean annual precipitation to these months) according Spanish Weathering Agency (AEM), a lot of terrain instability phenomena occurred, affecting to natural and man-made slopes in the study zone.
The landslide corresponds to a complex movement in which earth flow component predominates although with a certain slide in the upper part where an incipient scarp can be observed (small steps of sub-metric size and cracks opening). The flow of marly materials with a large amount of water can be observed in the front of mobilized mass (the road cut), but the typical morphology of a flow with a large tongue is not developed by the incipient character of the landslide and the very presence of the road cut that limits its evolution. The marly materials, present in the cut and the upslope, correspond to a geological formation in which marl and chalk terms of Lower Cretaceous age alternates, belonging to Middle Subbetic of External Zones of Betic Cordilleras. The steep reliefs at background in the figure 2 are chalk and dolomites of Jurassic Age, underlaying marls.
The landslide was active during rainy months, practically until summer when it was stabilized by the actuation of Civil Works Ministry of Spanish Government. The campaigns were carried out between 10 and 24 March 2010, a two weeks period, in the moment of higher activity of landslide.
Figure 2. Panoramic photograph of studied landslide affecting road cut and upslope. The main scarp is inside the red square.
3. TERRESTRIAL LASER SCANNER SURVEY
3.1 Data capture
To analyze the displacement of the unstable mass, two scanning campaigns were carried out by means of TLS in a time interval of 14 days. The used instrument is an Optech ILRIS 3D long range TLS (up to 1500 m).
As we mentioned before, the number and geometry of the scans carried out depends on the needs of covering the whole area and using at least 3 scan stations to correct data transference to the reference system. So, 9 scans in 3 stations in the first campaign and 13 scans in 4 stations in the second campaign have been carried out (figure 3). Meanwhile the location of the scan stations is related to the following factors: the correct geometry to further data transference to global system (points well distributed and not located in the same straight line), the reduction of shadow zones and the stations accessibility.
Besides, the presence of overlapped zones in the scans must be taken in account because the adjustment of the different point clouds is based on the use of surface matching. The point resolution in each capture was 5-6 cm at the average scanning distance, that allows obtain a point cloud of higher density once the points clouds are merged.
Figure 3. Position of the scan stations and final result of the point clouds merging in the two campaigns.
3.2 GPS measurements
To georeferencing the scan stations, a GPS receiver (Leica System 1200) is placed on the laser scanner instrument by ILRIS GPS mount kit set. We can relate both systems and the data captured by them because the distance between antenna phase centre and scanner origin is known (figure 4).
Figure 4. GPS receiver with the ILRIS GPS mount kit set placed on the scanner. Scanner reference system and offsets (dy, dz) between antenna phase center
and scanner origin are represented.
4. DATA PROCESSING
4.1 GPS data
GPS observations were processed using GeoOffice software (Leica Geosystems). Every antenna phase center is calculated in the ETRS89 reference system with a sub-metric accuracy.
4.2 Point clouds (TLS data)
First, the position of antenna phase center was incorporated to the point clouds as an additional point in the TLS reference system, taking in account the offset of this point to the TLS instrument origin (figure 4).
Next, the relative orientation of the different point clouds of each scan station is made, adjusting and merging them in a single point cloud using the module “matching surface features” of I-Site MAPTEK software. This orientation is based on the correlation of some common zones in the overlapped point clouds (figure 5). These common areas are recommendable to be cleared to avoid noise and outliers which can affect the matching.
In this way, we obtain for each campaign a single point cloud in a local reference system. The average density of these point clouds is about 1 point every 2 to 4 cm in zones without shadows, corresponding to 5.800.000 and 8.600.000 for the first and the second campaign, respectively.
4.3 Surface models and DEMs
After single point clouds corresponding to both campaigns are obtained, a surface model (DSM) can be obtained where we take in account both the points assigned to terrain surface (terrain points) and the points not assigned to the terrain surface (non-terrain points). These last points correspond to vegetation, fences, constructions, vehicles and other features located over the terrain surface or noise points introduced by in motion vehicles, birds, rainfall drops or other issues (figure 6).
Then we proceed to point classification or filtering in two classes, terrain and non-terrain points (Lichun, et al., 2009). From the classified point clouds in which only terrain points are present and non-terrain points are deleted, a TIN model of terrain surface or DEM is obtained.
Figure 5. Relative orientation of single points cloud using common or overlapped zones.
Figure 6. Classification: non terrain points (vegetation and other features) in green, over terrain surface in brown.
5. FINAL POINT CLOUD GEOREFERENCING
After the data capture, orientation, merging and classification of the two point clouds, we proceed to data transformation to a reference system global and common to both campaigns, in which surface and terrain models can be compared to study the landslide process.
Using as common points in both reference systems (local system used in scanning process and global ERTS89 system) the positions of GPS antenna phase center incorporated to point clouds, a rigid 3D transformation of six parameters is applied to the integration of point clouds corresponding to both campaigns in a common reference system in which they can be compared.
However, some cautions have to be taken in account because of these points are affected by the errors in the orientation process of single scans carried out by means of surface matching, and the further propagation of those errors.
To solve these problems a weighting of these points taking in account its quality is carried out to calculation of transformation parameters. In this way, the 3D transformation was made in two steps: first, we made a transformation in which every point has the same weight; after that initial adjustment, we recalculate the transformation taking in account the first results (the better adjustment of one point in the first transformation, the higher assigned weight in the second transformation). These deviations obtained for the initial transformation used in the second are shown in table 1; in this way, we obtain more reliable parameters than in a non-weighted transformation.
Finally, this type transformation is applied to point clouds corresponding to bothcampaigns, so all data (point clouds and surfaces obtained from them) are now in the same reference system (ERTS) that will be also used to data integration of further works.
The errors found in deviations (table 1) are very similar to the trend of those obtained for every scan in the phase of relative orientation by means surface matching. This similar trend indicates that the correlation errors could be used to weight the corresponding points in the 3D transformation. However, these correlation errors between different scans can be affected by several factors (presence of vegetation, size and points density of overlapped areas between the scans to be correlated, terrain surface morphology, scan station position, etc.), so errors could not be homogeneous. In this way, a weighted transformation
based on the deviations obtained as we explain before can give more reliable results.
Scan-stations Vx Vy Vz
11 -0.0084 0.0183 -0.0365 12 -0.0075 -0.0093 -0.0569 13 -0.0042 -0.0309 -0.0022 14 -0.0248 -0.0600 -0.0013
21 0.0383 0.0284 0.0857
31 0.0298 0.0449 -0.0732 32 0.0330 0.0426 -0.0428 41 -0.0236 0.0368 0.0295 42 -0.0222 0.0095 0.0184 43 -0.0016 0.0109 0.0308 44 -0.0001 -0.0205 0.0288 45 -0.0085 -0.0375 0.0034 46 -0.0004 -0.0333 0.0163 11 -0.0084 0.0183 -0.0365 12 -0.0075 -0.0093 -0.0569
Table 1. Obtained deviations in the initial transformation of the scanning points corresponding to the second campaign.
6. FIRST RESULTS AND DISCUSSION
Once data are in a stable and common reference system we can made the comparative analysis working with point clouds or with derivate surfaces.
In this way, we first observe two rupture zones in the road cut affecting also to the upslope (figure 7); they were generated as a consequence of the instability processes affecting to the region after the heavy rainfall in 2009/10 winter. This unstable zone mobilized an important volume of flowing material that invaded one of the carriages of the A-4 national highway and produced some traffic interruptions and other problems. Besides, the landslide evolved between the two considered campaigns; it can be clearly observed in a quickly view of both surfaces, with important superficial displacements and formation of steps, scarps and cracks.
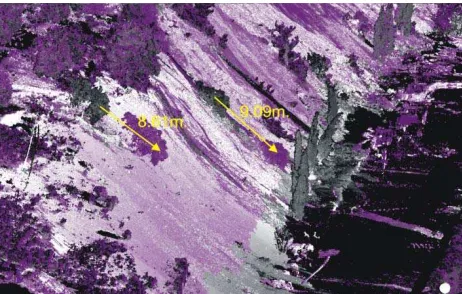
From digital surface model (DSM), some superficial movements of terrain and vegetation are roughly measured by means of the tools of I-Site software, obtaining maximum displacements of about 8-9 m between both campaigns that produces a daily rate of about 0,55-0,65 m day-1.
Figure 7. Observed displacements of the terrain and vegetation and terrain in unstable zones of the studied road cut.
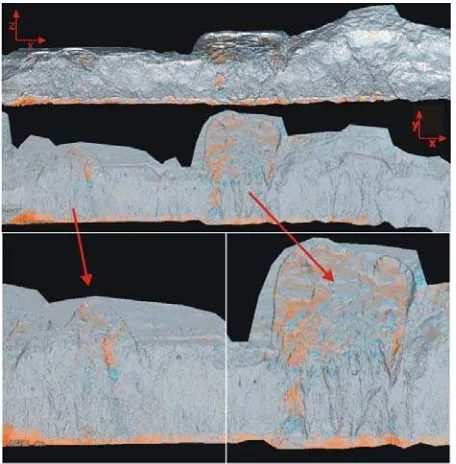
On the other side, displaced volumes have been calculated by means of the software tools applied in this case to DEMs. In the figure 8, depletion and accumulation zones are shown. Depletion zones are those in which the surface corresponding to the second campaign is under the surface corresponding to the first campaign and accumulation zones are those in which the second surface are over the first surface. The obtained numeric results to the zone B are shown in table 2.
Mobilized
material Depletion Accumulation Wasting Volume (m3) 210,02 124,50 85,52
Rates (m3 day-1) 15,00 8,89 6,10
Table 2. Volume calculations of mobilized material to zone B.
These calculations gives first results of 210 m3 of depleted material) and 124,5 m3 of accumulated material. The differences between these volumes (wasting material) are explained because of the material removed by civil works as well that occupying the highway as that resulting of the advance of the road cut to the road. This material was removed due to the actuation carried out by the State Public Administration with the objective of stopping the landslide affecting the highway. The works started after the first campaign, which explains the large amount of wasting material between both campaigns; they consisted in removing material in the slope toe and put a contention wall to stabilize the mobilized mass.
Figure 8. DEM surface corresponding to the second campaign: in orange, those zones in which this surface are under the first campaign surface (depletion); in blue, those zones in which this surface is over the first surface (accumulation). Top: front view; center: plan view; bottom: unstable zones details (zone A at the
left and zone B at the right)
7. CONCLUSIONS AND FURTHER WORKS
Terrestrial laser scanning techniques are proved again as a very useful tool to study landslide and its temporal evolution. In this sense they are becoming one of the most used tools to deformation monitoring because it gives a high density and spatial accuracy data in a short time interval.
In this work we present a methodology to georeferencing TLS data to multi-temporal studies about landslides monitoring, applied in this case to an unstable mass in a road cut that flows over a national highway, causing important traffic problems. In these studies, it is very important to establish a stable reference framework or system to monitoring terrain deformations and to measure displacements. However, the poor accessibility of the zone makes difficult to include targets in the study area and the general instability does not allow identifying stable areas. So, ETRS89 was used as the reference framework and TLS data are georeferenced by means the measurement of scan stations coordinates by means GPS observations. After that, a weighted rigid 3D transformation has been applied to transform the point clouds from a local reference system to the ETRS89 system.
This methodology has allowed monitoring the landslide occurred in the studied area in 2009/10 winter as a consequence of heavy rainfalls that became twice the mean precipitations in this period. The landslide was measured by means TLS instrument in a period of 14 days in which important modifications in the terrain surface could be observed. All the field works to data capture have been carried out in a short period of time (a few hours).
The obtained results are maximum superficial displacements of about 8-9 m in the terrain and vegetation between the two campaigns that produces a daily rate of about 0,55-0,65 m day-1. Regarding mobilized volumes, we estimate about 210 m3 of depleted material and 124,5 m3 of accumulated material; the differences between these volumes (wasting material) are explained because of the material removed by civil works to recovery the traffic of the highway.
The stable and global reference system established in this work can be used to multitemporal analysis to data captured until this moment and those that can be captured in further works. Further works will be on the refinement of this methodology and integration with other techniques such as close range photogrammetry, aerial photogrammetry and airborne LiDAR to multi-temporal and multi-scalar analysis, developed in the research project that will be mentioned above.
8. REFERENCES
Abellán, A., Vilaplana, J.M. and Martínez, J., 2006. Application of a long-range Terrestrial Laser Scanner to a detailed rockfall study at Vall de Núria (Eastern Pyrenees, Spain). Engineering Geology, Elsevier, 88:136–148.
Abellán, A., Jaboyedoff, M., Oppikofer, T. and Vilaplana, J.M., 2009. Detection of millimetric deformation using a terrestrial laser scanner: experiment and application to a rockfall event. Nat. Hazards Earth Syst. Sci., 9: 365–372.
Bu, L. and Zhang, Z., 2008. Application of Point Clouds from Terrestrial 3D Laser Scanner for Deformation Measurements. The International Archives Of The Photogrammetry, Remote Sensing And Spatial Information Sciences. Vol. XXXVII. Part B5. Beijing 2008, 545-548.
Cardenal, J., Delgado, J., Mata, E; González-Díez, A., Remondo, J., Díaz de Terán, J.R., Francés, E., Salas, L., Bonachea, J., Olague, I., Felicisimo, A., Chung Ch.J., Fabbri, A. and Soares, A., 2006. The use of digital photogrammetry techniques in landslide instability. In Geodetic Deformation Monitoring: From Geophysical to Geodetic Roles, (Gil Cruz and Sanso, Eds.). IAG Springer Series, 259-264.
Cardenal, F.J., Mata, E., Perez-Garcia, J.L., Delgado, J., Hernandez, M.A., Gonzalez, A., Diaz de Teran, J.R., 2008. Close range digital photogrammetry techniques applied to landslides monitoring. The International Archives Of The Photogrammetry, Remote Sensing And Spatial Information Sciences. Vol. XXXVII, Part B8, 235-240.
Cardenal, F.J. Perez-Garcia, J.L., Mata, E., Hernández, M.A., Lopez-Arena, A., Delgado, J., Gonzalez, A., Díaz de Terán, J.R., Fernández, G., Douthy, M., 2009. Integration of terrestrial laser scanner and close range digital photogrammetric techniques for rock avalanches monitoring. 7th Int. Conference on Geomorphology, Melbourne, Australia.
Gonzalez-Diez, A., Fernandez, G., Diaz de Teran, J.R., Doughty, M., Otero, C., Cardenal, F.J., Mata, E., Perez-Garcia, J.L. & Delgado, J., 2009. A methodological approach for the analysis of the landslide changes using LIDAR and ADP. 7th Int. Conference on Geomorphology, Melbourne, Australia.
Lichun, S., Li, J., Wang, X. and Zhao, D. 2009. Monitoring landslides dynamics using multitemporal terrestrial laser scanning data. Second International Conference on Earth Observation for Global Changes, X. Zhang, J. Li, G. Liu, X. Yang (eds.). Proc. of SPIE, 7471, 74711M.
Miller, P.E., 2008. A robust surface macthing technique for dem integration in the context of coastal geohazard monitoring. The International Archives Of The Photogrammetry, Remote Sensing And Spatial Information Sciences. Vol. XXXVII. Part B3A. Beijing 2008, 147-154.
Monserrat, A. & Crosetto, M., 2008. Deformation Measurement Using Terrestrial Laser Scanning Data And Least Squares 3D Surface Matching. ISPRS Journal of Photogrammetry & Remote Sensing, 63: 142–154.
Monserrat, A., Crosetto, M. and Pucci, B. 2008. Use of a point cloud co-registration algorithm for deformation measuring. 13th FIG Symposium on Deformation Measurement and Analysis, Lisbon.
Pesci, A., Fabris, M., Conforti, D., Loddo, F., Baldi, P. & Anzidei, M., 2007a. Integration of ground-based laser scanner and aerial digital photogrammetry for topographic modelling of Vesuvio Volcano. Journal of Volcanology and Geothermal Research, 162: 123–138.
Pesci, A., Loddo, F. and Conforti, D., 2007b. The First Terrestrial Laser Scanner Application over Vesuvius: High Resolution Model of a Volcano Crater. International Journal of Remote Sensing, 28, 1: 203–219.
Travelletti, J., Oppikofer, T., Delacourt, C., Malet, J.P. and Jaboyedoff, M., 2008. Monitoring landslide displacements during a controlled rain experiment using a long-range terrestrial laser scanning (TLS). The International Archives Of The Photogrammetry, Remote Sensing And Spatial Information Sciences. Vol. XXXVII. Part B5. Beijing 2008, 485-490.
9. ACKNOWLEDGEMENTS
This paper is supported by ISTEGEO project RNM-06862 and Research Group TEP-213, both from the Andalusia Research Plan (PAI) and the IFOTEL project TIN2009-09939 from the Ministry of Science and Innovation, National Programme R+D+I and European Regional Development Funds (ERDF).