MONITORING OF STRUCTURAL COMPONENTS AND WATER BALANCE AS AN AID
TO WETLAND MANAGEMENT USING GEOSPATIAL TECHNIQUES – A CASE
STUDY FOR NALSAROVAR LAKE, GUJARAT
T.V.R. Murthy* and Sushma Panigrahy
EHD/ABGH/EPSA, Space Applications Centre, ISRO, Ahmedabad – 380015 *Email: [email protected]
KEY WORDS: Nalsarovar Lake, MODIS, Water balance, SRTM-DEM, Avi-fauna
ABSTRACT:
The hydrologic variability greatly influences the structural components of wetlands that have a great bearing on habitats for avifauna, aquatic fauna including fish etc. This paper highlights the results of a study carried out to derive changes in open-water and vegetation, and also water balance for Nalsarovar Lake, Gujarat. MODIS 8-day composite data for three consecutive years viz 2002/03, 2003/04 and 2004/05 were used to study the seasonal and inter annual dynamics of water regime in the lake. Digital elevation model derived using Shuttle Radar Topographic Mission data with interpolated bottom topography was used to generate elevation contours and compute water volume from water spread data. The reference data of 2002 (drought year) shows the maximum extent of wetland to be 8.06 km2 with emergent vegetation of recorded as 2.36 km2 and open-water as 5.70 km2. The
rainfall has an impact on the preferred habitat availability for various species of avifauna and it is noted that emergent vegetation present in the lake completely dried up by summer 2002, a rainfall deficit year but revived again in the preceding year i.e. 2003 which was a good rainfall year with 46.68 km2 under emergent vegetation and 61.96 km2 under open-water. The 2002 being a drought year has shown very low reference storage (0.256 MCM), which has shown a gradual decrease in the storage to 0.00019 MCM in March 2003. The reference storage also registered a steep increase to 18.165 MCM in October 2003 and decreased 1.264 MCM in March 2004. From this study it is evident that water level of about 9 m elevation at the end of the rainy season is found to be optimal for maintaining various habitats that in turn support the avifauna for the rest of the lean period.
1. INTRODUCTION
Wetlands are among the most productive ecosystems of the world. The interactions of physical, chemical and biological components of wetlands enable them perform multiple functions like water storage, storm protection and flood mitigation (Mitsch and Gosselink, 2000). The wetlands like natural lakes, swamps, waterlogged area play very crucial role in avifauna life cycle. Thus, wetland management though requires many parameters, hydrology is the key factor. Remote sensing data has been widely used for mapping and monitoring of various structural components of wetland like water spread, aquatic vegetation, water quality etc (Prigent et al, 2001, Ndirima, 2007). Modelling of hydrological fluctuations, water balance of wetlands like lakes, eservoirs is also being attempted with advances in satellite remote sensing. This paper highlights the use of multi temporal remote sensing data and satellite derived digital elevation model to study the surface hydrological condition and its influence on various habitat types of avifauna in an important inland lake, which is a notified bird sanctuary in India.
2. STUDY AREA
Nalsarovar situated between 22040’00”–22052’00”N latitudes
and 71055’00”–72006’00” E longitudes located amidst the semi-arid lands of Ahmedabad and Surendranagar districts of Gujarat, India is the study site (Fig.1). It falls in the 4B Gujarat-Rajwara biotic province of the semi arid bio-geographical zone. Nalsarovar notified as a sanctuary under Wildlife (Protection) Act, 1972; is the largest wetland bird sanctuary in Gujarat. The avi-fauna habitat formation is highly
dynamic due to changes in the water level and based on this water level and vegetation, eight habitat types have been identified (Anon., 1998, Tatu, 1995), the important ones being i) Deep open-water, ii) Shallow open-water, iii) Emergent-aquatic vegetation and iv. Mud habitat.
3. DATA USED
The remote sensing data comprised cloud-free IRS LISS-III data closest to the last rainfall event of the season for 2002, 2003 and 2004 were used as reference. The eight-day composite reflectance data of MODIS Aqua pertaining to green, red, NIR, SWIR bands (500 m) from October 31 to March 30 for 2002-03, 2003-04 and 2004-05 were used to monitor the temporal changes in the wetland structural components. Actual Evapotranspiration (AET) products based on MODIS data of same period were also used.
Figure 1: Location of Nalsarovar Lake (Gujarat, India)
4. METHODOLOGY
4.1 Derivation of Wetland Structural Components
Pre-processing of remote sensing data was done following standard techniques of geometric correction, reprojection to a standard coordinate system (Anon., 2005), multi-date data registration, conversion of digital number to radiance. This was followed by generation of various indices images such as Normalised Difference Water Index (McFeeters, 1996), Modified Normalised Difference Water Index (Hanque, 2002), Normalised Difference Pond Index (Lacaux et al, 2007) and Normalised Difference Vegetation Index (Tucker and Sellers, 1986; Townshend and Justice, 1986). These indices were then used to map the open-water spread, aquatic vegetation, terrestrial vegetation, muddy area etc as demonstrated by Murthy et al, 2009. The work was carried out using ERDAS 9.2 image processing software.
4.2 Water Volume and Balance Estimation
For the computation of volume of the water in the lake, one re-quires the aerial extent and depth. Depth was derived in an indi-rect way using SRTM-DEM. First the Digital elevation of the land area surrounding the lake using SRTM-DEM was cali-brated using linear regression between corresponding values of elevation for the common points in the SRTM-DEM and ground data (collected from various survey maps). Since, a very good linear relationship (R2 =0.901) was obtained the SRTM data was used for the generation of elevation contours of the area.
Since, the SRTM-DEM does not give the elevation of water surface (shows no-data), the temporal change in the water spread boundary as derived from satellite data was used as ele-vation contour line, based on the assumption that the surface of water reaches the same height everywhere within the lake. GPS based point measurements for depth of the water were collected (during November 2005 to October 06, regularly for each month corresponding to water spread boundary) and used for the surface interpolation of bottom topography.
To account for the loss of water while computing the change in storage for water balance, actual evapotranspiration (AET) was computed using MODIS (Aqua) noontime optical and thermal data (Bhattacharya et al, 2007).
Change in storage is calculated as:
S1 = Sr – (ET + Other loses) for Date1
S2 = S1 – (ET1 + Other loses1) for Date2…Daten
Where,
S1 = Change in storage for date 1
Sr = Reference Storage
S2 = Change in storage for date 2
ET1 = Evapotranspiration for date 1
The volume of the water is computed for each dataset using the elevation information. Water balance (∆S) is computed by subtracting the volume of S1 from the reference volume (Sr) and
also accounting loses due to actual evapotranspiration (AET). As other loses like use of water for irrigation, surface/subsurface flow were not physically measured in this study, the difference barring the AET is considered as other loses.
5. RESULTS AND DISCUSSION
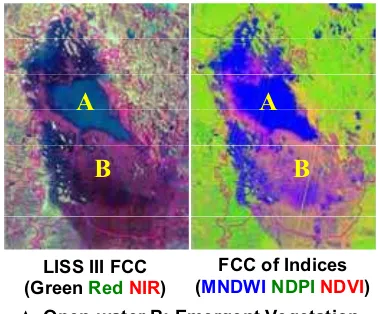
The wetland boundary, open-water spread and aquatic vegetation (emergent) could be delineated using combinations of indices images (Fig. 2).
Figure 2: IRS LISS III FCC of the Nalsarovar Lake area along with FCC of indices highlighting accurate detection of open-water and emergent vegetation areas
Nalsarovar Lake being fed through surface runoff exhibit wide fluctuations in the water spread and consequently vegetation
A: Open-water B: Emergent Vegetation LISS III FCC
(Green RedNIR)
FCC of Indices (MNDWINDPINDVI)
A
A
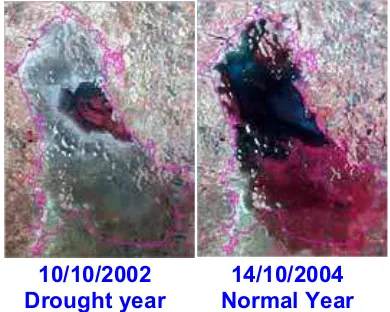
spread, both seasonally and annually. Annual fluctuations are due to the change in rainfall quantity received during monsoon. Figure-3 shows the LISS III FCC corresponding to post-monsoon season (October) of the lake during a drought year (2002), and a normal monsoon year (2004). One can observe the complete drying of emergent vegetation in the drought year and revival of the same in the next year- a normal monsoon year. Similar observations have been made in other studies (Anon, 1998).
Figure 3: IRS LISS III FCC of Nalsarovar Lake area showing status of open-water and emergent vegetation areas during post-monsoon month of October in a drought year (2002) and a normal year (2003)
It can be inferred that the flooding/inundation gradient influences the vegetation composition, distribution and growth
patterns, as well as the extent of suitable foraging habitats for avifauna. Further, hydrology influences the physico-chemical and biological properties of the lake as well as macrophytes along with the fish and other animals that could be a source of food to certain avifauna. Hence, modelling the water balance is the best aid in the management of this rain fed natural Lake. 5.1 Inter- annual Changes
The water balance derived in this study for three years using LISS III data (2002, 2003 and 2004) of post-monsoon month (October) showed significant change from normal year to a monsoon deficit year. The year 2002 was a drought year with 240.70 mm of season’s total rainfall. The extent of open-water and emergent vegetation in the lake during 2002 October was found to be 5.70 km2 and 2.26 km2 respectively (Table 1). The years 2003 and 2004 were normal-to-good rainfall years with 780 mm and 832 mm rain fall respectively. The extent of open-water and emergent vegetation in the lake during 2003 and 2004 October was 61.96 km2 and 66.04 km2 respectively, while the emergent vegetation was 46.68 km2 and 49.76 km2
respectively. Thus, one can observe that the extents of open-water and emergent vegetation have been drastically reduced during a drought year compared to a normal/good monsoon year.
5.2 Seasonal Changes
Lakes also are known to show seasonal dynamics. Since, this lake is a natural rain-fed lake; its water storage is in its peak during monsoon period (June-September).
MODIS Data
Area (km2) 2002-03 Area (km2) 2003-04 Area(km2) 2004-05 Wetland Emergent
Vegetation
Open
Water Wetland
Emergent Vegetation
Open
Water Wetland
Emergent Vegetation
Open Water
31-Oct. 7.40 2.26 5.14 108.43 48.14 60.30 115.59 51.31 64.27
08-Nov. 7.18 2.15 5.03 107.74 48.16 59.58 114.85 51.33 63.52
16-Nov. 6.82 1.91 4.91 107.45 48.57 58.88 114.54 51.78 62.76
22-Nov. 6.36 1.67 4.69 107.14 49.23 57.91 114.21 52.48 61.73
02-Dec. 6.09 1.63 4.46 107.11 49.26 57.85 114.18 52.51 61.67
10-Dec. 5.85 1.62 4.23 106.81 50.93 55.87 113.85 54.29 59.56
18-Dec. 5.51 1.51 4.00 105.42 51.00 54.43 112.38 54.36 58.02
26-Dec. 4.83 1.39 3.44 104.91 50.93 53.97 111.83 54.30 57.53
01-Jan. 4.55 1.39 3.15 104.63 50.69 53.95 111.53 54.03 57.50
09-Jan. 4.06 1.16 2.90 104.23 50.63 53.60 111.11 53.97 57.14
17-Jan. 3.71 1.04 2.67 103.15 49.91 53.24 109.95 53.20 56.75
25-Jan. 3.25 0.93 2.33 102.27 49.36 52.91 109.01 52.61 56.40
02-Feb. 2.89 0.80 2.09 99.86 48.04 51.83 106.45 51.21 55.25
10-Feb. 2.67 0.69 1.98 98.37 47.54 50.83 104.86 50.67 54.18
18-Feb. 2.22 0.47 1.75 95.23 45.53 49.70 101.52 48.54 52.98
26-Feb. 1.74 0.24 1.51 91.80 43.98 47.82 97.86 46.88 50.98
06-Mar. 1.36 0.23 1.14 89.06 43.83 45.22 95.93 46.73 49.21
14-Mar. 1.23 0.22 1.02 86.87 41.87 45.00 93.50 44.63 48.87
22-Mar. 0.89 0.21 0.67 85.16 40.52 44.64 91.33 43.19 48.14
30-Mar. 0.82 0.21 0.60 83.76 40.05 43.71 89.45 42.69 46.75
Table-1. Seasonal changes in the extent of open-water and emergent vegetation (from October to March) derived from MODIS 8 day composite data for 3-years.
Thus September-October in general is the peak water storage period. There after, it starts declining, and the lowest storage period is attained during May-June. High temporal 8 day composite MODIS data is thus very suitable to study the
seasonal dynamics of this lake. Results showed significant seasonal fluctuation in the extent wetland extent, open-water and emergent vegetation in the lake. The total wetland area shows a gradual decrease from October to March in all the
14/10/2004
Normal Year
10/10/2002
years (normal as well as rainfall deficit year) as shown in Table-1. Similar trend was observed with extent of open-water. However, in case of emergent vegetation, in normal years (2003, 2004) one observes a gradual increase from October early January and decrease there after. This was mainly due to the fact that the vegetation growth takes place in areas with receded water, and as the saturated areas start drying up after January with increase in temperature, the vegetation declines and reaches its minima by March end. However, in rainfall deficit year (2002), one observes gradual decrease of vegetation also.
5.3 Water balance
Relation between the elevation and water spread area of the lake was found to be best explained by the logarithmic fit with R2 =0.9489. The volume of water thus computed was converted
to storage accounting for the AET and other losses. Results showed gradual decrease of water storage from October to March during all the years. However, the peak storage of the lake registered very significant reduction in the drought year. During 2002-03, which is one of the worst monsoon years, the storage during October (2002) was 0.256 million cubic meters (MCM) got reduced to 0.00019 MCM (Table 2) by March
(2003).During 2003-04, the storage in October was 18.165 MCM and reduced to 10.724 MCM by March. During 2004-05, which received maximum rainfall, the storage in October was 20.936 MCM that was reduced to 1.997 MCM by March. Thus, one can infer that drastic seasonal reduction of water storage in the lake from post-monsoon to summer, strongly characterising the rain-fed water balance of this shallow lake. Since, the amount as well as depth gradient of water available in the lake is decisive in the modelling of optimal habitats of species of avifauna. Simulation of water spread using elevation contour of the lake was carried out. The results showed that beyond 10.5 m elevation, the lake water overflows into the Bhogava River through surface drainage present in the southern part of lake. Thus, water storage at about 9 m elevation at the end of the rainy season is optimal to sustain various habitats that support the avifauna for the rest of the season. If a canal is envisaged to join Nalsarovar Lake with the Sardar Sarovar Project Canal passing through the catchment is expected to bring certain positive impacts on the wetland i) Reduction in the salinity of lake water, ii) part of the lake would become perennial and iii) Increase in submergence area leading to conducive for prolonged development of habitats for certain species of waterfowl.
MODIS 8-day Composite
2002-03 (Drought year) 2003-04 (Normal year) 2004-05 (Normal year) AET
(MCM)
OL (MCM)
C S T (MCM)
AET (MCM)
OL (MCM)
C S T (MCM)
AET (MCM)
OL (MCM)
C S T (MCM) 1, 2, 3 0.256 18.165 20.936 31-Oct 0.04 0.19 0.215 1.64 16.37 18.009 2.32 18.44 20.761 08-Nov 0.04 0.18 0.202 1.58 15.91 17.488 1.86 18.32 20.174
16-Nov 0.04 0.16 0.182 1.67 15.60 17.271 1.67 18.26 19.931 22-Nov 0.04 0.13 0.158 1.51 15.53 17.037 1.77 17.90 19.667 02-Dec 0.04 0.12 0.145 1.31 15.71 17.018 1.78 17.87 19.645
10-Dec 0.02 0.12 0.134 1.69 15.10 16.789 1.84 17.54 19.388 18-Dec 0.02 0.10 0.118 1.52 14.25 15.767 1.99 16.25 18.237 26-Dec 0.03 0.07 0.091 1.77 13.62 15.388 2.10 15.72 17.811 01-Jan 0.03 0.06 0.080 1.62 13.57 15.185 2.59 14.99 17.583 09-Jan 0.02 0.05 0.063 1.43 13.46 14.894 2.85 14.40 17.254
17-Jan 0.01 0.04 0.052 1.53 12.57 14.106 2.52 13.85 16.367 25-Jan 0.02 0.03 0.040 1.59 11.89 13.473 2.65 13.01 15.654 02-Feb 0.02 0.02 0.031 1.83 9.93 11.769 2.07 11.66 13.735 10-Feb 0.02 0.01 0.026 1.85 8.87 10.724 2.41 10.15 12.559
18-Feb 0.02 0.00 0.017 1.81 6.78 8.584 2.65 7.49 10.147 26-Feb 0.02 0.00 0.010 1.60 4.71 6.308 2.95 4.63 7.582 06-Mar 0.01 0.00 0.005 1.94 2.60 4.541 2.18 4.09 6.265
14-Mar 0.01 0.00 0.004 1.44 1.73 3.165 2.12 2.51 4.634 22-Mar 0.00 0.00 0.00066 1.70 0.41 2.110 2.02 1.19 3.212 30-Mar 0.00 0.00 0.00019 0.89 0.37 1.264 1.71 0.28 1.997
Table-2 Change in storage, actual evapotranspiration and other loses in the Nalsarovar Lake
6 CONCLUSIONS
Following conclusions are drawn from the present study. • The present study shows that various indices derived using
multi spectral data can be used to map lake structural components like open-water, emergent vegetation with good accuracy.
• This paper highlights a methodology to derive depth con-tours of the lake using limited GPS based observation based on water spread extent observed in remote sensing data.
• SRTM DEM calibrated with known elevation points was useful in assessing the optimum storage requirement of the lake for avifauna habitat.
• High temporal MODIS data is useful in monitoring two important structural components viz open-water and emer-gent vegetation, which show a strong relationship to avi-fauna habitat of the Nalsarovar lake.
• The lake registered a significant change in the extent of open-water and emergent vegetation due to seasonal change within a year.
• Water extent at about 9 m elevation at the end of the rainy season is found to be optimal for maintaining various habi-tats that in turn support the avifauna for the rest of the lean period.
REFERENCES
Anon. (1998). Environmental impact assessment of Sardar Sarovar project on Nalsarovar Bird Sanctuary. EIA/9/98. A Technical Report: Gujarat Ecological Education and Research (GEER) Foundation, Gandhinagar, India
Anon. (2005). NNRMS Standards, A National standard for EO images, thematic and cartographic maps, GIS databases and spatial outputs.ISRO: TR: 112:2005. A committee Report: National Natural Resources Management System, Bangalore, India.
Bhattacharya, B.K., Vyas, S. P., Dutta, S., Patel, N.K., Parihar, J.S. and Mallick, K. 2007. Regional evapotranspiration estimation and wheat yield Prediction using Satellite data. EOAM/SAC/GEWBS/SN/08/2007. A Scientific Report: Space Applications Centre, Ahmedabad, India.
Hanqiu, Xu, 2002. Spatial expansion of urban/town in Fuqing of China and its driving force analysis. Remote Sensing Technology and Application, 17, pp. 86-92.
Lacaux, J.P., Tourre, Y.M., Vignolles, C., Ndione, J.A. and Lafaye, M. (2007). Classification of ponds from high-spatial resolution remote sensing: Application to Rift valley fever epidemics in Senegal. Remote Sensing of Environment, 106, pp. 66-74.
McFeeters, S.K. (1996). The use of Normalised Difference Water Index (NDWI) in the delineation of open-water features. International Journal of Remote Sensing, 17, pp. 1425-1432. Mitsch, W.J. and Gosselink, J.G. (2000). Wetlands. (New York: John Wiley & Sons), P. 920.
Murthy, T.V.R., Patel, J.G., Singh, T.S., Suthar, N.M. and Sushma Panigrahy (2009). Application of RS data based Spectral Indices for Wetland Inventory and Assessment. Proc. National Symposium on “Advances in Geo-spatial Technologies with Special Emphasis on Sustainable Rainfed Agriculture” and Annual Convention of Indian Society of Remote Sensing (ISRS). September 17-19, 2009. Nagpur, India Ndirima, Z.K. (2007). Mapping and monitoring wetland vegetation used by Wattled Cranes using remote sensing: Case study of Kafue Flats, Zambia. M.Sc. Thesis, ITC, The Netherlands
Prigent, C., Matthews, E., Aires, F. and Rossow, W.B. (2001). Remote sensing of global wetland dynamics with multiple satellite datasets, Geophysical Research Letters, 28, pp. 4631-4634.
Tatu, K. 1995. Ecological study of Nalsarovar (Gujarat) with an emphasis on its floristic & avifaunal profile using satellite remote sensing technique, Ph.D.Thesis, Gujarat University, Ahmedabad, India.
Townshend, J.R. and Justice, C.O. (1986). Analysis of dynamics of African vegetation using the Normalised Difference Vegetation Index. International Journal of Remote Sensing, 7, pp. 1435-1445.
Tucker, C.J. and Sellers, P.J. 1986. Satellite remote sensing of primary productivity. International Journal of Remote Sensing, 7, pp. 1395-1416.
ACKNOWLEDGEMENTS