MONITORING OF GLACIAL CHANGE IN THE HEAD OF THE YANGTZE RIVER
FROM 1997 TO 2007 USING INSAR TECHNIQUE
Hong’an Wu a, *, Yonghong Zhang a, Jixian Zhang a, Zhong Lu b, Weifan Zhong a a Chinese Academy of Surveying and Mapping, Beijing 100830, China –
(wuha, yhzhang, zhangjx)@casm.ac.cn, [email protected]
b U. S. Geological Survey Center for EROS, Sioux Falls, SD 57198, USA - [email protected]
Commission VII, WG VII/6
KEY WORDS: SAR interferometry, Glacier monitoring, Phase texture analysis, Gray level co-occurrence matrix (GLCM)
ABSTRACT:
Accurate monitoring of the glacier changes is essential to evaluate the environmental-ecological health in the scenario of global change. Conventional method for glacial monitoring is optical remote sensing. However, affected by cloud and snow cover, it is hard to monitor glacier by optical images. With the fast development of InSAR technique, interferometric coherence has been utilized for extracting glacial information. However, it is difficult to distinguish glacial area from non-glacial area when their coherence is similar, especially for short wavelength radar, such as X-band and C-band. In this case, interferometric phase can play an important role to identify glacier. In this paper, phase texture analysis method is proposed to extract glacier. 8 texture features were analyzed based on gray level co-occurrence matrix (GLCM), including mean, variance, homogeneity, contrast, dissimilarity, entropy, second moment, and correlation. Among them, variance, contrast and dissimilarity can distinguish glacier from non-glacier clearly most, so they are chosen for RGB combination. Then the RGB combination image is classified into several land covers by maximum likelihood classification (MLC). After post-classification processing, glacial area can be extracted accurately. With this proposed method, two ERS-2 SAR single look complex (SLC) images acquired in 1997 and two ENVISAT ASAR SLC images acquired in 2007 are used to extract glacial area in 1997 and 2007 over Geladandong area, the head of the Yangtze River. The extracted areas are validated by Landsat TM data, which indicate that the proposed method can obtain accurate glacial area. The results also demonstrate during the 10 years, glacial area over Geladandong decreased fast, with a reduction of 22.97km2.
* Corresponding author.
1. INTRODUCTION
Glacier change especially mountain glacier change is one of the best natural indicators to global climate change (IPCC, 2001). It not only plays an important role in climatology, but also has a potential influence in economy around the world (Lu, 2002). However, since 1950s, mountain glaciers have recessed fast as the global warming, which is obvious in the Tibet Plateau (Li, 1998; Su, 1999; Wang, 2001). As the solid reservoir, glaciers are the most important water resource in the arid and semi-arid area, in western China. Several Glacier Lake Outburst Flood (GLOF) events took place in this region in the last century causing significant damage to infrastructure and livelihoods (Richardson, 2000). Thus monitoring glacier change accurately is essential to evaluate the recession velocity and glacier melt water runoff.
For mountain glaciers, most of them are developed in sparsely populated region with harsh natural environment, so conventional method of monitoring glacier can not be implemented in these areas. With the rapid development of satellite remote sensing technology, high-resolution multi-spectral remotely sensed data provide advanced technical support to glacier monitoring. Using geographic information system, optical remote sensing has been widely used in glacier dynamics monitoring (Dwyer, 1995; Haeberli, 2000; Kargel, 2005). However, because of cloud cover and snow cover effects, multi-spectral data is often difficult to accurately monitor glacier changes. Due to the ability of penetrating cloud cover,
all-weather and high resolution, synthetic aperture radar (SAR) remote sensing has a more wide application for ice and snow research (Lu,2010; Zhou, 2010), which has been an important supplement for optical remote sensing to overcome its inherent difficulties.
Existing method for extracting glacier information by SAR is mainly based on interferometric coherence, which selects appropriate threshold of coherence by comparing the glacial surface and non-glacial surface, because the glacial surface is normally de-coherent seriously. By now this method has been applied successfully (Zhou, 2010; Li, 2001, Li, 2008). However, when the coherence contrast is not obvious, this method cannot extract glacier information exactly. In this case, interferometric phase can play an important role. This paper propose a new method to extract the glacier area in mountain regions by using texture analysis of interferometric phase based on gray level co-occurrence matrix (GLCM) for the monitoring of glacier change in Geladandong area, the head of the Yangtze River, from 1997 to 2007.
2. METHOD
2.1 Different feature of interferometric phase textures in glacial and non-glacial region
For C-band, because of serious decorrelation, interferometric phase in glacial region performs noisy texture with no obvious International Archives of the Photogrammetry, Remote Sensing and Spatial Information Sciences, Volume XXXIX-B7, 2012
phase stripes, mainly due to glacial movement and melting snow surface. Non-glacial regions include water, bare soil and vegetation. Due to temporal decorrelation, phase of water area shows a similar texture feature with glacier, namely, dense noise. Bare soil presents obvious interferometric phase fringe, because of high coherence. Vegetation regions include forests and grasslands. For mountain glaciers are often developed in regions with higher elevation and lower temperature, very little forest is distributed. The surrounding area is mainly covered by grassland and lichen low vegetation. Therefore, in a short time interval, these regions are able to maintain high coherence. As glacial and non-glacial area have different phase texture, when the coherence contrast between the two is not strong, phase texture analysis can extract the glacial area.
2.2 Phase texture analysis based on gray level co-occurrence matrix (GLCM)
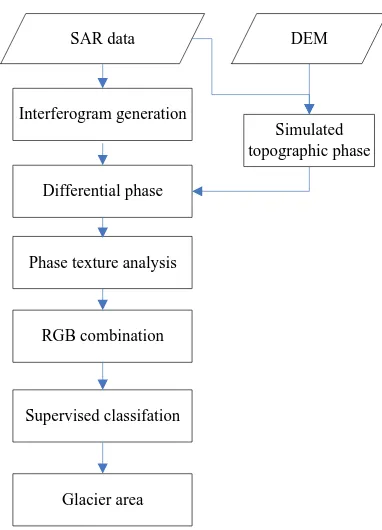
In this research, gray level co-occurrence matrix (GLCM) is used to analysis the texture feature of interferometric phase. GLCM proposed by Haralick is an important space-domain method for analyzing image texture features (Haralick, 1973), which can reflect the distribution characteristics of gray level. GLCM can be expressed as surrounded by eight neighboring pixels, different direction and distance will generate different GLCM. Haralick gives 14 texture features, among them 8 features are commonly used, which are mean, variance, homogeneity, contrast, dissimilarity, entropy, second moment, and correlation. In these features, the mean, variance, contrast and dissimilarity can best distinguish glacial areas from non-glacial areas. 3 of them are chosen for RGB pseudo-colour composite which is then classified by maximum likelihood supervised classification for extracting glacial areas. Figure 1 shows the flowchart of the proposed algorithm for glacier extraction.
3. STUDY AREA AND DATASETS
3.1 Study area
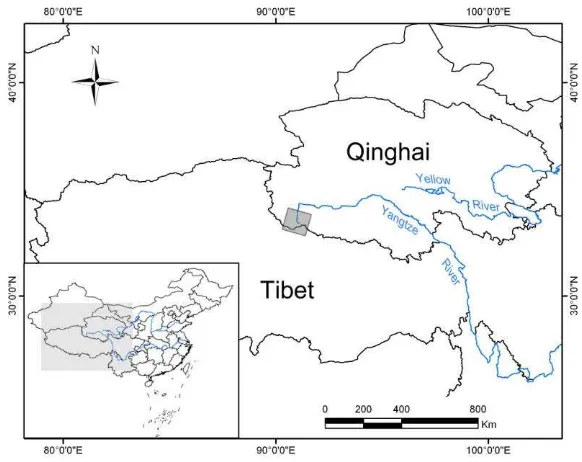
In this paper, Geladandong, the head of Yangtze River, is selected as the study area. Glacial retreat is a big environmental issue in this region. The extent of Geladandong is from 33°
05′N to 33°40′N (latitude) and from 90°45′E to 91°
20′E (longitude), as shown in Figure 2. The altitude ranges
from 5200m to 6621m. There are 274 modern glaciers developed in Geladandong area, covering more than 1000 km2.
SAR data
Figure 1. Flowchart of the proposed algorithm for glacier extraction
3.2 Data sets
SAR images used in this paper include 2 ERS-2 SAR images acquired on August 10 1997 and September 14 1997, and 2 ENVISAT ASAR images acquired on June 24 2007 and July 29 2007. The former 2 images form an interferometric pair with temporal baseline 35 days and perpendicular baseline 62 meters. The latter 2 images generate an interferometric pair with perpendicular baseline 59 meters. Table 1 shows their interferometric parameters.
Digital elevation model (SRTM DEM, with a resolution about 90m) over Geladandong is also collected for removing the topographic phase from interfrogram and also for geocoding the final extracted glacier areas. Figure 3 shows the SAR amplitude image and SRTM DEM. Besides, Landsat TM images acquired on May 5 2007 is obtained to validate the extracted result from the ENVISAT ASAR images.
Table 1. List of interferometric parameters of SAR images used in this paper
Figure 2. Location of the study area. The gray block in the middle of the figure was imaged by ERS SAR and ENVISAT ASAR. SAR image of this area is shown in Figure 3(a).
(a) (b)
Figure 3. SAR amplitude image (19970810) (a) and SRTM DEM (b) in Geladandong region
4. RESULTS
At first, 2 ERS SAR images acquired in 1997 are used to generate interferogram. Figure 4 shows the difference of coherence and phase between glacial area (A) and non-glacial area (B), from which we can see that in the coherence map (Figure 4a), A and B are very similar with low coherence. But in the phase map (Figure 4b), the difference between A and B is visible, where A is noisy with no phase information while B has clear interferometric phase.
This figure demonstrates that the phase texture in glacial and non-glacial area is quite different. Thus it is possible to distinguish them using phase texture information. Based on GLCM, texture features of interferometric phase are generated, including mean, variance, homogeneity, contrast, dissimilarity, entropy, second moment, and correlation. Among them, variance, contrast and dissimilarity are selected as RGB pseudo-colour combination. Finally, maximum likelihood classification (MLC) is performed to the pseudo-colour image to extract glacier. By post-classification process and geo-coding, glacial
area is obtained (Figure 5). The GIS statistics shows that glacial area of Geladandong in 1997 is 862.32 km2.
As for the interferometric pair 20070624 ~ 20070729, the same strategy as ERS SAR image was applied to extract the glacial area of Geladandong in 2007. Figure 6(a) is the interferometric phase generated by ENVISAT ASAR images. Figure 6(b) shows the glacier extracted from phase, with an area of 839.35 km2. By comparing the glacial area between 1997 and 2007, we can find that severe glacier retreat has taken place during the 10 years, with a loss of 22.97 km2.
(a) Interferometric coherence (b) Interferometric phase Figure 4. Interferogram generated by ERS SAR images
(master: 19970810, slave: 19970914)
(a) (b)
A
B
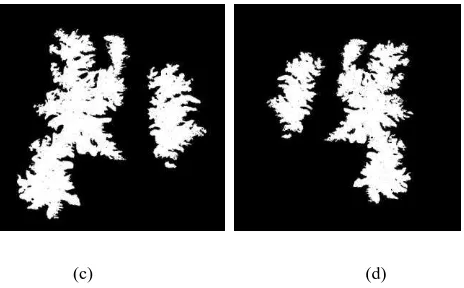
(c) (d)
Figure 5. Extracted glacial area from 2 ERS ASAR images acquired in 1997 over Geladandong region: (a) RGB pseudo-color combination of variance, contrast and dissimilarity; (b) MLC result; (c) glacial area after post classification process; (d)
geo-coded glacial area
(a) (b)
Figure 6. Extracted glacial area from 2 ENVISAT ASAR images acquired in 2007: (a) interferometric phase; (b)
geo-coded glacier area
5. VALIDATION
In this research, optical satellite image (Landsat TM) is used to validate the result extracted from SAR data. Due to the lack of TM images over Geladandong in summer of 1997, TM image obtained on May 5 2007 is selected to validate the extracted glacial area from ENVISAT ASAR images. Figure7 (a) shows TM pseudo-colour image by the combination of band 543. Figure7 (b) is extracted result using MLC and the glacial area is 825.61 km2. The relative difference of glacial area extracted from ASAR and TM is 1.66%. This indicates that the proposed method based GLCM of interferometric phase for extracting glacial area is effective. By analysing the shape of glacial coverage, it is clearly seen that SAR layover was the main reason for SAR’s overestimate, which are shown in Figure 6(b) and Figure 7(b) with red circles.
6. CONCLUSION
Due to the impact of clouds and snow, optical remote sensing images can not effectively monitor the change of glacial areas. SAR data has great potential in glacier monitoring by interferometry. When the coherence contrast between glacial region and non-glacial region is strong, InSAR coherence threshold method can extract glacial area accurately. However, when this contrast is not obvious, we need a new approach. In this paper, interferometric phase analysis based on GLCM is
proposed to extract glacial area. The result is validated by Landsat TM image, which demonstrates that the proposed method can achieve accurate glacial area.
The proposed method is applied to monitor the glacial change over Geladandong area, the head of the Yangtze River from 1997 to 2007, with two ERS-2 SAR SLC imagesand two ENVISAT ASAR SLC images. The results demonstrate during the 10 years, glacial area over Geladandong decreased fast, with a reduction of 22.97km2.
(a) (b)
Figure 7. Extracted glacial area by Landsat TM data: (a) Landsat5 TM image acquired on May 5 2007 (band 543); (b)
glacial area extracted from TM image
REFERENCES
Dwyer, J. L., 1995. Mapping tide-water glacier dynamics in east Greenland using Landsat data. Journal of Glaciology, 41(139), pp. 584-595.
Haeberli, W., Cihlar, J., Barry, R G., 2000. Glacier monitoring within the Global Climate Observing System. Annals of Glaciology, 34, pp. 241-246.
Haralick, R.M., K. Shanmugan, and I. Dinstein., 1973. Textural Features for Image Classification. IEEE Transaction on Systems Man, Cybernetics, 3(6), pp. 610-621
IPCC., 2001. Houghton J T, Ding Y, Griggs D J, et al. Climate Change 2001: The Scientific Basis. Contribution of Working Group I to the Third Assessment Report. Cambridge Univ. Press, Cambridge, UK.
Kargel, J.S., Abrams, M. J., Bishop, M. P., and et al., 2005. Multispectral Imaging contributions to Global Land Ice Measurements from Space. Remote Sensing. Environ, 99, pp. 187-219.
Li, Z., H. Guo, and X. Li., 2001. SAR Interferometry coherence analysis for snow mapping. in Proc. Inter. Geoscience and Remote Sensing Symposium, VI, pp. 2905-2907.
Li, Z., Zhou, J., Tian, B., Xie, C., 2008. The Glacier Identification Using SAR Interfermetric and Polarimetric Information in Qinghai-Tibetan Plateau. in Proc. Inter. Geoscience and Remote Sensing Symposium, IV, pp.1504-1506 Li, Z, Sun, W., Zeng, Q. Z., 1998. Measurements of Glacier Variation in the Tibetan Plateau Using Landsat Data. Remote Sensing of Environment, 63(3), pp. 258-264.
Lu, Z, Dzurisin, D., Jung, H. S., et al., 2010. Radar image and data fusion for natural hazards characterisation. International Journal of Image and Data Fusion, 1: 3, pp. 217 -242.
Lu, A., Yao, T., Liu, S., et al., 2002. Glacier Change in the Geladandong area of the Tibetal Plateau monitored by remote sensing. Journal of Glaciology and Geocryology, 24 (5), pp. 559-562.
Richardson, S. D., Reynolds, J. M., 2000. An overview of glacial hazards in the Himalaya. Quaternary International, 65/66, pp. 31-47.
Su, Z., Liu, Z., Wang, W., et al., 1999. Glacier Response to the Climatic Change and its Trend Forecast in the Qinghai-Tibetan Plateau. Advance in Earth Sciences, 14(6), pp. 607- 612. Wang, Z., Liu, C., 2001. Geographical Characteristics of the Distribution ofGlaciers in China. Journal of Glaciology and Geocryology, 23(3), pp. 231-237.
Zhou, J., Li, Z., Xing, Q., 2010. Deriving Glacier Border Information Based on Analysis of Decorrelation in SAR Interferometry. Journal of Glaciology and Geocryology, 32(1), pp. 133-138.
ACKNOWLEDGEMENTS
This research is supported by the National High Technology Research and Development Program, China, under project number 2011AA120402 and funds from CASM (No. 7771203 and No. K201001). ERS SAR and ENVISAT ASAR data are copyrighted and provided by European Space Agency (ESA). Landsat TM image is provided by the U.S. Geological Survey.