DEVELOPMENT OF PHOTOGRAMMETRY SYSTEM FOR GRASPING FOREST
RESOURCES INFORMATION
Y. Uramoto a, *, L. Zhu a, K. Tachibana a, H. Shimamura a, N. Ogaya b a
PASCO CORPORATION, Research & Development Center
2-8-11 Higashiyama, Meguro-ku, Tokyo 153-0043, Japan - (yootio4278, luihnz7801, kainka9209)@pasco.co.jp
bJapan Forest Technology Association
7 Rokuban-cho, Chiyoda-ku, Tokyo 102-0085, Japan - [email protected]
Commission VIII, WG VIII/7
KEY WORDS: Forestry, Photogrammetry, Stereoscopic, Application, System, Aerial
ABSTRACT:
We have developed a digital photogrammetry system specialized for grasping the forest resources information. In this system, 3D view of aerial photos can be displayed on a PC monitor or a projector. Unlike orthophotos, the 3D display has depth information in it. Hence, the tree canopy size, tree decay situation, etc. can be visualized with more perfection. Moreover, tree heights, forest types and their regions, etc. can also be calculated by this system. Vectorization and segmentation of area, as per forest type, etc., is also possible. In this system, the basic timber volume can be estimated by using aerial photos. Therefore, it reduces the field survey cost significantly. For the efficient use of this kind of system, a system should be used even by non experts with a very basic operational technique. Hence, we have added a series of extra functions in our system and asked a non expert to perform the analysis.
A non photogrammetrists was asked to calculate the timber volume and tree height by using this system. With the very limited instructions from an expert, and in a short period of time, the person was able to use this system quite efficiently and got a good result.
* Corresponding author.
1. INTRODUCTION
Recently, due to the lack of experts and continuous rise in prices to perform field works, grasping of information on forest resources is getting difficult. Hence utilization of aerial photos, satellite data, LiDAR, etc could be a better and cost effective alternative for grasping forest resources information.
Aerial photos are the precious data to look into the past information. In Japan aerial photogrammetry has been in use from last 60 years or so. Hence, by applying the photogrammetry technology, forest stand volume could also be estimated with reasonable accuracy. The effectiveness of photogrammetry in the field of forestry has also been confirmed by Gagnon et al., (1993) and Millera et al., (2000). So far, for this purpose, experts are required to use either a very expensive digital stereo plotter or stereoscope viewer.
Recently cost of high performance PC and 3D display monitor system are getting down. By using the latest advancement in PC performance and 3D technology, the stereo plotter or stereo viewer is gradually being replaced by digital photogrammetry system. Hence, the system is in the reach of hands of ordinary people.
We have developed a digital photogrammetry system specialized for grasping the forest resources information. We have named this system as MORITTAI which is a combination of Japanese word for forest and stereoscopy. In this system, 3D view of aerial photos can be displayed on a PC monitor or a projector. Unlike orthophotos, the 3D display has depth information in it. Hence the tree canopy size, tree decay
situation, etc. can be visualized with more perfection. Moreover, tree heights, forest types and their regions, etc. can also be calculated by this system. Vectorization and segmentation of area, as per forest type, etc., is also possible.
2. OVERVIEW OF MORITTAI
Although it is possible to measure the three-dimensional position from aerial photographs (stereo pair) with elements such as exterior orientation using a Digital Stereo Plotter, huge financial burden and the need of a specialist to handle the software has limited its use. Hence, a need for the system that is not financially prohibitive and user friendly was felt. As a result Morittai system was developed. Morittai has a feature that comes handy even to the users not familiar with photogrammetry related to forest.
2.1 System configuration
The typical hardware configuration of the Morittai is shown in Figure 1. The recommended hardware configuration for Morittai is as follows.
(1) Personal computer: Morittai works seamlessly on Windows-based personal computer. OS is supported on Windows Xp / Vista / 7.
(2) Stereo display equipment: Morittai can display stereoscopic view in anaglyph and also in quad-buffered system. For anaglyph stereoscopic display mode special equipment is not required. However, display in a Quad-buffer system
International Archives of the Photogrammetry, Remote Sensing and Spatial Information Sciences, Volume XXXIX-B8, 2012 XXII ISPRS Congress, 25 August – 01 September 2012, Melbourne, Australia
requires corresponding graphics card, monitor capable of 3D display and shutter glasses. So far, Morittai is tested only in the configuration of NVIDIA 3D Vision.
Figure1. Hardware configuration using the NVIDIA 3D Vision (using dual LCD)
2.2 Software function
The main function of Morittai is as follows.
(1) Morittai displays stereoscopic view of the aerial photographs on the stereo window. Stereoscopic display window uses the buffer for the right eye and left eye to distinguish the Quad-buffer Stereo in OpenGL. In the stereo window, two sub windows overview window and a window that displays the zoomed in portion of the cursor location are also displayed at the same time.
(2) The project file for Morittai stereo display contains aerial triangulation elements or POS (Position and Orientation System) of the aerial photographs and the information about the respective left and right combination of aerial photography.
(3) Morittai has the ability to input and edit vector data of 3D Point, 3D Line and 3D Polygon and can be displayed as a stereoscopic view.
(4) Forward intersection was used to measure the ground coordinates from photo coordinates. Ground coordinates (X, Y, Z) is calculated by employing the conditional condition (eq. 1) between left and right photos. The possible error in the confluence of the points due to the error in orientation elements and external coordinate is optimized by using the formula in eq.2.
(5) A function that automatically generates stereo image for 3D view by image matching has been incorporated. With this additional function, the user with no or very less knowledge in photogrammetry techniques can also use this system.
(6) A function that enables stereoscopic navigation seamlessly between image pairs (as in Google Earth) is also integrated for having a more realistic perspective of the real world scenario.
(7) A sub window is also available that includes the map, or images, or orthophoto etc of the complete project which will provide the information about the users position with respect to the complete project area.
(8) To calculate the timber volume, a function has been incorporated that measures the timber volume directly from the stereo image. A timber volume calculation is a function of tree species, location, tree height and number of trees per 0.1ha. A measurement procedure of timber volume calculation is shown in Figure 2.
Figure 2. Calculation of timber volume
3. EXPERIMENTAL STUDY 3.1 Aerial digital imagery
For the aerial photography of the forested areas, UltraCamX was used and the photograph was acquired with GSD of approximately 30cm. Aerial survey was performed during September to capture the greenness and fullness of the forest.
3.2 Site of experimental study
Aerial survey was performed in the Ogawa region Japan. The study area is a mixed forest hilly region containing planted conifer trees and deciduous trees primarily consisting oak, chestnut, and Japanese cherry. The test field can also be visited in the following web site.
International Archives of the Photogrammetry, Remote Sensing and Spatial Information Sciences, Volume XXXIX-B8, 2012 XXII ISPRS Congress, 25 August – 01 September 2012, Melbourne, Australia
http://fddb.ffpri-108.affrc.go.jp/en/03_ogawa/index.html
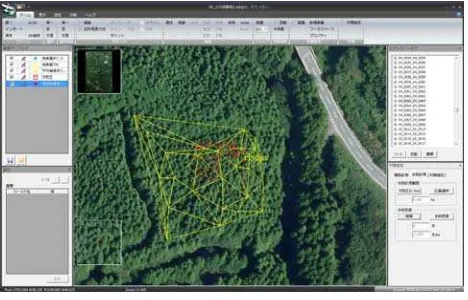
The area used for measuring the tree heights for this experimental study is shown Figure 3. The area contains conifers trees, deciduous trees, and the ground surface (fields, roads).
3.3 Outline of the experimental study
The tree height, used in the calculation of timber volume, in the system is calculated by subtracting the elevation of the crown top and the ground level. Hence, the accuracy of the measurement depends on the accurate measurement of the crown top and the ground surface. The top of the tree crown is measured directly on the system by putting the cursor at the top of the tree and by adjusting the tree height within the stereo pair. To measure tree height, the ground elevation under the tree canopy obtained from Triangulated Irregular Network (TIN) constructed from the total station ground survey points was used. The difference in elevation between the tree height measured and the ground height under the tree canopy measured from the TIN gave the tree height.
To evaluate the accuracy of the tree height measurement, the measurement of the elevation of the top of the tree crown obtained by the automatic stereo matching between the image pair was used as the base data for this experiment.
The ID numbers in Figure. 3 are the measurement points of confiers trees, decidious trees and the ground points.
For the accuracy evaluation of ground height measured by Morittai, the ground elevation measured by Morittai was compared against ground elevation constructed from LiDAR data.
3.4 Result and Discussion
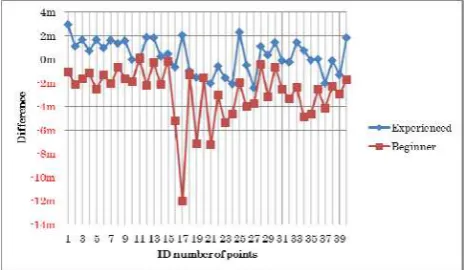
As a test of the system, two persons were assigned to measure the top of the conifer trees, deciduous trees and the ground elevation. One of the person employed for the test was a beginner with no prior experience in forestry and photo interpretation. However, the other person who took part in the experiment had a lot of experience in photo interpretation but no knowledge about forestry. The accuracy of the height measurement in the Morritai by the participants is shown in Figure 4. In the figure, ID number 1-9 represents measurement of conifer tree heights, ID 10 to 18 and 25 to 40 represents measurement of deciduous tree height and ID 19 to 24 represents the measurement of ground height. From the figure, the general trend shows that the beginner generally underestimate the height measurement. However, the experienced person has slightly overestimated the height measurement at places. It is not clear whether it is an empirical thing or due to individual differences, and whether the differences could be corrected by systematic practice.
Figure 3. Experiment area
Figure 4. Comparison of accuracy evaluation of height measurement
Table 1 shows the accuracy evaluation of the test cases. The overall error of the height measurement including both type of trees and ground height was about 1 m for experienced and about 3 m in case of beginner. Hence an average error obtained by considering observations from the both experienced and the beginner observer was about 2 m.
Experienced Beginner SD (m) RMS (m) SD (m) RMS (m)
Conifers 0.6 (2.9) 1.5 0.6 (-2.5) 1.7
Deciduous 1.3 1.3
(-2.4) 2.4
3.7 (-12.0)
Ground 0.6 0.6
(-0.9) 1.8
3.9 (-5.4)
Total 1.2 1.3 2.1 3.4
Table 1. Accuracy results of height measurement
From the table it is seen that the person with the prior experience has measured with lower error level. The result shows that for the beginner, measuring tree height for conifer trees was much easier than for the deciduous trees. The top of a conifer tree is easy to be distinguished for the beginner compared to the convex shape of the deciduous trees. Hence beginner had less trouble deciding the tree top. But the tree shape was little of a concern for the person with prior experience. The interesting observation from the experimental study shows that the person with prior experience could measure the ground height with the highest accuracy followed by deciduous tree and conifer trees. However, considering the beginner, it was just opposite. It seems that the beginner will have an ease in measuring the structure with distinct shape than plane like ground or convex shape like deciduous trees.
The maximum difference in height measurement observed by the person with a prior experience was 2.9m for a conifer tree, -2.4m for a deciduous tree and -0.9m at a ground surface. In case of the beginner, the maximum difference in the height measurement for a conifer tree was -2.5m, a deciduous tree was -12.0m and for a ground surface was -5.4m. The maximum difference of -12.0m height was observed at point ID 12. The location of ID 12 is depicted in Figure 3. This was an exceptional error produced due to the carelessness during observation made by the beginner. In general, the experiment shows that the maximum error in tree height measurement by an
International Archives of the Photogrammetry, Remote Sensing and Spatial Information Sciences, Volume XXXIX-B8, 2012 XXII ISPRS Congress, 25 August – 01 September 2012, Melbourne, Australia
experienced observer was around 3m and that by a beginner was around 5m.
The average measurement error by the experienced and the beginner was 1.3m and 3.4m respectively. Considering the analogue photography, accuracy achieved by using stereoscopic is with in the range of about 2m. Hence, in our case, even for the beginner if we skip the mistake in measurement due to carelessness accuracy close to 2m was possible. The beginner was able to get the result with in the half day of starting to use the Morittai for the first time. The training was provided for half day and the person was able to do the measurement of 40 points within two hours.
4. CONCLUSION
In this study, we implemented and reviewed the functionality needed to grasp the information of forest resources by making use of digital aerial photography. The major advantage of Morittai, our system, is stated below.
(1) The results showed that it was possible to get good data from aerial photography even for beginners with no experience of photo interpretation using our system.
(2) Since the stereoscopic view of the forest can be displayed in the PC monitor or projector, the system can be used for technical guidance to the beginner or can be used for expert consultation to multiple person at a same time.
(3) Compared to digital orthoimage, the system can be used to visualize the tree trunk in a high definition. Moreover, the decay situation of trees can also be visualized more easily with a high resolution compared to the digital orthoimage.
(4) Since timber volume can be calculated from the aerial photos, this system reduces the cost of field survey. However, in the cases where the ground surface is not visible due to high vegetation density, the evaluation of ground height from the DTM constructed from LiDAR data will improve the accuracy of timber volume measurement.
This system is being utilized in companies and research institutions that deal with forest resources and management. Furthermore, this system is also adopted in the training curriculum for the forest information technologist.
5. REFERENCE
Gagnon, P.A., Agnard, J.P., Nolette, C., 1993. Evaluation of a softcopy photogrammetry system for tree-plot measurements, Can. J. For. Res. 23, pp. 1781-1785.
Millera D. R., Quineb C. P., Hadley. W., 2000. An investigation of the potential of digital photogrammetry to provide measurements of forest characteristics and abiotic damage,
Forest Ecology and Management, Vol. 135, pp. 279-288.
Acknowledgements
The authors would like to thank Japan forestry agency’s digital forest information development project for supporting this research.
International Archives of the Photogrammetry, Remote Sensing and Spatial Information Sciences, Volume XXXIX-B8, 2012 XXII ISPRS Congress, 25 August – 01 September 2012, Melbourne, Australia