www.elsevier.nlrlocateraqua-online
Pharmacokinetics and metabolism of miloxacin in
cultured eel
Ryuji Ueno
), Yasushi Okada, Takuya Tatsuno
Faculty of Bioresources, Laboratory of Bioresources, Mie UniÕersity, Tsu, Mie-5148503, Japan
Received 27 April 2000; received in revised form 12 July 2000; accepted 20 July 2000
Abstract
Ž w x .
Miloxacin 5,8-dihydro-5-methoxy-8-oxo-2 H-1,3-dioxolo- 4,5-g quinoline-7-carboxylic acid is a synthetic antibacterial agent and is regulated in conformity with the Pharmaceutical Law in Japan. The pharmacokinetics and metabolism of miloxacin after intravascular and oral
administra-Ž .
tion in cultured eel Anguilla japonica were examined by using our high-performance liquid
Ž .
chromatography HPLC system, which was developed as a reliable and precise method for simultaneous determination of miloxacin and its metabolite in this study. The kinetics of miloxacin was described by a two-compartment model after intravascular administration. The
Ž .
distribution half-life T1r2as0.86 h of miloxacin was shorter than the elimination half-life
ŽT1r2bs34.7 h . The kinetics of orally administered miloxacin was fitted to a one-compartment.
Ž . Ž .
model. Miloxacin was assimilated quickly Ta1r2s3.5 h and cleared slowly T1r2s34.7 h after oral dosing. The bioavailability was calculated to be 87.9%. The tissue levels of miloxacin reached their peak levels within 1 day after oral administration. At their highest levels, the concentrations of miloxacin were observed in the order of kidney)muscle)liver. Miloxacin, its
w x Ž .
main metabolite 5,8-dihydro-8-oxo-2 H-1,3-dioxolo- 4,5-g quinoline-7-carboxylic acid M-1 and the glucuronic acid conjugate of miloxacin and M-1 were detected, and a large amount of M-1 was still observed in bile at 20 days post dosing. As an application of pharmacokinetics, we attempted to evaluate the Japanese dosage regimens of miloxacin in cultured eel. A curve for predicting miloxacin levels was obtained by a computerized calculation, using various pharma-cokinetics parameters that were experimentally determined. The curve was coincident with drug
Ž .
levels during the actual multiple oral dosing 60 mgrkg body weight in this experiment. The
Ž .
serum levels of miloxacin were maintained above the MIC for Edwardsiella tarda, 0.1mgrml .
)Corresponding author. Tel.:q81-59-231-9568; fax:q81-59-231-9568.
Ž .
E-mail address: [email protected] R. Ueno .
0044-8486r01r$ - see front matterq2001 Elsevier Science B.V. All rights reserved.
Ž .
However, this seems to be a considerably excessive dosing because of the high value of the
Ž .
average steady-state serum concentration Css: 55.4mgrml . q2001 Elsevier Science B.V. All
rights reserved.
Keywords: Pharmacokinetics; Metabolism; Eel; Miloxacin; Bioavailability
1. Introduction
Ž w x
Miloxacin 5,8-dihydro-5-methoxy-8-oxo-2 H-1,3-dioxolo- 4,5-g
quinoline-7-carbo-.
xylic acid which is closely related to oxolinic acid in structure, has exhibited a broad spectrum of antibacterial activity and is especially active against gram-negative bacteria. Fig. 1 shows the chemical structure of miloxacin. The drug has been used for treatment of edwardsiellosis in cultured eel and is regulated in conformity with the Pharmaceutical Law in Japan. However, there are few papers concerning miloxacin in cultured eel,
Ž .
although there have been some studies of miloxacin in yellowtail Ueno et al., 1985a,b . The present paper deals with the pharmacokinetics and metabolism of miloxacin after administration in cultured eel. Miloxacin and its metabolite 5,8-dihydro-8-oxo-2
H-1,3-w x Ž .
dioxolo- 4,5-g quinoline-7-carboxylic acid M-1 , which also has antibacterial activity
ŽIzawa et al., 1978 , were simultaneously determined with our newly developed high-.
Ž .
performance liquid chromatographic HPLC method.
2. Materials and methods
2.1. Fish
Japanese eel Anguilla japonica were obtained from the Fisheries Research Institute in Aichi Prefecture, Japan. The average body weight was 175 g. The fish were kept in
tanks with running filtered water. The average water temperature was 278C.
2.2. Chemicals
Ž .
Miloxacin and M-1 were obtained from Sumitomo Pharmaceutical, Osaka, Japan .
Ž .
b-Glucuronidase bovine liver, 78,000 Fishman unitsrg was from Tokyo Kasei Kogyo
ŽTokyo, Japan . Other chemicals were of analytical or HPLC grade..
2.3. Drug administration
Fish were anesthetized by placing them in ice-water for 5 min. For intravascular
Ž .
administration, miloxacin was dissolved in sterilized saline 100 mgrml and injected
into the caudal vein at a dose of 30 mgrkg of body weight. The drug was mixed with a
fish diet and was orally given to the fish by a catheter at a dosage of 60 mgrkg body
weight. The drug was given either in a single dose in 1 day or in six doses over a 6-day period. Then, five fish were sampled at intervals ranging from 0.5 or 1 h to 20 days after the administration. The blood was sampled from the caudal vein with a syringe. The serum was obtained by centrifugation of the blood after storage overnight in a
refrigerator and kept frozen at y408C until analysis. Each sample was analyzed by
HPLC. The muscle, liver, kidney, and bile were also collected. Samples of each type
were pooled and stored aty408C.
2.4. Assay procedure
Ž .
Tissue samples 1 g muscle or 1 ml serum were homogenized for 2 min in 30 ml of
Ž .
0.1 M citrate buffer, pH 3.0: N, N-dimethylformamide 29:1 using a Physcotron
ŽNichi-On K.K., Tokyo, Japan . After centrifugation at 15,000 rpm for 20 min, the.
supernatant was transferred into a 500 ml-separatory funnel, and 5.0 g of NaCl and 15 ml of ethyl acetate were added to the solution. The funnel was then gently shaken for 5 min. After standing for a few minutes, the organic layer was pooled. The ethyl acetate treatment was repeated two more times, and then the aqueous layer was adjusted to pH 11–12 by 6 N NaOH and re-extracted twice with 15 ml of ethyl acetate. The aqueous layer was discarded. The pooled ethyl acetate layer was evaporated to dryness. The
residue was dissolved in 1 ml of 1% Na CO and the solution was injected into the2 3
HPLC.
Ž .
Tissue samples 0.5 g liver or kidney, 0.3 ml bile was homogenized and extracted by the same ethyl acetate treatment as described above. The aqueous layer was discarded. The pooled ethyl acetate layer was concentrated to ca. 30 ml in vacuo. Fifteen milliliters of saturated NaCl was added to the concentrate. The sample was shaken vigorously for 5 min and centrifuged. The aqueous layer was discarded, and the resulting organic layer was evaporated to dryness. The residue was dissolved in a mixture of 5 ml of 1%
Na CO , 25 ml of 0.1 M citrate buffer, pH 3.0 and 2.0 g of NaCl. Fifteen milliliters of2 3
n-hexane was added to the solution. The sample was shaken vigorously for 5 min and
centrifuged at 3,000 rpm for 5 min. The organic layer was discarded. The resulting
Ž .
aqueous layer was poured into a Sep-Pak C18 cartridge Waters, Milford, MA, USA ,
which had previously been washed and wetted with 10 ml of methanol and 15 ml of water. The cartridge was washed with 10 ml of water, and then miloxacin was eluted with 20 ml of methanol. The eluate was evaporated to dryness, and the residue was
dissolved in 1 ml of 1% Na CO and the solution was injected into the HPLC.2 3
The HPLC system consisted of a Gilson Model 802 pump and 311A UV detector
ŽGilson, France and a Chromatopac C-R3A integrator Shimadzu Seisakusho, Kyoto,. Ž
. Ž
Japan . The analytical column was a YMC-Pack C18 A-303 prepacked column 25
.
Ž .
0.1% trifluoroacetic acid: N, N-dimethylformamide:acetonitrile 72:1:27 . The flow rate
was 1.0 mlrmin, and the UV detector was set at 254 nm. The injection volume was 20
ml. The column temperature was 308C.
A standard solution containing of 100mgrml miloxacin and 100mgrml of M-1 was
prepared in 1% Na CO . The solution was diluted to the required concentration with 1%2 3
Na CO before use.2 3
2.5. Pharmacokinetic analysis
The most common method of pharmacokinetic evaluation is to assume that the drug concentration-time data can be described by one of several compartment models and to fit the data to an equation consistent with the assumed model using a non-linear least-squares regression. In our study, a pharmacokinetic analysis was applied assuming a one- or two-compartment model using the non-linear least-squares program MULTI
ŽYamaoka et al., 1981 . Selection of models was judged by Akaike’s information.
Ž .
criterion Yamaoka et al., 1978 .
Ž .
Wagner and Nelson 1964 reported that the drug absorption rate could be calculated from serum level vs. time data using the following equation when the behavior of the drug is expressed by a one-compartment model:
t
CtqKe
H
Cd tAt 0
Fraction absorbeds s `
A` Ke
H
Cd t0
where A is the cumulative amount of the drug absorbed up to time t, A is the amountt `
of drug ultimately absorbed. C is the concentration at time t, and Ke is the first-ordert
Ž .
elimination rate constant the value for the drug following intravascular administration . This equation relates the cumulative amount of drug absorbed after a certain time to the amount of drug ultimately absorbed, rather than to the dose administered.
2.6. ConsecutiÕe oral administration
Ž .
The serum level during multiple oral dosing of a constant dose Cn and average Ž .
steady-state serum concentration Css can be estimated according to the formula:
ŽynPKePt. ŽynPKaPt.
where F is the bioavailability, Ka is the first-order absorption rate constant, Vd is the
apparent volume of distribution,t is the dosage interval, n is the dosage time, and Ke is
Ž
the first-order elimination rate constant the value for the drug following oral administra-.
2.7. Statistical moment analysis
Ž .
The area under the concentration-time curve AUC was calculated by using the
Ž .
trapezoid rule including the terminal portion. The mean residence time MRT of the drug was obtained by a non-compartment analysis based on the statistical moment
Ž .
theory Yamaoka and Tanigawara, 1983 .
The bioavailability was calculated from the following equation:
AUCp .o .Pdosei . v .
F %
Ž .
s 100AUCi . v .Pdosep .o .
where p.o. represents the oral administration, and i.v. represents the intravascular administration.
2.8. Presence of glucuronide conjugate
Some of the residues that were previously prepared for miloxacin and M-1 extraction were used for determination of glucuronide conjugates. These residues were from samples that were taken at the time of maximum serum concentration of miloxacin
ŽTmax.and at 20 days post dosing. Each residue was dissolved in 100 ml of 0.1 M citrate
buffer, pH 3.0, and homogenized for 1 min. Five milligrams of b-glucuronidase and 1
ml of toluene were added to the homogenate as an antiseptic. The mixture was incubated
at 378C overnight. After incubation, the reaction mixture was concentrated to ca. 30 ml
in vacuo. The released miloxacin and M-1 were re-extracted from the concentrate as described in the text.
3. Results
3.1. Examination of analytical procedures
Table 1 shows a comparison of the extractions of miloxacin and M-1 from eel muscle using different solvents. The recoveries of miloxacin and M-1 were 85% and 76%,
Ž .
respectively, for a mixture of 0.1 M citric acid, pH 3.0, and dimethylformamide 29:1 .
Table 1
Ž .
Comparison of extracting solution citrate buffer, pH 3.0: N, N-dimethylformamide for miloxacin and M-1 from muscle of eel
Ž . Ž .
Extracting solution ml 0.1 M citrate buffer: Recovery %
N, N-dimethylformamide Miloxacin M-1
30 0 58.5 56.8
29.5 0.5 88.3 68.1
29 1 84.5 75.6
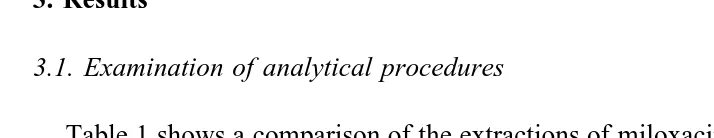
Table 2
Effect of NaCl concentration in the extracting solution on the recovery of miloxacin and M-1
Ž . Ž .
As shown in Table 2, the recoveries of both drugs increased by the addition of NaCl to the solvent. The addition of NaCl had an effect on the partition of water and organic solvent.
The presence of miloxacin and M-1 in the liver, kidney, and bile could not be determined because of the presence of undesirable peaks in the chromatogram, even when the above procedure was used. Therefore, we attempted to further clean up the internal organ samples prepared with the ethyl acetate treatment by using a hexane
Ž .
treatment for defatting and a Sep-Pak C18 cartridge. These treatments were effective in
Ž .
eliminating interfering substances from liver, kidney, and bile unpublished data .
Finally, the analytical procedure was done as described above.
Miloxacin and M-1 were added to various tissues at a concentration of 2mgrml or g,
Ž .
and then the recovery rates were determined Table 3 . The recoveries and coefficients of variation of miloxacin and M-1 were 81–94% and 1.9–8.0% and 79–89% and 1.2–6.6%, respectively. The detection limits of miloxacin and M-1 at a signal-to-noise
ration of 3 were 0.03 mgrml or g for serum and muscle, 0.06 mgrg for liver and
kidney, and 0.1mgrml for bile. The data reported in this study were not corrected for
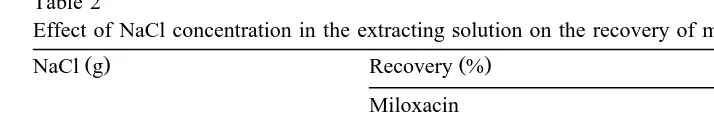
recovery. Fig. 2 shows typical chromatograms of miloxacin and M-1 obtained from various tissues in eel.
3.2. Pharmacokinetic analysis
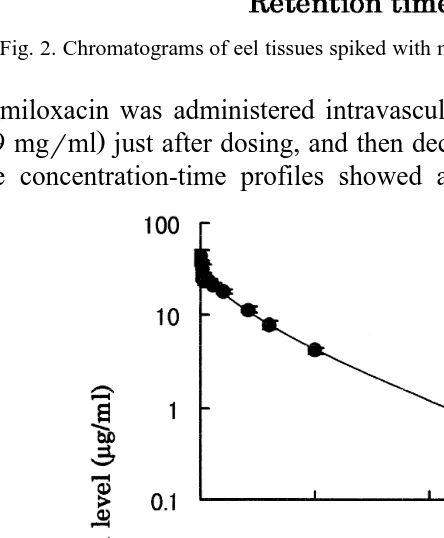
3.2.1. IntraÕascular and oral administration
Fig. 3 shows the serum level vs. time plots of miloxacin after intravascular and oral administrations.
Table 3
Recovery of miloxacin and M-1 from various tissues of eel
Ž .
Tissues Recovery %
Miloxacin M-1
Ž . Ž .
Serum 94.4 5.2 79.4 6.0
Ž . Ž .
Muscle 90.3 4.3 86.7 6.6
Ž . Ž .
Liver 86.1 2.4 89.1 1.7
Ž . Ž .
Kidney 81.0 8.0 79.8 4.3
Ž . Ž .
Bile 90.6 1.9 83.9 1.2
Ž . Ž .
Fig. 2. Chromatograms of eel tissues spiked with miloxacin A and its metabolite B .
When miloxacin was administered intravascularly, the serum concentration reached
Ž .
Tmax 43.9 mgrml just after dosing, and then decreased gradually to 0.69 mgrml at 12
Ž .
days. The concentration-time profiles showed a sharp distribution phase a phase
Ž . Ž .
Table 4
Pharmacokinetic parameters for miloxacin following intravascular administration Parameters
Water temperature 8C 27
y1
within 5 h and a mild elimination phase b phase from 8 h to 12 days after dosing. The
concentration-time profile could adequately be described by a two-compartment model.
Cts28.5 exp
Ž
y0.81t.
q25.0 expŽ
y0.02 t.
The obtained pharmacokinetic parameters of miloxacin are shown in Table 4.
Ž .
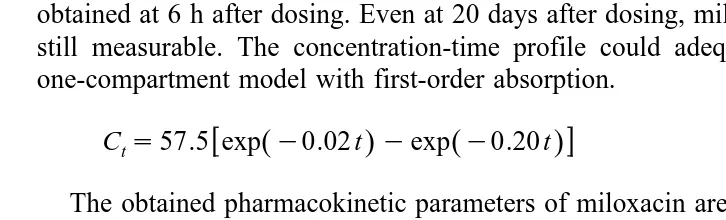
When miloxacin was administered orally, as shown in Fig. 3, Tmax 43.4mgrml was
Ž .
obtained at 6 h after dosing. Even at 20 days after dosing, miloxacin 0.18mgrml was
still measurable. The concentration-time profile could adequately be described by a one-compartment model with first-order absorption.
Cts57.5 exp
Ž
y0.02 t.
yexpŽ
y0.20 t.
The obtained pharmacokinetic parameters of miloxacin are shown in Table 5.
Table 5
Pharmacokinetic parameters for miloxacin following oral administration Parameters
Water temperature 8C 27
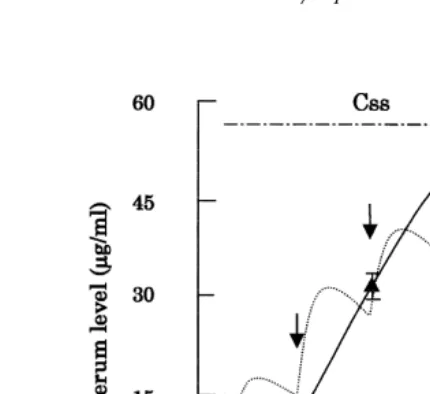
Fig. 4. Serum level of miloxacin in eel during 6-days consecutive oral administration at a dose of 60 mgrkg.
Ž
: Serum level during the multiple posing Symbols indicate the mean and standard deviations for four
. Ž
fish. . ---: A predicted curve. The arrow: time of dosing, –P–P–: Css Average steady-state serum
.
concentration .
3.3. ConsecutiÕe oral administration
Fig. 4 shows the serum level of miloxacin after 6 days of consecutive oral administration. A curve for predicting miloxacin levels was obtained by a computerized calculation, using various pharmacokinetic parameters that were obtained
experimen-Table 6
Tissue levels of miloxacin in eel after oral administration at a dose of 60 mgrkg Time after administration Tissues
Muscle Liver Kidney Bile
1 h 0.48 3.62 1.73 34.7
3 h 2.67 4.91 20.6 29
6 h 3.35 4.32 8.43 24.8
9 h 4.99 4.97 7.4 25
12 h 16.3 23 22.3 108
1 day 28.4 24.8 37.3 390
2 days 18.5 9.19 11.5 330
3 days 12.5 8.28 11.9 161
5 days 5.49 3.12 3.61 213
8 days 2.33 1.2 1.14 177
12 days 0.83 0.43 0.56 52.6
16 days 0.08 ND ND 0.35
20 days 0.07 ND ND 0.25
Table 7
Tissue levels of M-1 in eel after oral administration at a dose of 60 mgrkg
Time after Tissues
The unit of the experimental number ismgrml or g. ND: not detected.
tally. The curve was coincident with drug levels during the actual multiple oral dosing
Ž60 mgrkg body weight in this experiment. The serum level of miloxacin was sharply.
Ž .
increased at every dosing, and Tmax 51.4 mgrml was observed on the 6th day during
oral dosing.
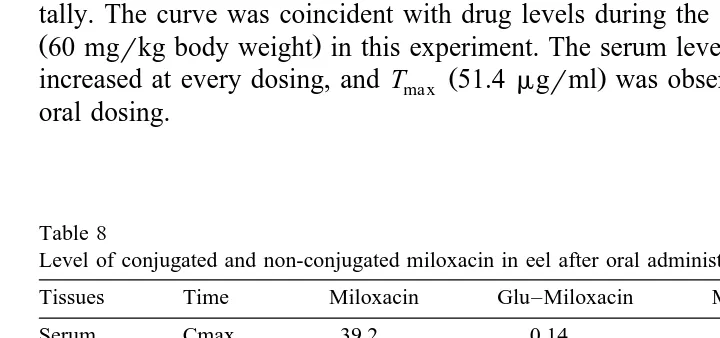
Table 8
Level of conjugated and non-conjugated miloxacin in eel after oral administration
Tissues Time Miloxacin Glu–Miloxacin M-1 Glu–M-1
Serum Cmax 39.2 0.14 2.8 0.32
92.3% 0.3% 6.6% 0.8%
20 days ND ND ND 0.11
Muscle Cmax 28.4 1.51 0.26 1.63
89.3% 4.7% 0.8% 5.1%
20 days 0.07 ND ND 0.2
Liver Cmax 24.8 1.12 7.66 2.25
69.2% 3.1% 21.4% 6.3%
20 days ND ND ND 2.1
Kidney Cmax 37.3 2.41 9.22 2.34
72.8% 4.7% 18.0% 4.6%
20 days ND ND ND 0.32
Bile Cmax 390 1056 236 123
21.6% 58.5% 13.1% 6.8%
20 days 0.25 0.36 1.01 0.34
3.4. Tissue distribution of miloxacin after oral administration
Table 6 shows the tissue level of miloxacin in eel after oral administration. Miloxacin was detected in the non-alimentary tissues of all fish within 1 h after administration of an oral dose. The tissue levels of miloxacin reached their peak levels within 1 day after administration. At their highest levels, the concentrations of miloxacin were observed in
Ž . Ž . Ž .
the order of kidney 37.3 mgrg )muscle 28.4 mgrg )liver 24.8 mgrg . A
Ž .
considerable amount of miloxacin 390 mgrml was observed in the bile. The tissue
Ž .
levels of M-1 in eel after oral administration were examined Table 7 . The peak levels of M-1 were observed in all tissues between 1 and 2 days post dosing. The bile levels
remained above 100mgrml for up to 12 days.
3.5. Metabolites of miloxacin
Table 8 shows the levels of conjugated and non-conjugated miloxacin after oral administration in eel. Miloxacin, M-1 and their glucuronic acid conjugates were
detected, and M-1 was still observed in bile at 20 days post dosing. At the Tma x, the
percentage of miloxacin that was in miloxacin and its metabolites was high in serum
Ž92%. and muscle Ž89% . However, a high concentration of the glucuronic acid.
conjugate of miloxacin was observed in the bile.
4. Discussion
Only one previous study has investigated the assay of miloxacin and M-1 in fish by
Ž .
HPLC Ueno et al., 1985a . In that study, we reported that these drugs could not be detected in internal organs such as liver, kidney, and gall bladder because of the
Ž .
presence of interfering substances, and that M-1 showed very low recovery 11–22% from various tissues in fish. Thus, the present study was conducted to develop an analytical procedure that detects miloxacin and M-1 even in the internal organs of fish. As the preceding results show, we have developed a selective, reliable, and precise method for the simultaneous determination of miloxacin and its metabolite in cultured eel tissues.
We showed that the pharmacokinetics of miloxacin after intravascular administration in eel could be described by a two-compartment model. Oxolinic acid and nalidixic acid
are closely related quinolones that are structurally similar to miloxacin. Bjorklund and
¨
Ž . Ž .
Bylund 1991 and Kleinow et al. 1994 reported a two-compartment model for
oxolinic acid after intravascular administration in rainbow trout. Our previous paper
ŽUno et al., 1996 also reported a two-compartment model for nalidixic acid in rainbow.
trout.
Ž .
In eel after intravascular administration, the half-life for serum distribution T1r2a
Ž .
was 0.86 h, and the half-life for elimination T1r2b was 34.7 h. For comparison,
rainbow trout, after given a dose of oxolinic acid, exhibited T1r2a and T1r2b values of
Ž . Ž
0.15 and 81.3 h Kleinow et al., 1994 and 0.31 and 69.7 h Bjorklund and Bylund,
¨
.
oxolinic acid in rainbow trout is slower than the rate of elimination of miloxacin in eel.
Ž .
However, Uno et al. 1996 reported that, in rainbow trout, the absorption of nalidixic
Ž .
acid T1r2as1.35 h was slower than the absorption of oxolinic acid and miloxacin, and
Ž .
that the elimination of nalidixic acid T1r2bs12.8 h was faster than the elimination of
oxolinic acid and miloxacin.
Ž .
An apparent steady-state distribution Vss: 0.81 lrkg was found for miloxacin in eel.
Ž . Ž
A similar Vss value 1.01 lrkg for nalidixic acid was obtained in rainbow trout Uno et
.
al., 1996 . In rainbow trout, the Vss for oxolinic acid was two times higher than that for
Ž .
miloxacin Bjorklund and Bylund, 1991; Kleinow et al., 1994 . The total body clearance
¨
ŽClB., defined as the total volume in the body including blood, kidney, and liver that isŽ .
completely cleared of a drug per unit time, is an important parameter for characterizing
drug disposition. The ClBof miloxacin was similar to that of oxolinic acid in rainbow
Ž . Ž .
trout 16.9 and 20.2 mlrkgrh as reported by Bjorklund and Bylund 1991 and
¨
Ž .
Kleinow et al. 1994 . The clearance time for miloxacin from the body tissues in eel,
obtained from ClBrVss, was 50 h. In rainbow trout, the clearance time for oxolinic acid,
Ž .
calculated from the data of Bjorklund and Bylund 1991 , was 94 h. Similarly, using the
¨
Ž . Ž .
data of Kleinow et al. 1994 and Uno et al. 1996 , the clearance times of oxolinic and nalidixic acids were calculated to be 106.5 and 18.4 h, respectively. Therefore, among members of the quinolone group, nalidixic acid has the fastest terminal elimination rate, though there are some differences among fish species.
The pharmacokinetics of miloxacin in eel after oral administration was described by a one-compartment model with first order absorption. Our previous papers have reported one-compartment models with first order absorption for nalidixic acid in rainbow trout ŽUno et al., 1992b ..
The bioavailability of miloxacin following oral administration to eel was calculated to be 87.9%. Although there are no published bioavailability values for miloxacin in fish, our values in eel are considerably higher than those previously reported for oxolinic acid
Ž13.6–38.1%. ŽBjorklund and Bylund, 1991; Cravedi et al., 1987 . The bioavailability of
¨
.Ž .
nalidixic acid was reported to be 89.6% in rainbow trout Uno et al., 1996 .
Ž .
The mean absorption time MAT , defined as MRTp.o.yMRT , was 5.9 h. The timei.v.
Ž .
required for drug absorption TDA is defined as the time for absorption to reach 90% of the maximum level. TDA, calculated by the Wagner–Nelson method, was 8 h. For comparison, the TDAs for nalidixic acid and oxolinic acid in rainbow trout were found
Ž .
to be 120 and 144 h, respectively unpublished data . Thus, miloxacin is absorbed in eel much more quickly than are nalidixic acid and oxolinic acid in rainbow trout.
Ž Several drugs have been shown to be rapidly assimilated in the stomach in fish Ueno
.
et al., 1988a,b, 1995; Droy et al., 1990; Uno et al., 1992a,b, 1993 . In yellowtail, the peak levels of miloxacin in all tissues were attained at 1–3 h post dosing, and at that
Ž
time, the concentrations of miloxacin were observed in the order of liver 1.48
. Ž . Ž . Ž .
mgrml )muscle 1.13mgrg )serum 0.66mgrg Ueno et al., 1985a,b . Miloxacin
is much less available and more quickly assimilated in yellowtail than in eel.
In mammals, miloxacin is biotransformed to at least seven metabolites: M-1, 1,4-di-Ž .
hydro-7-hydroxy-1,6-dimethoxy-4-oxoquinoline-3-carboxylic acid M-2 ,
1,4-dihydro-Ž .
6,7-dihydroxy-4-oxoquinoline-3-carboxylic acid M-3 , and the glucuronides of
Ž .
Ž . glucuronides of miloxacin and M-1 were observed in yellowtail Ueno et al., 1985a,b , and the same metabolites were also found in eel in the present study. The M-1 level was
Ž .
much higher in the internal organs, especially the gall bladder i.e., bile . The metabolism of miloxacin seems to be less complex in fish than in mammals.
As an application of pharmacokinetic studies, we attempted to evaluate the Japanese dosage regimens of miloxacin in cultured eel. As shown in Fig. 4, the serum levels of
Ž
miloxacin were maintained above the MIC for Edwardsiella tarda, 0.1 mgrml; Ito,
.
1978 . However, this seems to be an excessive dose because of the high value of Css
Ž55.4 mgrml . An excessive dose not only raises costs for fish farms, but also causes.
Ž
environmental pollution and outbreaks of drug-resistant bacteria Bjorklund et al., 1990,
¨
.
1991 . Further investigations are needed to compare these theoretical calculations with results obtained under actual conditions of the dosage regimens. Such studies should include determinations of the rate of diffusion of feed into the pond water, the amount of residual feed, the compounding ratio of feed, the chemical types of drugs and water temperature used in the fish farms.
References
Bjorklund, H.V., Bondestam, J., Bylund, G., 1990. Residues of oxytetracycline in wild fish and sediments¨
from fish farms. Aquaculture 86, 359–367.
Bjorklund, H.V., Rabergh, C.M.I., Bylund, G., 1991. Residues of oxolinic acid and oxytetracycline in fish and¨
sediments from fish farms. Aquaculture 97, 85–96.
Bjorklund, H.V., Bylund, G., 1991. Comparative pharmacokinetics and bioavailability of oxolinic acid and¨
Ž .
oxytetracycline in rainbow trout Oncorhynchus mykiss . Xenobiotica 21, 1511–1520.
Cravedi, J.P., Ghoubert, G., Delous, G., 1987. Digestibility of chloramphenicol, oxolinic acid, and oxytetracy-cline in rainbow trout and influence of these antibiotics on lipid digestibility. Aquaculture 60, 133–141. Droy, B.F., Goodrich, M.S., Lech, J.J., Kleinow, K.M., 1990. Bioavailability, disposition and
pharmacokinet-Ž .
ics of ormetoprim in rainbow trout Salmo gairdneri . Xenobiotica 20, 147–157.
Ito, S., 1978. Treatment of Edwardsiella tarda infections in Anguilla japonica by a synthetic antibiotic, AB-206. Report of the Fisheries Research Institute in Aichi, pp. 128–129.
Izawa, A., Kizaki, Y., Kohda, A., Yamamori, K., Komatsu, T., Yoshitake, A., 1978. AB-206, A novel chemotherapeutic agent studies about absorption, distribution and excretion of AB-206 by bioassay. Chemotherapy 26, 71–76.
Kleinow, K.M., Jarboe, H.H., Shoemaker, K.E., Greenless, K.J., 1994. Comparative pharmacokinetics and
Ž . Ž
bioavailability of oxolinic acid in channel catfish Ictalurus punctatus and rainbow trout Oncorhynchus
.
mykiss . Can. J. Fish. Aquat. Sci. 51, 1205–1211.
Ueno, R., Okumura, M., Sakanaka, K., Horiguchi, Y., 1985a. Residue of miloxacin in various tissues of cultured yellowtail by oral administration. Bull. Fac. Fish., Mie Univ. 12, 167–173.
Ueno, R., Okumura, M., Horiguchi, Y., 1985b. Metabolites of miloxacin in cultured yellowtail and their antibacterial activity. Bull. Fac. Fish., Mie Univ. 12, 175–180.
Ueno, R., Horiguchi, Y., Kubota, S.S., 1988a. Levels of oxolinic acid in cultured yellowtail after oral administration. Nippon Suisan Gakkaishi 54, 479–484.
Ueno, R., Okumura, M., Horiguchi, Y., Kubota, S.S., 1988b. Levels of oxolinic acid in cultured rainbow trout and amago salmon after oral administration. Nippon Suisan Gakkaishi 54, 485–489.
Ueno, R., Uno, K., Aoki, T., 1995. Pharmacokinetics and bioavailability of oxytetracycline in cultured yellowtail Seriola quinquradiata. Dis. Asian Aquacult. 2, 523–531.
Uno, K., Aoki, T., Ueno, R., 1992a. Pharmacokinetic study of oxytetracycline in cultured rainbow trout, amago salmon, and yellowtail. Nippon Suisan Gakkaishi 58, 1151–1156.
Uno, K., Aoki, T., Ueno, R., 1993. Pharmacokinetics of sodium nifurstyrenate in cultured yellowtail after oral administration. Aquaculture 116, 331–339.
Uno, K., Aoki, T., Ueno, R., Maeda, I., 1996. Pharmacokinetics of nalidixic acid and sodium nifurstyrenate in cultured fish following bolus intravascular administration. Fish. Pathol. 31, 191–196.
Wagner, J.G., Nelson, E., 1964. Kinetic analysis of blood levels and urinary excretion in absorptive phase after doses of drug. J. Pharm. Sci. 53, 1392–1403.
Ž .
Yamaoka, K., Nakagawa, T., Uno, T., 1978. Application of Akaike’s information criterion AIC in the evaluation of linear pharmacokinetic equations. J. Pharmacokinet. Biopharm. 6, 165–175.
Ž .
Yamaoka, K., Tanigawara, Y., Nakagawa, Y., Uno, T., 1981. A pharmacokinetics analysis program MULTI for microcomputer. J. Pharmacol. Dyn. 4, 879–885.
Yamaoka, K., Tanigawara, Y., 1983. Statistical moments. Pharmacokinetics Using Personal Computer. Nankoh-doh Press, Tokyo, pp. 113–139.
Yoshitake, A., Kawahara, K., Shono, F., Izawa, A., Komatsu, T., Yamamori, K., 1978a. Absorption, distribution and excretion of14C-AB-206 in animals. Chemotherapy 26, 77–82.
Yoshitake, A., Kawahara, K., Shono, F., Izawa, A., Komatsu, T., Yamamori, K., 1978b. Metabolism of 14
C-AB-206 in animals. Chemotherapy 26, 83–90.
Yoshitake, A., Kawahara, K., Shono, F., Izawa, A., Komatsu, T., 1978c. Metabolism of AB-206 in human. Chemotherapy 26, 96–99.
Yoshitake, A., Kawahara, K., Shono, F., 1979. Metabolism of14C-miloxacin in rat metabolites in urine, bile and faces. Radioisotopes 28, 21–25.