Hydrology of inland brackishwater shrimp
ponds in Chachoengsao, Thailand
Robert O. Braaten
a,*, Mark Flaherty
baLand and Water Sciences Di
6ision,Bureau of Rural Sciences,Agriculture, Fisheries and Forestry — Australia,PO Box E11,Kingston,ACT 2604, Australia bDepartment of Geography,Uni
6ersity of Victoria,PO Box3050,Victoria,BC, Canada V8W 3P5 Received 9 December 1999; accepted 30 May 2000
Abstract
This study focuses on a new trend in shrimp aquaculture, the development of brackishwa-ter ponds for Penaeus monodon culture in inland freshwater areas of Thailand’s Central Plain. Water balances were calculated for ponds and reservoirs at an inland shrimp farm in Chachoengsao, Thailand, between May and July 1999. Regulated inflow and outflow were the largest water fluxes, averaging 0.94 and 0.70 cm/day. Other daily average water gains were rainfall (0.52 cm/day) and runoff (1.7 cm/day), and other water losses were evaporation (0.31 cm/day) and seepage (0.52 cm/day). Over an entire crop cycle, of average length 109 days, average water inputs were: initial pond filling (84 cm); regulated inflow (103 cm); rainfall (57 cm); and runoff (3 cm). Average outputs were: regulated outflow (76 cm); seepage (57 cm); evaporation (34 cm); and draining at harvest (87 cm). The main feature of note in the water balance is the large volume of regulated outflow. All regulated outflow and most (82%) of the pondwater drained at harvest went directly to the irrigation canal system. Such large volumes of discharge could have serious environmental implications because small inland waterways have low assimilative capacity and pond effluent is saline. Consumptive water use for 14 inland shrimp ponds and reservoirs averaged 0.8390.14 cm/day. Consump-tive water use was also measured for 11 nearby rice fields, the main land use in the regions where inland shrimp farming is proliferating. Rice paddy water use averaged 0.9190.17 cm/day. There was no significant difference in the daily consumptive water use of shrimp ponds and rice fields, suggesting that conversion from rice farming to shrimp farming would have little net impact on water availability for irrigation. © 2000 Elsevier Science B.V. All rights reserved.
www.elsevier.nl/locate/aqua-online
* Corresponding author. Tel.: +61-2-62724798; fax:+61-2-62725827.
E-mail address:[email protected] (R.O. Braaten).
296 R.O.Braaten,M.Flaherty/Aquacultural Engineering23 (2000) 295 – 313
Keywords:Shrimp; Aquaculture; Inland; Hydrology; Water balance; Water use
1. Introduction
Thailand is the world’s largest producer of cultured shrimp, earning an estimated USD 1.6 billion in 1998 from exports (Bangkok Post, 1998). Historically, the development of shrimp farming has been concentrated in a narrow band of land along Thailand’s coast. Newly developed low-salinity methods for farming black tiger shrimp (Penaeus monodon), however, have facilitated the rapid expansion of marine shrimp farming away from the coast into the freshwater areas of Thailand’s Central Plain. By 1998, it was estimated that as much as 40% of Thailand’s cultured shrimp production came from 22 455 ha of inland shrimp farms (Department of Fisheries, 1998; Limsuwam and Chanratchakool, 1998). The emergence of this new form of shrimp farming has raised concerns about the potential impacts on agricultural land and rural water resources (Flaherty and Vandergeest, 1998; Musig and Boonom, 1998; Fegan, 1999; Miller et al., 1999). The main concerns relate to the dynamics of water flows on the shrimp farms. Unlike coastal shrimp farms, inland farms withdraw large volumes of freshwater from rice irrigation canals. In the absence of restrictions on water use, the high consumptive rates of shrimp farms could stress the freshwater irrigation system. It is also feared that seepage and discharge of pondwater could carry salt and waste products into irrigation water and onto neighboring agricultural land. While crude estimates of inland shrimp farm water consumption rates and possible environmental impacts are available (Tookwinas, 1997; Flaherty et al., 1999), detailed assessments are lacking.
be useful both for assessing the need for greater regulation of the industry, as well as for identifying ways of making intensive shrimp culture techniques more environmentally friendly. This paper presents insights from a case study of the hydrology of an inland shrimp farm in Chachoengsao Province, in Thailand’s Central Plain region.
2. Site description
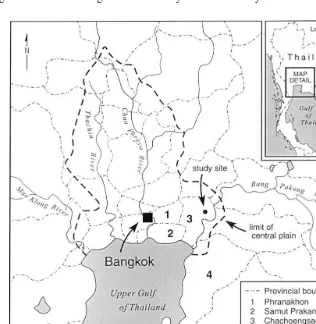
Thailand’s Central Plain (Fig. 1) is the richest and most extensive rice-producing area in the country. The plain is located in the tropical savannah climatic zone, with a distinct dry season from November to April and a wet or monsoon season from May to November. High temperatures and high humidity persist year round. The region is agriculturally fertile with rich clay soils and an extensive man-made irrigation network dating back over 100 years. Historically free access to irrigation
298 R.O.Braaten,M.Flaherty/Aquacultural Engineering23 (2000) 295 – 313
water has favored the development of water-intensive agriculture in the area (Poapongsakorn et al., 1998). Irrigated rice is the most widespread crop, followed by fruit orchards and field crops such as tomatoes and corn. The development of low salinity shrimp culture techniques, coupled with the high farm gate price of shrimp relative to rice, however, have provided strong incentives for rice farmers to convert paddy land to shrimp ponds.
The province of Chachoengsao has experienced some of the most extensive development of inland shrimp farms in the Central Plain. Thailand’s Department of Fisheries (1998) estimates that Chachoengsao Province contains 5000 shrimp farms, covering 8400 ha. During the dry season saline water intrudes up the Bang Pakong River from the Gulf of Thailand, which makes the irrigation canal water progres-sively brackish. The ephemeral brackishwater supply has encouraged the concen-trated development of intensive shrimp farming along the river in excess of 100 km from the coast. Most shrimp farms stock brackishwater in reservoirs during the dry season. During the wet season, brackishwater from the reservoirs is mixed in the shrimp ponds with freshwater from irrigation canals to grow shrimp at salinity levels ranging from about half seawater (15 ppt) to as low as 1 ppt. If necessary, growout pond salinity may also be augmented using bagged salt or trucked in hypersaline water.
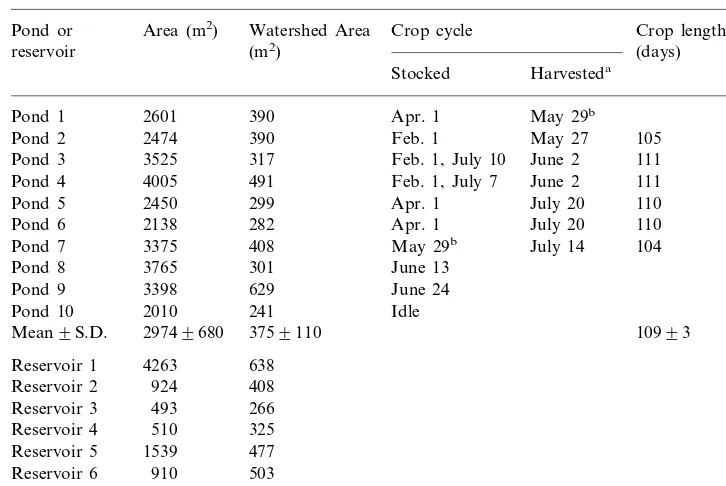
The study site is located about 45 km from the coast and 1 km from the Bang Pakong River (Fig. 1). It is very typical of the small-scale shrimp farming operations that dominate Thailand’s shrimp farming industry. It consists of ten culture ponds ranging in area from 2010 to 4263 m2 and six reservoirs with areas from 493 to 4263 m2 (Table 1). Total pond area is 2.6 ha and total reservoir area is 0.9 ha. The study farm is one of the older ones in the area, having been in operation for about ten years. The ponds and reservoirs were constructed using heavy machinery and consist of packed earthen banks and bottoms. Ponds and reservoirs are about 1.3 m in depth, but are rarely filled higher than 1 m to avoid overflow during heavy rainfall. The banks of the ponds and reservoirs are angled an average of 40° from vertical. Most ponds contain underwater gates connecting them to adjacent reservoirs and the canal. Shrimp growout cycles are staggered so that no more than three ponds are at the same crop stage (Table 1). Water input to the ponds is accomplished using screw pumps driven by diesel motors. Water output is done either with the same pumps or by opening gates in the pond banks and allowing the water to flow out into a canal or reservoir under gravity flow.
3. Methods
Table 1
Characteristics of the shrimp ponds and reservoirs at the study site
Crop cycle Crop length
Area (m2) Watershed Area
Pond or
Pond 8 3765 301 June 13
3398 June 24
aWhere no harvest date is shown, harvest occurred after the end of the field season. bOn May 29th, the shrimp from Pond 1 were shifted to Pond 7.
DDepth=Rainfall+Runoff+Inflow−Evaporation−Outflow−Seepage
−Overflow (1)
whereDDepth is the change in pond depth, inflow and outflow are the farmer-con-trolled water exchange fluxes and all fluxes are expressed in depth units (cm).
On the first visit, pond and reservoir lengths and widths were measured using a tape measure and bank angles were measured using a hand-held level. Watershed areas around each pond and reservoir were measured using a measuring tape (Table 1). Also on this visit, staff gauges were installed in each pond and reservoir. Because rice farming is the most widespread land use in the study area, and most shrimp ponds are constructed in former rice paddies, staff gauges were also installed in 11 nearby rice fields so as to facilitate a comparison of water consumption rates between rice fields and shrimp ponds. A class A evaporation pan filled with brackish pond water and a standard inverted funnel rain gauge were placed on a bund between two ponds in the open sun.
300 R.O.Braaten,M.Flaherty/Aquacultural Engineering23 (2000) 295 – 313
a precision of 90.5 mm. Pan evaporation was converted to pond evaporation using a pan coefficient of 0.81. This coefficient is the annual average of a series of monthly pan coefficients developed by Boyd (1985) in a study comparing pan evaporation to directly measured evaporation from an aquaculture pond in Alabama.
Regulated inflow and outflow, because they occurred intermittently and through a variety of methods (i.e. different pumps, draining through different sized gates), were difficult to measure directly. Instead, these water exchange fluxes were estimated from several other information sources. These included direct observation of water being pumped or drained through pond gates, changes in pond depth not explained by other water fluxes, changes in pond salinity not explained by other water fluxes, placement of water pumps, placement of barriers used to open and close pond pond/reservoir gates, and communication with the farmer. The accuracy of the regulated water exchange data is estimated to be in the range of 91 to 95 cm per water exchange event.
Runoff was estimated using the approach developed by the United States Soil Conservation Society (1982). This approach assigns the watershed a runoff curve based on the watershed soil type and land cover. The runoff curve relates the depth of a rainfall event to a corresponding depth of runoff from the watershed. The study site had packed clay soils with sparse vegetative cover. A runoff curve of 90, corresponding to soil group D (clay soils with low infiltration) and poor vegetation-pasture land cover, was used to estimate the depth of runoff. Depth of runoff was combined with watershed and pond water surface area to compute the change in pond depth due to runoff for each rainfall event. Pond watersheds consisted mainly of the bunds between ponds and reservoirs and the area of the pond banks that was not submerged. Because the pond banks were angled, this area was dependent on the depth of the ponds. For ponds and reservoirs whose water depth varied by more than 25% over the field season, watershed areas were adjusted using basic geometry to reflect changes in depth. Where depths varied by less than 25%, changes in watershed area were not sufficient to substantially alter runoff.
Seepage was computed from the other fluxes in Eq. (1) through the process of elimination (Boyd, 1984). Because of the relatively low accuracy of regulated water exchange estimates (95 cm), seepage was computed only for visits with no water exchange, i.e.:
Seepage=DDepth−Rainfall−Runoff
+Evaporation (Inflow=Outflow=0) (2)
4. Results
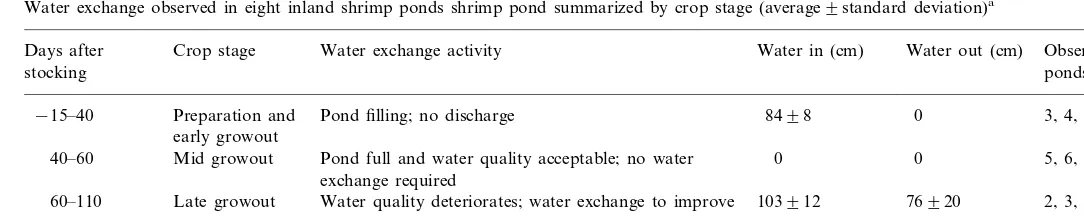
Regulated inflow and outflow refer to the amount of water that is added to or discharged from a shrimp pond through the direct actions of the farmer. Water exchange observations in the nine culture ponds in operation during the field season revealed a consistent pattern in water exchange over the crop cycle, summarized in Table 2. The flux values shown are the averages of all ponds observed at the given crop stage. During the 2 weeks prior to stocking, water was pumped into the ponds to fill them. This filling continued until about 40 days after stocking when water depth reached about 1 m. Over this period there was no regulated water outflow. From about day 40 to day 60 after stocking, no water outflow occurred as waste products had not yet built up to a point where water quality was affected. In the ponds observed at this stage, high rainfall compensated for losses due to seepage and evaporation and regulated water inflow was not needed. Had rainfall not been sufficient to maintain pond levels, small amounts of regulated inflow would have been used at this stage to compensate for seepage and evaporation losses. Around day 60, water quality in the ponds began to deteriorate due to the build up of shrimp waste and uneaten feed. Between this time and harvest, water was ex-changed at an increasingly rapid rate to improve water quality. At harvest, on about day 110, the entire volume of the ponds was discharged.
All regulated inflow to the shrimp ponds came from adjacent reservoirs. Reser-voir water was preferable to canal water as a pond input because suspended sediment had been allowed to settle out and because there was less chance of disease being imported to the ponds from other nearby farms. All regulated water outputs during shrimp growout were discharged directly into the local canal system. Because the main reason for discharging water during the crop was to improve water quality, the effluent was considered of poor quality and not worth saving for future use. At harvest, all the water remaining in five of the seven ponds observed at harvest was discharged entirely to the canal. All the water from one pond and one third of the water in another was pumped into adjacent reservoirs to retain for future use. The amount of water recycled for future use corresponded to about 18% of the total amount discharged at harvest and 10% of the total amount of water discharged over the field season.
302
R
.
O
.
Braaten
,
M
.
Flaherty
/
Aquacultural
Engineering
23
(2000)
295
–
313
Table 2
Water exchange observed in eight inland shrimp ponds shrimp pond summarized by crop stage (average9standard deviation)a
Days after Crop stage Water exchange activity Water in (cm) Water out (cm) Observed in
stocking ponds
3, 4, 8, 9 Pond filling; no discharge 8498
Preparation and
−15–40 0
early growout
0 0 5, 6, 7 40–60 Mid growout Pond full and water quality acceptable; no water
exchange required
2, 3, 4, 5, 6, 7 103912 76920
60–110 Late growout Water quality deteriorates; water exchange to improve water quality
1, 2, 3, 4, 5, 6, 7 Harvest Entire pond discharged 0 8799
110
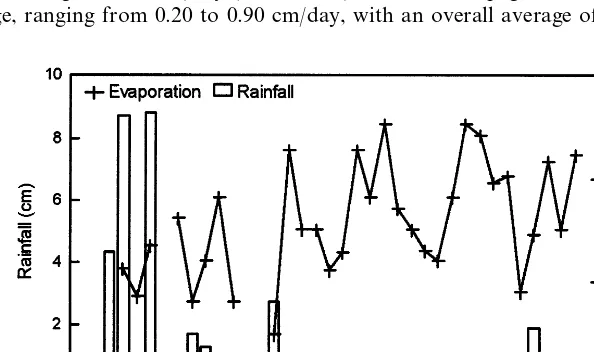
Runoff was a relatively insignificant flux for the nine shrimp ponds, with total water input from runoff over the field season ranging from just 1.1 to 2.5 cm with an average of 1.7 cm (S.D.=0.4). Average daily runoff for the nine ponds was only 0.03 cm (S.D.=0.1). For the six reservoirs, however, runoff was more significant, resulting in a total field season water input as high as 10.1 cm, an average field season runoff of 6.3 cm (S.D.=3.0) and average daily water gain of 0.1 cm (S.D.=0.05). The higher reservoir runoff was caused by the reservoirs being on average smaller than shrimp ponds, but having watersheds of similar size (Table 1). Total field season pond and reservoir evaporation was 20.2 cm. Daily evapora-tion ranged from 0.16 to 0.51 cm/day and averaged of 0.31 cm/day (S.D.=0.10). This is similar to published normal values for May – July potential evaporation in the Central Plain of 0.28 – 0.32 cm/day (Van der Kevie and Yenmanas, 1972). Fig. 2 shows that evaporation increased over the field season, from around 0.3 cm/day in May, to as high as 0.4 or 0.5 cm/day in July. The increase in evaporation was likely related to the reduction in rainfall and hotter and dryer conditions near the end of the field season. Penman’s (Penman, 1956) equation relating potential evaporation to aerodynamic and heat budget information was also used to estimate pond evaporation based on published May – July climatic normals for the Central Plain (Van der Kevie and Yenmanas, 1972; Oldeman and Frere, 1982; Land Development Department, 1993). The Penman Equation produced a slightly higher evaporation estimate of 0.45 cm/day.
Daily seepage rates were computed for eight ponds and six reservoirs. An average of 12 data points per pond and resevoir were unaffected by water exchange, representing 19 days of data per pond and resevoir which could be used to calculate seepage. Average daily pond seepage ranged from 0.23 to 0.69 cm/day, with an overall average of 0.50 cm/day (S.D.=0.18). Reservoir seepage was similar to pond seepage, ranging from 0.20 to 0.90 cm/day, with an overall average of 0.55 cm/day
304 R.O.Braaten,M.Flaherty/Aquacultural Engineering23 (2000) 295 – 313
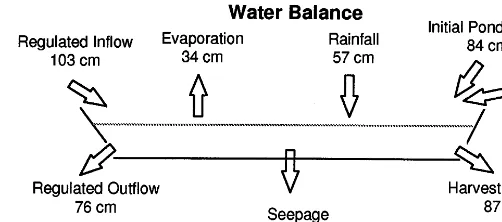
Fig. 3. Estimated water budget for an inland shrimp pond over one crop cycle. Total gains were 247 cm and total losses 254 cm. The difference between total gains and losses was likely caused by using different combinations of ponds to compute each of the regulated water exchange fluxes (Table 2). (S.D.=0.21). The simple arithmetic mean of seepage values for all ponds and reservoirs was 0.52 cm/day with a standard deviation of 0.21 cm/day. The mean weighted by the number of days of data for each pond/reservoir was also 0.52 cm/day. These seepage values are consistent with the published range for ponds constructed in clay soils of 0.125 – 1 cm/day (Coche and Van der Wal, 1981).
5. Discussion
5.1.Water balance
The hydrology data for all observed ponds were combined to produce a composite water budget for a typical growout cycle based on Eq. (1). The average values of regulated water exchange shown in Table 2 were used for regulated inflow and outflow. Average observed daily values of rainfall, runoff, evaporation and seepage from all ponds were extrapolated to the average crop length of 109 days. The resulting water budget is illustrated in Fig. 3. This figure shows that the farmer-controlled water fluxes dominated the water budget. Regulated inflow, regulated outflow, pond filling and pond draining represented 76% of the total water inputs and 64% of the total water outputs respectively. The difference between these two figures is explained by rainfall and runoff additions being outweighed by seepage and evaporative losses. Of the fluxes not controlled by the farmer, rainfall was the main water gain at 57 cm and runoff was a relatively insignificant water gain at only 3 cm. Seepage was higher than evaporation but both were important losses representing 57 and 34 cm of water loss, respectively.
5.2.Representati6eness
of climatic conditions, and when averaged over time should be spatially representa-tive of other farms in the area. Seepage has a climatic component but also varies with soil type and compaction and pond depth. Soil types are relatively homoge-neous in Chachoengsao (Land Development Department, 1993). Pond depths were observed to be similar for other farms in the area and soil compaction should also be similar since most ponds in the area were constructed using heavy equipment. The frequency and volume of pond water exchange depend on the actions of individual shrimp farmers and could vary to a large degree among farms. However, during the site visits, several other farms were observed discharging water from their ponds both during growout and at harvest, suggesting that large amounts of water exchange are common for shrimp farms in the area. Therefore the water balance observed at the study site is likely reasonably representative of other farms in the region.
Because of the distinct seasonality in the tropical savannah climate zone, fluxes that are dependent on climatic conditions would be expected to show some temporal variation. Published pan evaporation data for Bangkok, the closest available station to Chachoengsao, show that average monthly evaporation for the dry season was 9.3 cm compared to 8.3 cm in the wet season (Oldeman and Frere, 1982). These figures suggest that seasonal variation in the shrimp pond evaporative water flux would likely be in the order of only about 10%. Teichert-Coddington et al. (1988) found similar results in their wet and dry season study of fish ponds in Panama where wet season evaporation rates were 86% of those in the dry season. Seepage also has a climatic component due to its dependence on soil moisture and water table levels. It is influenced by the hydraulic gradient and by water temperature, which affects water’s viscosity. Other studies have found that the range of temperatures in aquaculture ponds is insufficient to have a substantial effect on seepage (Boyd, 1982; Green and Boyd, 1995). However, soil moisture and groundwater level fluctuations could cause substantial seasonal influence on seepage rates, especially in the wet season when the soils in the low-lying Central Plain can become saturated and flooding often occurs (Land Development Department, 1993).
306 R.O.Braaten,M.Flaherty/Aquacultural Engineering23 (2000) 295 – 313
5.3.Comparison with other studies
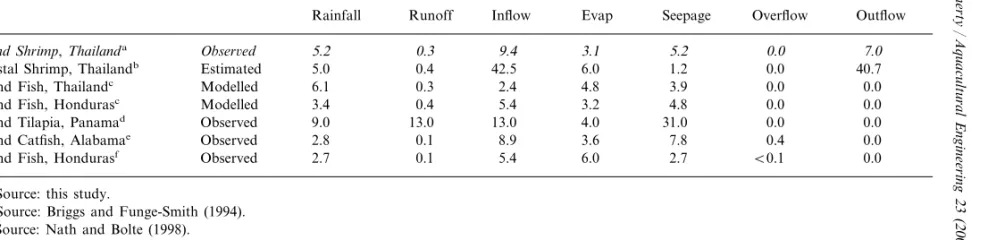
The composite water balance for an inland shrimp pond estimated here is compared to other published studies of pond hydrology in Table 3. Water fluxes shown in this table were computed from the mean flux totals for all ponds reported in the studies divided by the number of days of measurement. Data were converted to the common unit of mm/day to facilitate comparison between studies with different periods of measurement. Inflow and outflow shown in this table do not include initial pond filling or draining at harvest because these activities occur only at the beginning and end of the growout cycle and are not meaningful on a per day basis.
Table 3 shows rainfall to be reasonably similar for all studies, ranging from 2.8 to 9.0 mm/day. Rainfall at the inland shrimp farm was 5.2 mm, near the middle of the range and similar to the other studies in Thailand. Evaporative losses in all studies were similar, ranging from 3.1 to 5.9 mm/day with the value observed in this study at the low end of the range. The lower evaporation observed for the inland shrimp farm may be due to exceptionally high humidity in Thailand’s water-abun-dant inland agricultural areas, a bias in the evaporation pan data used, seasonal differences in the timing of the studies or higher salinity levels retarding evaporation.
Runoff is low in five of the six studies, ranging from 0.1 to 0.4 mm/day, and similar to the 0.3 mm/day observed at the inland shrimp farm. Teichert-Coddington et al. (1988), however, report a much higher runoff figure of 13.0 mm/day for tilapia ponds in Panama. One reason for the large difference in their study is that the observed much larger watershed areas relative to pond water surface area. Another factor could be the methods used to estimate runoff. The studies that reported low runoff rates used the United States Soil Conservation Society’s (United States Soil Conservation Society, 1982) approach while Teichert-Codding-ton et al. (1988) used a different method. In their method, the net combination of monthly runoff gains and seepage losses, termed ‘apparent seepage’, was regressed against monthly rainfall. The y-intercept of the regression equation (i.e. when rainfall is 0) was assumed to represent actual seepage for all months, and the difference between actual seepage and apparent seepage during months with rain was assumed to represent runoff. It is possible that the United States Soil Conservation Society (1982) method, which was developed for larger watersheds and rainfall events than those typically found in aquaculture ponds, underestimates runoff. Alternatively, the Teichert-Coddington et al. (1988) method could overesti-mate runoff by assuming that seepage rates in period of zero rainfall also apply in periods of high rainfall, when increases in soil moisture and groundwater levels could reduce seepage rates.
307
Mean daily water balances observed, estimated and modeled in selected studies of aquaculture ponds, shown with the water balance for the observed inland shrimp ponds (in italics)
Method
Pond type, location Water inputs (mm/day) Water outputs (mm/day)
Seepage Overflow Outflow Rainfall Runoff Inflow Evap
5.2 0.0 7.0 9.4
Inland Shrimp,Thailanda Obser6ed 5.2 0.3 3.1
Estimated 5.0 0.4 6.0 1.2 0.0 40.7 Coastal Shrimp, Thailandb 42.5
Inland Fish, Hondurasc Modelled 3.4
4.0
Observed 9.0 13.0 13.0 31.0 0.0 0.0 Inland Tilapia, Panamad
7.8 0.4 0.0 Inland Catfish, Alabamae Observed 2.8 0.1 8.9 3.6
2.7 B0.1 0.0 6.0
Observed
Inland Fish, Hondurasf 2.7 0.1 5.4
aSource: this study.
bSource: Briggs and Funge-Smith (1994). cSource: Nath and Bolte (1998).
dSource: Teichert-Coddington et al. (1988). eSource: Boyd (1982).
308 R.O.Braaten,M.Flaherty/Aquacultural Engineering23 (2000) 295 – 313
structure and high permeability. These seepage rates were also measured in the dry season when seepage is likely to be at its highest. The very low seepage rate of 1.2 mm/day in the Briggs and Funge-Smith (1994) study was estimated assuming that no seepage occurred from the pond bottoms. Because the pond bottoms were resting on the water table, seepage was calculated for the pond banks only, based on published typical seepage rates. In the remaining five studies, seepage ranged from 2.7 to 7.8 mm/day with the 5.2 mm/day observed in this study lying near in the middle. Overflow water loss was negligible for all studies.
The most remarkable difference between the study site water budget and the other published water budgets in Table 3 is the regulated water exchange. While all ponds required some inflow to make up for a net water loss from the other fluxes, only two of the six studies reported any discharge. The four studies that did not require water discharge focused on inland fish ponds. The lack of water exchange observed in these studies may be related to less-intensive growout systems generally used for fish ponds. In contrast, the two studies in Table 3 that reported discharge focused on shrimp farms. The Briggs and Funge-Smith (1994) study looked at coastal shrimp farms in Thailand and found water inflow and outflow to be around 40 mm/day. This was much higher than at the inland shrimp farm where water exchange averaged about 7 mm/day. Farms on the coast can better afford to have high exchange rates because of the abundant supply of ocean water. In addition, the impacts of high water discharge rates are less serious in coastal areas because of the high assimilative capacity of coastal waters.
The effluent discharge rate observed at the inland shrimp farm, however, has important implications for waste management. Pond effluent not only contains waste products, but is also brackish which is in contrast to the water supply that is fresh for most of the year. Many other users including orchardists and rice farmers, depend on freshwater from the irrigation system for their livelihoods. Measure-ments of salinity in the local canal and neighbouring rice fields and orchards revealed elevated salinity levels related to water exchange during growout. During pond harvests, canal salinity routinely rose above levels which reduce yields of rice and orchard crops for short periods of 1 or 2 days (Braaten, 2000). The substantial seepage term in the inland shrimp pond water budget could also lead to soil and groundwater salinization caused by seepage of saline pondwater.
5.4.Water use
Consumptive water use is water that is converted by a human activity to another part of the hydrologic cycle making it unavailable for other human uses. Consump-tive water use for an aquaculture pond consists of water losses due to evaporation and seepage, and can be calculated from the change in pond depth after all other fluxes in Eq. (1) have been taken into account. That is:
Consumptive Water Use=DDepth−Rainfall
Note that like seepage, consumptive water use was only estimated for days with no water exchange because of the lower accuracy of water exchange estimates.
Consumptive water use was computed for eight ponds and six reservoirs. For ponds, average daily water use ranged from 0.63 to 0.95 cm/day with an overall average of 0.82 cm/day (S.D.=0.12). For reservoirs, the results were similar, ranging from 0.58 to 1.16 cm/day and averaging 0.86 cm (S.D.=0.19). The simple arithmetic mean for all ponds and reservoirs was 0.83 cm/day (S.D.=0.14) and the mean weighted by the number of days of data was similar at 0.82 cm/day. These water use rates are comparable to the 1.16 and 0.87 cm/day observed in catfish ponds in Alabama and fish ponds in Honduras (computed from mean evaporation and seepage rates in Boyd, 1985 and Green and Boyd, 1995), and the 0.71 cm/day estimated for coastal shrimp ponds in Thailand (Briggs and Funge-Smith, 1994). Using the simple arithmetic mean figure of 0.83 cm/day, the total consumptive water use for an average inland shrimp crop, of length 109 days, is 90.5 cm.
Fig. 4 shows daily consumptive water use over the field season, computed as the average of all ponds and reservoirs. Evaporative fluxes are superimposed on this chart to show the relative proportions of water consumption due to evaporation and seepage. It is clear that the majority of consumptive water use occurs through seepage. There does not appear to be any obvious trend in consumptive water use over the field season although there was significant day-to-day variability closely emulating daily changes in evaporation. This short-term variability is expected as evaporation is highly dependent on weather conditions which also fluctuate on a day-to-day basis. Seepage, which is dependent to a large degree on hydraulic head and soil properties, does not show such a large degree of variability, although there is a slight downward trend over the field season. This could be caused by lower average pond depths, and resulting reduced hydraulic head, toward the end of the field season when a greater proportion of the ponds were in the early stages of the growout cycle. It could also be related to the onset of the rainy season and a rising water table, which would also reduce hydraulic head.
The most widespread land use in Chachoengsao and much of the Central Plain area is rice-farming and speculation regarding the freshwater consumption of inland shrimp farms has focused mainly on the impacts on rice paddies (Flaherty et al.,
310 R.O.Braaten,M.Flaherty/Aquacultural Engineering23 (2000) 295 – 313
1999; Miller et al., 1999). Water level measurements taken in 11 rice fields in this study can be used to directly compare the water requirements of inland shrimp farms and rice farms. Consumptive water use for rice fields was calculated using the same methods as for the shrimp ponds in Eq. (3). Runoff for the rice fields was assumed to be negligible because watershed areas were less than 1% of field areas. Consumptive water use for rice fields ranged from 0.54 to 1.16 cm/day, almost exactly the same span as for ponds and reservoirs (0.58 – 1.16 cm/day). The simple arithmetic mean was 0.91 cm/day (S.D.=0.17), only 0.08 cm higher than the equivalent figure for the shrimp ponds and reservoirs. The average weighted by the number of days with data was slightly higher at 0.95 cm/day. Since the average irrigated rice crop in Thailand is 110 – 130 days in length (Greenland, 1998), water use per crop for rice fields would range from about 100.1 to 118.0 cm. This figure is similar to other published figures for consumptive water use of irrigated tropical rice which range from 80 to 125 cm/crop (Jackson, 1989).
A t-test revealed no significant difference between the mean daily consumptive water use of the 11 rice fields and 14 shrimp ponds/reservoirs (P=0.250). Although ponds likely have higher seepage rates due to their greater depth (100 cm versus 30 cm) and consequent higher hydraulic head, rice fields probably have higher evaporation rates related to higher water temperatures. Measurements of shrimp pond and rice field water temperatures on several representative farm visits revealed consistently higher rice field temperatures in both sunny and overcast conditions. Mean shrimp pond temperature at noon was 31.6°C (S.D.=0.9, n=32), while mean rice field temperature at noon was 34.7°C (S.D.=1.8, n=30). A t-test showed a significant difference in the mean temperature of shrimp ponds and rice fields (PB0.001). The lack of difference in the daily consumptive water use of shrimp and rice suggests that converting from one land use to the other is likely to have little effect on water supply.
In addition to daily comparisons, the seasonal dimension of water use can be explored by calculating a shrimp farm’s monthly water requirements, or the amount of water which must be withdrawn from the irrigation system on a monthly basis. Assuming no overflow, the net water requirement of a shrimp pond is:
Net Water Requirement=Consumptive Water Use−Rainfall−Runoff (4)
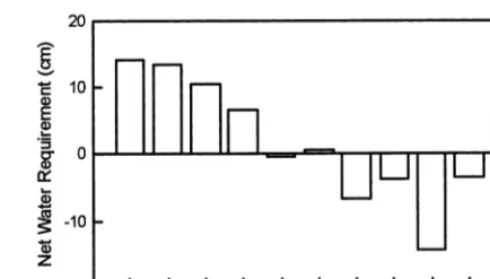
Inland shrimp farms in Thailand typically grow two crops of shrimp per year (Miller et al., 1999). Assuming that the consumptive water use figures computed above apply year round, annual consumptive use is about 181 cm. Since growout periods are staggered year round, this water consumption would be distributed throughout the year at about 15.1 cm/month. Using normal monthly rainfall data for Chachoengsao, and assuming that the proportion of rainfall received as runoff observed in this study (5%) applies year round, net monthly water requirements for inland shrimp farms were plotted in Fig. 5. In this figure, a positive requirement refers to water that must be withdrawn from the irrigation system.
Fig. 5. Net water requirements for inland shrimp farming in the Central Plain by month.
During the dry season water requirements are positive and high, peaking at 14.4 cm/month in December. In the field area, most rice and fruit farmers only withdraw water in the wet season because the canal salinity is too high in the dry season. By contrast, most of the water extraction for shrimp farming falls in the dry season and shrimp farmers actually prefer the salty water. This suggests that little conflict between shrimp and agriculture should occur over water supplies in areas with ephemerally brackish irrigation systems. If water use conflict does occur in these areas in the future, it will likely be among shrimp farmers themselves due to the rapid expansion of shrimp farming in the region. Many farmers also grow shrimp in areas with year round freshwater irrigation, relying exclusively on bagged salt or trucked in hypersaline water for their salt requirements. In these areas, where rice and fruit farmers also use irrigation water in the dry season, there is some potential for conflict between the water-intensive shrimp farms and other forms of water-in-tensive agriculture. However, this study suggests that shrimp farming would be no greater a contributor to water conflict than rice farming.
6. Conclusion
312 R.O.Braaten,M.Flaherty/Aquacultural Engineering23 (2000) 295 – 313
While the impacts of inland shrimp farming on water quality could be serious, the impacts on water quantity are likely to be negligible. Consumptive water use for the inland shrimp ponds was similar to other types of tropical aquaculture ponds. Observations in nearby rice fields found no significant difference in the daily water use of shrimp ponds and rice fields, the main land use in the areas where inland shrimp farming has proliferated, suggesting that conversion from rice farming to shrimp farming would have little impact on irrigation water availability. On a seasonal basis, most of shrimp farming’s water requirements fall in the dry season, when, in areas of brackishwater intrusion, irrigation water is too salty for other users. In these seasonally brackish areas, inland shrimp farming may actually be an efficient use for irrigation water otherwise neglected in the dry season. In year round freshwater areas, shrimp farming would be similar to rice farming in its water requirements and its potential to contribute to water use conflict.
Acknowledgements
Financial support for this study was provided by the Natural Sciences and Engineering Research Council of Canada, the Asia-Pacific Foundation of Canada, and the Centre for Asia-Pacific Initiatives of the University of Victoria. Logistical support was provided by the Department of Aquatic Sciences at Burapha Univer-sity in Bangsaen, Chonburi, Thailand. Sincere thanks are also due to the shrimp farmer and his family who allowed us access to their farm for the duration of the study.
References
Bangkok Post, 1998. Year End Economic Review, 1998.
Boyd, C.E., 1982. Hydrology of small experimental fish ponds at Auburn, Alabama. Trans. Am. Fish. Soc. 111, 638 – 644.
Boyd, C.E., 1984. Water Quality Management for Pond Fish Culture. Elsevier, Amsterdam. Boyd, C.E., 1985. Pond evaporation. Trans. Am. Fish. Soc. 114, 299 – 303.
Braaten, R., 2000. Hydrology and salt dynamics of a brackishwater shrimp farm located in an inland agricultural region of Thailand: implications for the environment. M.Sc. Thesis. Department of Geography, University of Victoria, Victoria, Canada.
Briggs, M.R.P., Funge-Smith, S.J., 1994. A nutrient budget of some intensive marine shrimp ponds in Thailand. Aquacult. Fish. Manag. 25, 789 – 811.
Coche, A.G., Van der Wal, H., 1981. Simple Methods for Aquaculture: Water for Freshwater Fish Culture. FAO Training Series c6. Publications Division, Food and Agriculture Organization, Rome.
Department of Fisheries, 1998. Fisheries statistics. Department of Fisheries, Ministry of Agriculture and Cooperatives. Bangkok, Thailand.
Fegan, D., 1999. An update on inland shrimp farming in Thailand. Global Aquacult. Advocate 2 (3), 14. Flaherty, M., Vandergeest, P., 1998. ‘Low-salt’ shrimp aquaculture in Thailand: good-bye coastline hello
Khon Kaen!. Environ. Manag. 22 (6), 817 – 830.
Green, B.W., Boyd, C.E., 1995. Water budgets for fish ponds in the dry tropics. Aquacult. Eng. 14 (4), 347 – 356.
Greenland, D.J., 1998. The Sustainability of Rice Farming. CAB International and International Rice Research Institute, Manila.
Jackson, I.J., 1989. Climate, Water and Agriculture in the Tropics. Longman Group, Harlow. Land Development Department, 1993. General Soil Map of Thailand. Soil Survey Division, Land
Development Department, Ministry of Agriculture and Cooperatives, Bangkok, Thailand. Limsuwam, C., Chanratchakool, P., 1998. A closed recycle system for sustainable black tiger shrimp
culture in freshwater areas. Paper presented at the Fifth Asian Fisheries Forum: International Conference on Fisheries and Food Security Beyond the Year 2000, November 11 – 14, 1998, Chiang Mai, Thailand.
Lucien-Brun, H., 1997. Evolution of world shrimp production: fisheries and aquaculture. World Aquacult. 28 (4), 36 – 43.
Miller, P., Flaherty, M., Szuster, B., 1999. Inland shrimp farming in Thailand. Aquacult. Asia 4 (1), 27 – 32.
Musig, Y., Boonom, S., 1998. Low salinity culture of Penaeus monodon Fabricius and its effect on the environment. Abstract. Paper presented at the Fifth Asian Fisheries Forum: International Confer-ence on Fisheries and Food Security Beyond the Year 2000, November 11 – 14, 1998, Chiang Mai, Thailand.
Nath, S.S., Bolte, J.P., 1998. A water budget model for pond aquaculture. Aquacult. Eng. 18, 175 – 188. Oldeman, L.R., Frere, M., 1982. A study of the agroclimatology of the humid tropics of south-east Asia. FAO/Unesco/WMO Interagency Project on Agroclimatology. Technical Note No. 179. Secretariat of the World Meteorological Organization, Geneva, Switzerland.
Penman, H.L., 1956. Evaporation: an introductory survey. Neth. J. Agricult. Sci. 4 (1), 9 – 29. Poapongsakorn, N., Ruhs, M., Tangjitwisuth, S., 1998. Thailand’s economic boom and bust, and the
fate of agriculture. Thailand Dev. Res. Inst. Q. Rev. 13 (2), 3 – 14.
Teichert-Coddington, D.R., Stone, N., Phelps, R.P., 1988. Hydrology of fish culture ponds in Gualaca, Panama. Aquacult. Eng. 7, 309 – 320.
Tookwinas, S., 1997. An intensive marine shrimp culture in freshwater area (Suphanburi province): the preliminary investigation on impact assessment. Paper presented at the Asian Shrimp Culture Council Meeting, March 15, 1997, Bangkok.
United States Soil Conservation Society, 1982. Ponds, Planning, Design, Construction. Agriculture Handbook No. 590. Soil Conservation Service, United States Department of Agriculture, Washing-ton DC.
Van der Kevie, W., Yenmanas, B., 1972. Detailed Reconnaissance Soil Survey of Southern Central Plain Area. Report SSR-89. Department of Land Development, Bangkok.