www.elsevier.comrlocaterapplanim
Taste threshold determination and side-preference
ž
/
in captive cockatiels Nymphicus hollandicus
Kevin D. Matson, James R. Millam, Kirk C. Klasing
)Department of Animal Science, UniÕersity of California, One Shields AÕenue, DaÕis, CA 95616, USA
Accepted 1 April 2000
Abstract
Ž .
The taste thresholds of caged cockatiels Nymphicus hollandicus for aqueous solutions of sodium chloride, citric acid, and sucrose were studied using two-choice taste-preference tests. The effects of location on the threshold were tested by putting the flavored solution in either the
Ž .
preferred or non-preferred locations i.e. sides of cages and offering water in the opposite Ž
location. Four parameters total consumption, consumption from preferred side, consumption from .
non-preferred side, and proportion of test solution consumed were measured at the end of 3-day test periods. Experiments were repeated with increasing concentrations of test flavors until intake
Ž .
variables were significantly p-0.05 affected. The results showed that birds distinguished
Ž . y1 y1
p-0.05 between purified water and 0.16 mol l sodium chloride, 0.36 mol l sucrose, or pH 5.5 citric acid. The likelihood of detecting a taste threshold was greater for sodium chloride and citric acid when these solutions were placed on the preferred side. In contrast, sucrose sensitivity was greater when this solution was offered on the non-preferred side.q2000 Elsevier Science B.V. All rights reserved.
Keywords: Cockatiel; Psittacine; Taste; Preference test; Side-preference
1. Introduction
In contrast to mammals, many birds have a poor sense of taste. When the number of taste buds is counted, birds have relatively few as compared to humans or other mammals. For example, while humans have approximately 9000 taste buds, chickens
Ž
have 250–350 taste buds and pigeons, only 37–75 Kare and Mason, 1986; El Boushy et .
al., 1989 . Parrots have between 300 and 400 taste buds; the highest number among the
)Corresponding author. Tel.:q1-530-752-1901; fax:q1-530-752-0175.
Ž .
E-mail address: [email protected] K.C. Klasing .
0168-1591r00r$ - see front matterq2000 Elsevier Science B.V. All rights reserved.
Ž .
Ž .
birds studied Kare and Mason, 1986 . Avian taste buds are found in the oral cavity on
Ž .
the floor of the pharynx and at the base of the tongue El Boushy et al., 1989 . Despite their paucity of taste buds, taste has been demonstrated to be an important factor in determining food acceptance and avoidance for birds. For example, nectarivo-rous birds, such as hummingbirds and sunbirds, can distinguish between different
Ž .
nectars based on sugar composition Lloyd, 1989; Jackson et al., 1998 and
concentra-Ž .
tion Hainsworth and Wolf, 1976 . Additionally, compounds with an offensive taste can be used to repel birds. Application of methyl anthranilate has been used to reduce crop
Ž .
damage caused by birds Cummings et al., 1994 . Also, it has been demonstrated that high levels of secondary plant compounds, which often produce an astringent feeling in
Ž .
the oral cavity, prevent Canada geese Branta canadensis from eating certain plant
Ž .
foodstuffs Buchsbaum et al., 1984 . These same secondary compounds have been proposed to be used as natural chemical repellents to protect crops from damage and
Ž .
loss to herbivorous birds Crocker et al., 1993 . Ž .
Kare and Mason 1986 state that ‘‘research on taste in birds has been handicapped by the general assumption that they live in the human sensory world.’’ Indeed, it is clear
Ž .
that in the case of some chemical compounds such as methyl anthranilate , humans and Ž
birds have very different taste responses to the same compounds Kare and Beauchamp, .
1984; Kare et al., 1957; Cummings et al., 1994 . Despite this, researchers often divide the avian sense of taste into the four classical categories of sweet, salt, sour, and bitter ŽDuncan, 1960; Brindley, 1965; Brindley and Prior, 1968; Gentle, 1972 ..
Apart from the specific appetites for salts or minerals, all taste stimuli are important Ž .
to our understanding of food choice. El Boushy et al. 1989 state that ‘‘the function of taste is to encourage the ingestion of nutrients, to select among feed which is palatable and to avoid those that are toxic.’’ Because many psittacine species are endangered due to poaching and habitat loss, aviculturalists have worked to develop a set of husbandry
Ž .
conditions for captive propagation of psittacines Millam, 1999 . However, little is known about dietary needs of parrots and the role that taste plays in the birds’ food choices. The role of taste as a food choice factor is an important consideration for diet development. The understanding of food choice based on taste is especially crucial to understand when raising birds in captivity that will later be released into the wild. In addition to food choice, the sense of taste is important in determining the role of
Ž .
geophagy in parrots Gilardi et al., 1999 .
Ž .
Cockatiels Nymphicus hollandicus were used as our study organism. These birds are small granivorous psittacines native to Australia and are found throughout most of
Ž .
the country including the hot, arid central region Jones, 1987 . Many vertebrates living Ž
in arid regions similar to the habitat of the cockatiel are salt-deficient Blair-West et al., .
1968 . Additionally, specific appetites for salt are common among these animals ŽBlair-West et al., 1968 . The response of captive cockatiels to a sodium chloride. solution gives some insight on the taste threshold of these desert birds in salt-sufficient situations.
The most common method of testing taste-preferences is a two-bottle test. This test involves dissolving the material in water and presenting each bird with a choice of the
Ž .
consumption of another group of birds offered only water. Because factors such as thirst or dehydration may mask the effects of taste on consumption in one-bottle tests, tests
Ž .
utilizing two bottles better measure taste perception Pfaffmann, 1956 . However, when presenting side-by-side choices the side-preference must be addressed. The issue of side-preference has been dealt with in different ways when designing taste-preference
Ž
experiments for birds Bartholomew and Cade, 1958; Harriman and Fry, 1990; Jackson .
et al., 1998 .
The purpose of these experiments was to determine the most appropriate and statistically powerful method of measuring the taste threshold for sodium chloride,
Ž .
sucrose, and pH citric acid buffer of captive cockatiels. Specifically, attempts to minimize the effects of pre-existing side-preferences were made, and the effects of placing the taste stimulus in either the preferred or non-preferred locations were examined.
2. Materials and methods
Cockatiels used in these experiments were part of the Department of Animal Science’s research and breeding flock at the University of California, Davis. The cockatiels ranged in age from 1- to 18-years-old. Both male and females birds were included in the test group. Cockatiels were individually housed in indoor cages Ž30=30=60 cm . Room temperature was maintained at 23. 8C. Lightrdark cycles were kept constant during each experimental series and were either 9L:15D or 15L:9D, depending on the season. The birds were provided with food and water for ad libitum
Ž
consumption. The diet fed was a pelleted formulation for small psittacines Maintenance .
Crumbles, Roudybush, Cameron Park, CA . During the taste-preference trials, each cage was fitted with two 100-ml capacity water bottles with volume graduations in 1-ml
Ž .
increments Bio-Serve, Frenchtown, NJ . The bottles were installed in the lower, rear corners of the cages on the wall opposite of the food dispenser. Each bottle had a small
Ž .
drinking surface 1.5 cm in diameter . In each cage, the drinking surfaces were 25 cm apart. The water used throughout all experiments was distilled water, which had been
Ž
purified through a Milli-Q Water System a carbon filter, two ion-exchange columns, an
. Ž .
endotoxin filter, and a 0.20-mm ultra-filter Millipore, Boston, MA . Ž
In the present experiments, sucrose C H O , Sigma, St. Louis, MO, catalog12 22 11
. Ž .
aS-8501 , sodium chloride NaCl, Sigma,aS-3014 , quinine hydrochloride and a buffer
Ž . Ž
made of sodium citrate C H Na O6 5 3 7P2H O, Sigma,2 aS-4641 and citric acid C H O ,6 8 7 .
Sigma, aC-0759 were used to represent sweet, salt, bitter, and sour categories, respectively. Sourness was defined as pH and was achieved by varying the pH of a 0.05-mol ly1 citrate buffer system. Because of the extreme sensitivity to quinine
Ž y1. hydrochloride, the threshold was overshot at the first level tested 0.0001 mol l . For this reason, it was excluded from this study, but will be the subject of a future study. All research was approved by the Animal Care and Use Committee at UC Davis.
Ž .
bottles. These data indicated that there was considerable variation among individual birds in the total amount and side-preference of water consumption. Therefore, birds were ranked according to the strength of their preference, as determined by the proportion of consumption from each side. The birds were then assigned to one of three experimental groups in a manner that equally distributed the side-preferences among the groups. The three treatments were: control group that continued to receive water on both sides; lower level taste group that received the taste compound on one side and water on the other; and the higher level taste group that received an incrementally higher level of the taste compound on one side and water on the other. Treatment groups were composed of six to eight birds depending on the period. Excessive consumption during
Ž .
the equilibrium period )80 ml from one side andror )100 ml from both sides was grounds for removing a bird from the experiment.
Consumption from each of the sides during the 3-day experimental period was determined and the results were expressed as: consumption from the preferred side, consumption from the non-preferred side, total consumption and the proportion of
Ž .
consumption on the non-preferred side to total consumption Proportion . A significant shift in one or more of the consumption measures of the test group compared to the
Ž .
same measure of the control water-only group indicated that the birds perceived the taste of the test solution and altered their drinking behavior. An experimental series with progressively increasing concentration of the test compound was conducted for each taste stimulus.
The taste threshold was defined as the minimum concentration of a test compound that resulted in a significant change in the consumption pattern of one or more of the parameters measured. In the first experimental period, the birds were given two concentrations of the test compound thought to be well below their threshold. If these levels did not alter their consumption pattern, the concentrations of the two test treatments were increased. An equilibrium period of 3 days where purified water was on both sides separated each experimental period. These equilibrium periods were used to measure side-preference and reassign the birds to treatment groups as previously described.
Test compounds were first tested on the non-preferred side. The highest concentration Ž that did not significantly impact consumption as well as the threshold concentration as
.
determined with the test compound on the non-preferred side were used as the starting concentrations for an experimental series with the same test compound placed on the preferred side.
The same flock of birds was used for each experimental series. Over the 10-month test period, individuals were exposed to all solutions in the following order: sodium chloride on non-preferred side, sucrose on non-preferred side, sodium chloride on preferred side, sucrose on preferred side, citric acid buffer on non-preferred side, and citric acid buffer on preferred side. The effects of prior exposure of the birds to unrelated chemicals are unknown.
2.1. Data analysis
experimental period were analyzed by One-way ANOVA. Experiments were repeated
Ž .
with increasingly higher concentration or lower pH of the test compound until a
Ž .
treatment was found that was significantly different p-0.05 from the control Žwater-only group for one or more of the recorded parameters. When a p. -0.05 was obtained, differences between individual treatment means were determined by least
Ž .
significant difference LSD . If a treatment mean was significantly different from the control mean by LSD, the experimental series was stopped. In the case that there was a
Ž .
significant ANOVA p-0.05 , but the LSD did not indicate that a treatment mean was significantly different from the control mean, the trial was repeated with the same test solution concentrations or pH. Repeated data sets included sodium chloride on the non-preferred side at concentrations of 0.12, 0.16, 0.18 mol ly1; citric acid buffer on the non-preferred side at pH 5.0; sucrose on the non-preferred side at concentrations of 0.45 and 0.56 mol ly1; and sucrose on the preferred side at 0.36 and 0.45 mol ly1. Data from
Ž . these replicate experiments were analyzed using a general linear model GLM with treatment, repetition, and the treatment–repetition interaction as main effects. In most cases, the effects of both the repetition and the interaction were not significant Žp)0.20 , and the data were pooled and analyzed by One-way ANOVA and LSD.
Ž
means comparisons. In some cases sucrose on preferred side at concentrations of
y1 .
0.36and 0.45 mol l for non-preferred and Proportion parameters , repetition accounted
Ž .
for sufficient variation p-0.20 and was left in the model. In these cases, differences between control and test measures were determined by single degree of freedom contrasts. To compare the effects of different solution concentration within the experi-mental series, the treatment means were standardized by expressing the consumption parameter means of treatment birds as a percentage of the mean of the same parameter of the control birds.
Similar threshold levels were found when the test solutions were placed on the preferred and non-preferred sides so we desired to determine which of these two experimental approaches were most efficacious. Because of variation in the sample size
Ž .
of the treatment groups n and in the standard deviations, the data were analyzed by
Ž .
power statistics using JMP SAS, Cary, NC in order to compare the relative effective-ness of placing the flavor solution on the preferred vs. non-preferred sides. The power was calculated using all data from each side for the threshold concentration or pH. Power calculations resulted in a probability of achieving a ps0.05 for a range of values for n. These calculations used D, the effect size or the separation of the means, and S, the standard deviation of the data set, to determine these probabilities. The more
Ž .
powerful experimental design test compound in preferred or non-preferred side was determined by which had the higher probability of being significant for n ranging from 12 to 52 in increments of 4.
3. Results
3.1. Equilibrium periods
During the equilibrium periods, initial side- preferences were monitored. Preference
Ž . Ž
.
for side two . The preference ratios appeared to be equally distributed between birds both before and after exposure to chemical stimuli. The average preference ratio for the whole flock and within treatment groups was typically near 0.5. While it was not tested, it appeared as if side-preference ratio may relate to the location of the bird in the cage
Ž
battery i.e. birds on the left side of the battery appear to prefer the right water bottle and .
vice-versa
3.2. Experiment 1: sodium chloride
The sensitivity of cockatiels to a salty substance was first tested by placing a sodium chloride solution on the non-preferred side and purified water on the preferred side. The eight test solutions of sodium chloride had concentrations ranging from 0.02 to 0.18 mol
y1 Ž . y1
l Fig. 1a . At 0.12 mol l , none of the consumption parameters differed signifi-cantly from the same parameters of the control group. At 0.16 and 0.18 mol ly1, the
Ž .
consumption from the treatment non-preferred side sodium chloride solution was Ž . significantly less than the consumption from the control non-preferred side water Žps0.004 and 0.016, respectively . Additionally, at both of these levels, the treatment.
Ž
Proportion was also significantly less than control Proportion ps0.003 and 0.021, .
respectively .
For all birds offered the 0.16-mol ly1 sodium chloride solution, the total fluid
Ž .
consumption was significantly less than that of the control ps0.029 . The same trend of a decreasing total consumption occurred for the 0.18-mol ly1 sodium chloride group,
Ž .
but this result was not significant ps0.085 .
Based on the results of Experiment 1a, sodium chloride was placed on the preferred y1 Ž .
side at 0.16 and 0.18 mol l Fig. 1b and purified water was placed on the
y1 Ž
non-preferred side. At 0.18 mol l , the consumption from the preferred side sodium .
chloride solution was significantly less than the consumption from the control preferred Ž . Ž .
side water ps0.011 . Additionally, the consumption from the non-preferred side Žwater was significantly greater than the consumption from the control non-preferred.
Ž . y1 Ž .
side water at 0.18 mol l ps0.018 . Lastly, the Proportion was significantly greater y1 Ž . than the Proportion of the control group at both 0.16 and 0.18 mol l p-0.001 .
Regardless of which side the flavor was placed, the presence of 0.16 mol ly1
sodium chloride significantly changed the drinking patterns when compared to the control patterns. Therefore, the taste threshold for cockatiels is between 0.12 and 0.16 mol ly1. Because the number of birds used and the magnitude of the response varied for these
Ž y1. two experiments, power statistics were applied to the threshold data 0.16 mol l to determine which experimental procedure had the highest probability of achieving
Ž
significance. The three statistically significant parameters consumption from preferred, .
consumption from non-preferred, and Proportion tested indicated that the experimental
Ž .
design was more powerful higher probability of significance when sodium chloride was placed in the preferred bottles.
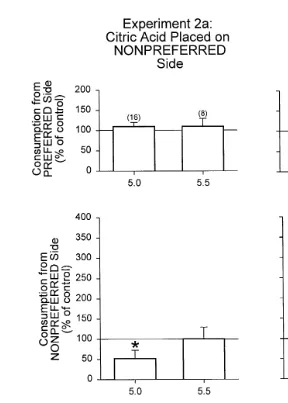
3.3. Experiment 2: citric acid
Fig. 1. Comparison of the effects of different concentrations of sodium chloride placed on previously
Ž . Ž .
established non-preferred a and preferred b sides. The consumption measures of control birds that were provided water on both sides were normalized to 100% and are indicated by the horizontal line at this value.
Ž .
Open bars indicate consumption by treatment groups "SEM expressed as a percentage of the control group. Stars represent significant changes from the control. The numbers in parentheses indicate the sample size.
Ž .
indicated by Gomori 1955 . The solutions were first offered to the birds on the non-preferred side. No significant differences were found between the control group and
Fig. 2. Comparison of the effects of different pH values of a 0.05-mol ly1 citric acid buffer placed on
Ž . Ž .
previously established non-preferred a and preferred b sides. The consumption measures of control birds that were provided water on both sides were normalized to 100% and are indicated by the horizontal line at
Ž .
this value. Open bars indicate consumption by treatment groups "SEM expressed as a percentage of the control group. Stars represent significant changes from the control. The numbers in parentheses indicate the sample size.
Ž . Ž .
5.0, consumption from the non-preferred side ps0.025 and the Proportion ps0.014 were significantly less than the same parameters of the control group.
Next, the buffered citric acid solutions at pH 5.5 and 5.0 were placed on the preferred Ž .
was significantly less than the consumption from the preferred side of the control group. Additionally, the Proportions for pH 5.5 and 5.0 treatment groups were significantly
Ž .
greater than the control group Proportion ps0.001 . Therefore, the taste threshold for 0.05 mol ly1 citric acid buffer is likely to be around pH 5.5.
Fig. 3. Comparison of the effects of different concentrations of sucrose placed on previously established
Ž . Ž .
non-preferred a and preferred b sides. The consumption measures of control birds that were provided water on both sides were normalized to 100% and are indicated by the horizontal line at this value. Open bars
Ž .
Power statistics were also calculated for the citric acid buffer data. The probability of achieving significance for preferred consumption, non-preferred consumption, and Pro-portion was calculated and indicated that the experimental design was more powerful when the test solution was placed on the preferred side than on the non-preferred side.
3.4. Experiment 3: sucrose
Sucrose was used to determine the threshold level of sweetness. Sucrose was first tested on the non-preferred side. Ten concentrations ranging from 0.08 to 0.56 mol ly1
Ž . y1
were tested Fig. 3a . At 0.45 and 0.56 mol l , the consumption from the non-preferred side was significantly less than that of the non-preferred side of the control group Žps0.003 . Additionally, at 0.45 and 0.56 mol l. y1, the Proportion was significantly
Ž .
less than the control Proportion ps0.001 .
When sucrose was placed on the preferred side, only 0.36 and 0.45 mol ly1 were
Ž . y1
tested Fig. 3b . The non-preferred consumption from the 0.36- and 0.45-mol l groups were significantly greater than the non-preferred consumption of the control group Žps0.0217 and p-0.0001, respectively . Also, the non-preferred consumption from. 0.36 mol ly1 was significantly less than the non-preferred consumption from 0.45 mol
y1 Ž . y1
l ps0.0190 . Additionally, the Proportion for the 0.36- and 0.45-mol l groups
Ž .
were significantly less than the control Proportion ps0.0168 and 0.0005, respectively . The sucrose on the preferred side series was the only experimental series in which a
Ž
main effect of repetition was significant. For the two consumption parameters non-pre-.
ferred consumption and Proportion for which repetition was significant, the first
Ž .
repetition was significantly less than the second ps0.0018 and 0.0047, respectively . Again, power statistics were used to determine whether the placement of the sucrose taste stimulus on the preferred or non-preferred sides was more powerful. For the 0.36-mol ly1 treatment data, the three tested consumption parameters were all more readily detected when the solution was placed on the non-preferred side.
Additionally, because of the large number of repetitions using the same birds, the data for sucrose on the non-preferred side was subjected to a test to determine if the birds were habituating to the increasing sucrose concentrations. A GLM was run testing the data for effects from the repetition or from the treatment by repetition interaction. No significant effects were found for any of the consumption measures, indicating that the birds were not habituating to the sucrose solution over time.
4. Discussion
In general, the placement of the solution on preferred or non-preferred sides did not have profound effects on the threshold determination. In the cases of sodium chloride, the same threshold was found regardless of placement. However, small differences were found in the thresholds for the citric acid buffer and the sucrose solution. In the case of the citric acid buffer, a threshold 0.5 pH units higher was determined when the solution was placed on the preferred side. The sucrose threshold was determined to be 0.09 mol ly1 lower when the test solution was offered on the preferred side. Because the sample sizes varied, the effects of test solution placement on threshold were often obscured. To elucidate the effects of side placement, the power statistics were considered. The sodium chloride and citric acid thresholds were more powerfully detected when the test solutions were placed on the preferred side. However, the sucrose threshold was more powerfully detected when the solutions were placed on non-preferred side.
When thinking about the placement of the taste stimuli, it is easy to imagine that one side or the other may provide greater sensitivity. One could hypothesize that attractive
Ž
flavors would be determined with greater sensitivity on one side the non-preferred, for .
example, because an increase in consumption would be easier to demonstrate and that repulsive flavors would be determined with greater sensitivity on the other side. This lack of a clear rationale for placing the test solutions on one specific side led us to test both sides. However, our findings shed little light on where to place the test solutions. Given that direction of change of consumption was similar across taste stimuli, it is somewhat surprising that for one stimulus the non-preferred side is more sensitive, and for the others the preferred side is more sensitive. It is unclear why this pattern emerged. At a concentration of 0.16 mol ly1 sodium chloride, consumption of the test solution was significantly less than the consumption of purified water. Bartholomew and Cade Ž1958 report that house finches. ŽCarpodacus mexicanus significantly reduce their. consumption of a sodium chloride solution of 0.20 mol ly1. The sodium concentration in blood ranges from 0.132 to 0.150 mol ly1 in captive cockatiels and 0.130 to 0.157 mol
y1 Ž .
l in other captive psittacines Lane, 1996; Polo et al., 1998 . The change in the consumption patterns at 0.16 mol ly1 sodium chloride could be linked to plasma chemistry of cockatiels. The best understood gustatory transduction mechanism of sodium chloride is the amiloride-sensitive sodium channel. These channels are, in fact, regulated by the same hormones that are involved with water and salt homeostasis ŽHerness and Gilbertson, 1999 . Thus, these channels offer a possible explanation for the. rejection of hypertonic sodium chloride solutions.
Other birds also alter consumption patterns when offered hypertonic salt solutions.
Ž . Ž
Harriman 1967 notes a strong aversion defined as ‘‘consumption of a test solution at
. y1
half the rate of water’’ to hypertonic sodium chloride solutions starting at 0.20 mol l
Ž . Ž .
for laughing gulls Larus atricilla and herring gulls L. argentatus smithsonianus . Ž .
Based on the same definition of strong aversion, Harriman and Kare 1966 find that
Ž . y1
starlings SturnusÕ. Õulgaris taste 0.15 mol l sodium chloride; herring gulls, 0.20
y1 Ž . y1Ž
mol l ; and purple grackles Quiscalus q. quiscula , 0.50 mol l the next higher level
y1. Ž .
tested after 0.20 mol l . With common ravens CorÕus corax , a significant inverse
Ž
relationship between sodium chloride solution concentration 0.05, 0.10, 0.50, and 1.00
y1. Ž .
y1 Ž . Ž . 1.00 mol l cannot be determined Harriman and Fry, 1990 . Kare et al. 1957 report
Ž y1. that Rhode Island Red-Barred Plymouth Rock crossbreds reject a 2.0% 0.34 mol l
Ž . y1
solution. However, Gentle 1972 reports a significant rejection of only 0.05 mol l sodium chloride vs. distilled water in Brown Leghorns.
Ž . Ž .
Cade 1964 reports that black-rumped waxbills Estrilda troglodytes , zebra finches ŽTaeniopygia guttata castanotis , and budgerigars Melopsittacus undulatus all signifi-. Ž . cantly increase their consumption of a sodium chloride solution at 0.05 mol ly1 . While not found to be significant, a trend of increasing consumption was observed in our study for 0.04 and 0.06 mol ly1 sodium chloride. Throughout our study, the cockatiels were maintained on a salt-sufficient diet with 0.18% Na and 0.27% Cl. The lack of a deficiency of or a specific appetite for sodium or chloride could be reasons we did not observe significant increases in the consumption of sodium chloride.
With the exception of 0.16 mol ly1 sodium chloride on the non-preferred side, placing a novel taste on either the preferred or non-preferred water side did not impact the total fluid consumption. In the case of the one exception, total fluid consumption was significantly lower than the total consumption of the corresponding control group. This was a most unexpected result and because the next higher concentration did not produce a similar significant result, this observation was most likely a statistical anomaly.
Ž q.
The proton H is the principal sour gustatory stimulus, and sour taste reception
Ž .
relies primarily on the proton concentration Settle et al., 1986 . However, responses to the sour tastes of acids and bases also vary depending on the species of birds, the ages of
Ž .
birds, and the types of acids Fuerst and Kare, 1962; El Boushy et al., 1989 . Birds appear to be more sensitive to inorganic acids than to organic acids, and chicks appear to
Ž .
be more sensitive than adults Fuerst and Kare, 1962; El Boushy et al., 1989 . Adult cockatiels in our study were offered buffered citric acid solutions with a constant
Ž y1.
molarity 0.05 mol l but differing pH. Consumption patterns were changed at pH 5.5 when placed on the preferred side and 5.0 when placed on the non-preferred side.
Ž .
Harriman and Fry 1990 find a significant relationship between decreasing pH and decreasing solution acceptance with citric acid for the pH range 4.0 to 1.5 in Common
Ž . Ž . Ž
ravens 1990 . Additionally, chickens Gallus domesticus reject a 2% approximately
y1 . Ž .
0.10 mol l , pH 2.3 or greater aqueous citric acid solution El Boushy et al., 1989 . In Ž
another study, chickens rejected only solutions with a pH less than 2.0 Fuerst and Kare, .
1962 . When compared to these studies, our results, by showing a change in consump-tion at 0.05 mol ly1 and pH 5.5, suggested that the ability to taste organic acids in cockatiels is more acute than that of chickens.
For cockatiels, the consumption of 0.36 mol ly1 sucrose was significantly less than that of purified water for several consumption parameters. A significant inverse relation-ship between sucrose solution concentration and consumption levels results when common ravens are tested for sucrose. A decrease in sucrose consumption does not
y1 Ž .
occur until a 1.00-mol l solution is offered Harriman and Fry, 1990 . Kare and Ž .
Mason 1986 report that parrots and budgerigars, among other birds, choose sugar
Ž . Ž
solutions over water. Harriman and Milner 1969 report that Japanese quail Coturnix
. y1
Ž y1. Ž y1.
prefer a 10% 0.292 mol l and a 5% 0.146 mol l sucrose solution, respectively ŽKare et al., 1957; Gentle, 1972 . However, our data supported the findings that when.
Ž
fed a complete diet, many avian species do not prefer sugar solutions El Boushy et al., .
1989 .
5. Conclusion
In all cases, increasing concentration eventually resulted in decreased, rather than increased, intake. No concentrations were found to be significantly attractive. Possibly, this is due to the novel qualities of the tastes. Before these experiments, birds only had access to deionized water for drinking. When a new, unexpected compound was added at a level that could be tasted, the birds switched to the other side seeking and preferring the familiar water-only option.
In summary, cockatiels can distinguish between water and 0.16 mol ly1
sodium chloride, 0.36 mol ly1 sucrose, or a pH 5.5 citric acid buffer. For citric acid and sodium chloride, the threshold was more powerfully detected when the test solution is placed on the preferred side. The sucrose threshold, however, was more powerfully detected when placed on the non-preferred side. For all tested compounds and concentrations, signifi-cant changes were found only to be repulsive, and not attractive.
Acknowledgements
We thank Tom Roudybush for providing the cockatiel diet and Byron Muller for providing the daily animal care and maintenance. Additionally, we thank Lisa Tell and Liz Koutsos for their editorial comments on the manuscript. This project was supported
Ž .
in part by the Jastro-Shields Graduate Research Award to KDM and by a grant from Ž .
the Morris Animal Foundation to KCK . All experiments were conducted in compliance
Ž .
with the ‘‘Principles of animal care,’’ NIH, publication No. 86-23, revised 1985 , the UC Davis Animal Care and Use Protocol, and state and federal laws.
References
Bartholomew, G.A., Cade, T.J., 1958. Effects of sodium chloride on the water consumption of house finches. Physiol. Zool. 31, 304–310.
Blair-West, J.R., Coghlan, J.P., Denton, D.A., Nelson, J.F., Orchard, E., Scoggins, B.A., Wright, R.D., Myers, K., Junqueira, C.L., 1968. Physiological, morphological, and behavioral adaptation to a sodium deficient environment by wild native Australian and introduced species of animals. Nature 217, 922–928. Brindley, L.D., 1965. Taste discrimination in bobwhite and Japanese quail. Anim. Behav. 13, 507–512. Brindley, L.D., Prior, S., 1968. Effects of age on taste discrimination in the bobwhite quail. Anim. Behav. 16,
304–307.
Buchsbaum, R., Valiela, I., Swain, T., 1984. The role of phenolic compounds and other plant constituents in feeding by Canada geese in a coastal marsh. Oecologia 63, 343–349.
Ž .
Crocker, D.R., Perry, S.M., Wilson, M., Bishop, J.D., Scanlon, C.B., 1993. Repellency of cinnamic acid derivative to captive rock doves. J. Wildl. Manage. 57, 113–122.
Cummings, J.L., Mason, J.R., Otis, D.L., Davis, J.E., Ohashi, T.J., 1994. Evaluation of methiocarb, ziram, and methyl anthranilate as bird repellents applied to dendrobium orchids. Wildl. Soc. Bull. 22, 633–638.
Ž .
Duncan, C.J., 1960. Preference tests and the sense of taste in the feral pigeon Columba liÕia Var Gmelin .
Anim. Behav. 8, 54–60.
El Boushy, A.R., Van der Poel, A.F.B., Verhaart, J.C.J., Kennedy, D.A., 1989. Sensory involvement control
Ž .
feed intake in poultry. Feedstuffs 61 25 , 16–41.
Fuerst, W.F., Kare, M.R., 1962. The influence of pH on fluid tolerance and preferences. Poult. Sci. 41, 71–77.
Ž .
Gentle, M.J., 1972. Taste-preference in the chicken Gallus domesticus L. . Br. Poult. Sci. 13, 141–155. Gilardi, J.D., Duffey, S.S., Munn, C.A., Tell, L.A., 1999. Biochemical functions of geophagy in parrots:
detoxification of dietary toxins and cytoprotective effects. J. Chem. Ecol. 25, 897–922. Gomori, G., 1955. Preparation of buffers for use in enzyme studies. Methods Enzymol. 1, 138–146. Hainsworth, F.R., Wolf, L.L., 1976. Nectar characteristics and food selection by hummingbirds. Oecologia 25,
101–113.
Harriman, A.E., 1967. Laughing gulls offered saline in preference and survival tests. Physiol. Zool. 40, 273–279.
Ž .
Harriman, A.E., Fry, E.G., 1990. Solution acceptance by common ravens CorÕus corax given two-bottle
preference tests. Psychol. Rep. 67, 19–26.
Harriman, A.E., Kare, M.R., 1966. Aversion to saline solutions in starlings, purple grackles, and herring gulls. Physiol. Zool. 39, 123–126.
Ž
Harriman, A.E., Milner, J.S., 1969. Preference for sucrose solutions by Japanese quail Coturnix coturnix
.
japonica in two-bottle drinking tests. Am. Midl. Nat. 81, 575–578.
Herness, M.S., Gilbertson, T.A., 1999. Cellular mechanisms of taste transduction. Annu. Rev. Physiol. 61, 873–900.
Jackson, S., Nicolson, S.W., Lotz, C.N., 1998. Sugar preferences and ‘‘side bias’’ in cape sugarbirds and lesser double-collared sunbirds. Auk 115, 156–165.
Jones, D., 1987. Feeding ecology of the cockatiel, Nymphicus hollandicus, in a grain-growing area. Aust. Wildl. Res. 14, 105–115.
Ž .
Kare, M.R., Beauchamp, G.K., 1984. Taste, smell, and hearing. In: Swenson, M.J. Ed. , Duke’s Physiology of Domestic Animals. Comstock, Ithaca, pp. 742–760.
Ž .
Kare, M.R., Mason, J.R., 1986. The chemical senses in birds. In: Sturkie, P.D. Ed. , Avian Physiology. Springer-Verlag, New York, pp. 59–73.
Kare, M.R., Black, R., Allison, E.G., 1957. The sense of taste in the fowl. Poult. Sci. 36, 129–138. Lane, R.A., 1996. Avian hematology: basic cell identification, white blood cell count determinations, and
Ž .
clinical pathology. In: Rosskopf, W.J., Woerpel, R.W. Eds. , Diseases of Cage and Aviary Birds. Williams and Wilkins, Baltimore, pp. 739–772.
Lloyd, P., 1989. Sucrose concentration preferences of two southern African sunbirds. Ostrich 60, 134–135. Millam, J.R., 1999. Reproductive management of captive parrots. Vet. Clin. North Am.: Exot. Anim. Pract. 2,
93–110.
Pfaffmann, C., 1956. Taste and smell. Annu. Rev. Psychol. 7, 391–408.
Polo, F.J., Peinado, V.I., Viscor, G., Palomegue, J., 1998. Hematologic and plasma chemistry values in captive psittacine birds. Avian Dis. 42, 523–535.