www.elsevier.comrlocateratmos
Meteorological Research Institute MRI , 1-1 Nagamite Tsukuba, Ibaraki 305 Japan
b
GKSS Research Center, D-21502 Geesthacht, Germany
Received 25 September 1997; received in revised form 19 November 1999; accepted 19 November 1999
Abstract
Radiation and particle measurements have been performed with an aircraft in deep cirrus cloud fields near the island of Svalbard. The data of 12 March 1993, when measurements at 10 different levels could be obtained, are used in a comparative study with radiative transfer calculations. In a first analysis, the cirrus cloud field was assumed to be horizontally homogeneous and invariable
Ž .
during the time of measurements frozen properties . Calculations of the up and downward radiative flux densities showed root mean square differences of 9 Wmy2from the measurements.
To estimate the possible effect of changes of the optical properties of cirrus with time, the flux
Ž . Ž .
densities in the upper part 6000–8500 m and the lower part 3000–5500 m of the cirrus cloud
Ž .
were analyzed separately. In these simulations, the optical thickness in the lower upper part was
Ž .
increased decreased by 50%. By this treatment, most of all calculated flux densities were within one standard deviation of the natural variability in each leg. Finally, the effect of inhomogeneities in the cloud field on the solar flux density has been simulated using a Monte Carlo method, since the upper part of the cirrus field has indeed been very inhomogeneous. This paper is a result of a collaborative effort between the MRI in Tsukuba, Japan, and the GKSS in Geesthacht, Germany.
q2000 Elsevier Science B.V. All rights reserved.
Keywords: Cirrus; Particle sampling; Radiation; Arctic clouds; Airborne measurements
)Corresponding author. Fax:q49-4152-872020.
Ž . Ž .
E-mail addresses: [email protected] K. Masuda , [email protected] T. Kobayashi ,
Ž . Ž . Ž . Ž
[email protected] E. Raschke , [email protected] F. Albers , [email protected] W. Koch , [email protected] U.
.
0169-8095r00r$ - see front matterq2000 Elsevier Science B.V. All rights reserved.
Ž .
1. Introduction
High and cold cirrus clouds are possibly responsible for an enhancement of the
Ž .
atmospheric Greenhouse effect as it had be shown already by Hansen et al. 1981 . They further dry the upper troposphere, but they can also heat it by absorption of solar radiation and form an effective shield against cooling to space. Sedimenting ice crystals can also trigger precipitation in lower-layer clouds. Cirrus can also be enhanced by aircraft contrails, although the net effect on the radiation budget components is even
Ž
over specific regions with enhanced air traffic still relatively small e.g., Gierens et al.,
.
1999 . Relatively little is known on cirrus cloud fields over both polar regions and over the tropics due to their difficult accessibility. Therefore, an accurate monitoring and modeling of cirrus clouds and its properties in time and space is essential for climate and weather inventory research. A comprehensive review of the influence of cirrus on
Ž .
weather and climate processes has been given, for instance, by Liou 1986 .
Since 1987, investigations of mid-latitude cirrus clouds in Europe have been
orga-Ž .
nized within the frames of the International Cirrus Experiment ICE and its successor,
Ž . Ž
the EUropean Cloud and Radiation EXperiment EUCREX Raschke et al., 1990,
.
1998 . The opportunity of the experiment ARKTIS 93, which was organized by the Institute for Meteorology in Hamburg and the Alfred-Wegener-Institute for Polar- and Marine Research in Bremerhaven and took place in March 1993 near Island Svalbard
ŽSpitsbergen Archipel , to perform measurements inside of cirrus and also low level.
clouds at high latitudes and over the marginal ice zone.
This campaign, named with the German word ARKTIS 93, has been designed to study energy and momentum exchanges over the Arctic sea ice. It included also a component on the differential heating effects on clouds from below by low amounts of long-wave radiation emerging from cold sea ice and higher long-wave radiation emerg-ing from the warmer open sea. Duremerg-ing this experiment, the solar and thermal radiative fluxes have been measured with Eppley Pyranometers and the cloud microphysics with the known PMS FSSP 100X and OAP-2D2-C particle probes. Some preliminary results
Ž .
and the instrumental performance have been discussed by Albers et al. 1993 , Koch
Ž1996 and Raschke et al. 1998 .. Ž .
The objective of this paper is to compare in more detail the airborne measurements of solar radiation flux densities with results from radiative transfer calculations, which are based on the simultaneous microphysical measurements, and to identify possible error sources to be considered in future experiments.
In Section 2, the microphysical measurements of the campaign ARKTIS 93 are described. The radiation model is outlined in Section 3. The comparisons of calculated and measured values of the solar radiative flux density are provided in Section 4. Some effects of horizontal inhomogeneities in the cloud field on the transfer of solar radiative flux density are described in Section 5.
2. Measurements
Ž .
in Longyearbyen Svalbard , about 120 km away. They originated from two decaying frontal systems arriving in the area from southwest. In both cases, the cirrus cloud field had a geometrical thickness of more than 5 km between about 8.5 and 3 km altitude. It overlaid lower broken stratocumulus. Up to 10 level flights, each about 60 to 100 km long, could be made in a vertically staggered array.
The aircraft, a FALCON 20 jetliner of the DLR in Oberpfaffenhofen, was equipped to measure particles with the probes PMS-FSSP-100X and PMS-OAP-2D2-C, and also with its standard equipment the ambient temperature and humidity and wind fluctua-tions, and also upward and downward, broadband solar and infrared radiation flux densities. The PMS OAP-2D2-C probe is designed to measure particles in the size range from 25 to 800mm. To evaluate its data, we used in this study the methods discussed in
Ž .
Heymsfield and Baumgardner 1985 . In particular, for the calculation of the sampling
Ž .
area we used the ‘‘depth of field’’ formula derived by Knollenberg 1970, 1981 and the
Ž .
‘‘entire-in-method’’ Heymsfield and Baumgardner, 1985 for the determination of the effective array width.
Ž .
In addition, we made use of airspeed corrections Albers, 1989 , to take into account the effect of the electronic response time of the probe, which is important at the high airspeeds of a jetliner. While the nominal size resolution of the 2D-C probe is 25mm at 100 mrs, the resolution in flight direction is decreased to approximately 50 to 70mm because of the high true air speeds in the range of 150 to 180 mrs, which were used during our field campaign. The relative accuracy of 2D-C probes and different
process-Ž .
ing methods were discussed previously e.g., Gayet et al., 1993 .
The PMS FSSP probe measures the forward scattering instrument of light and can detect cloud particles with sizes ranging from 2 to 47 mm with a resolution of 3mm
Žrange 0 . For the probe data analysis, we considered each particle as a ice sphere. This.
is in fact questionable, because we do not know a priori the scattering function of the small cirrus ice particles. On the other hand, there is a lack of data in the size range below that of the 2D-C probe.
Ž . Ž .
Gardiner and Hallet 1985 and Heymsfield et al. 1990 described some of the problems using the FSSP for measurements in ice clouds. They described an artificial enhancement of the particle spectra measured by the FSSP caused by large ice crystals.
Ž .
However, Gayet et al. 1996 indicated that the data of the FSSP may be used if the agreement of the 2D-C and FSSP size distributions is good, which is the case in our study. Anyhow, the FSSP data have to be treated with great care and a large uncertainty is inevitable, but it might be better to use these data than to accept a total lack of information about particles in the small size range. For the radiative transport studies, which are described in the following sections, it was shown that the small ice particles
Ž .
contribute only little to the cloud optical thickness Koch, 1996 .
The synoptic situation on 12 March 1993 was characterized by a lower cyclone west
Ž .
of Iceland with a central pressure of 975 h Pa and a high pressure system 1020 h Pa over North Greenland with a ridge extending from the Spitsbergen archipel towards
Ž .
With respect to the extreme climatic situation, it was of interest to examine the suitability of our instrumentation and method under these conditions. This concerned the
Ž .
functioning of the PMS particle probes OAP-2D2-C and FSSP-100X as well as possible difficulties in solar radiation measurements at low sun elevations. In contrast to former flights in mid-latitude cirrus clouds, the particle probes were exposed from the beginning to low temperatures of abouty208C at ground. All particle probes required careful shielding against electromagnetic noise in the aircraft.
The domes of the radiation instruments were possibly subject to icing. This icing was observed at ground, however, only after the return from the missions. This ice might have formed during the last portion of the descending phase from high altitudes. However, no indication in the data was visible that icing happened also during the flight in cirrus clouds. Otherwise, such an experiment would entirely be in doubt.
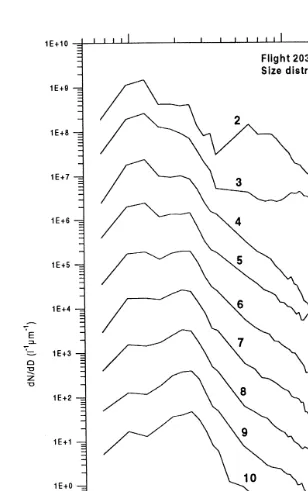
Simultaneously measured leg-averaged particle size spectra from both particle instru-ments could be combined, as shown in Fig. 1, where a bimodal structure can be observed with a systematic shift of the second maximum towards larger particles with decreasing altitude. This shift is smaller in the lowest layers, possibly due to increasing sublimation of the particles. In general, this shift indicates the growth of crystals while
Ž
Fig. 2. Horizontal inhomogeneities of cirrus properties, ice water content, effective radius, and number
. Ž . Ž .
sedimenting downward, but possibly also a reduction of their number density occurs due
Ž .
to instabilities splintering and aggregation . Such time histories of size spectra have
Ž .
been simulated by Zhang et al. 1992 with a rather simple model considering terminal velocities, heating and cooling by radiation and sublimationrevaporation, respectively, and also the effects of large scale lifting of cirrus layers.
The upper parts of the cirrus cloud layer was horizontally quite inhomogeneous as shown in the example in Fig. 2, where the effective radii, as derived from the measurements of the OAP-2D2-C probe alone, are plotted. In the lower layers with relatively higher amounts of diffuse radiation, much smoother radiation fields could be observed.
Below the cirrus cloud layer, some cumuliform clouds were observed, which may also have contained ice particles but will be assumed in this study as water clouds.
3. Radiative transfer model
3.1. Single scattering by non-spherical ice particles
Particles in cirrus are generally non-spherical with a dominant hexagonal base structure. A thorough analysis of holographic images taken in mid-latitude cirrus
ŽKrupp, 1993 show that single column shaped particles dominate the cold upper layers,.
Ž .
whereas the structure becomes more complicated in lower warmer layers.
The single scattering properties of ice crystals have been calculated using a
ray-trac-Ž .
ing technique and assuming hexagonal column shapes, as developed by Macke 1993
Ž .
and with the parameterization given by Mitchell and Arnott 1994 and Takano and Liou
Ž1989 . No preferred orientation of the particles is assumed. We consider here columns.
in only 14 size classes between 7 and 49mm and in 13 size classes from 49 and 1720
mm length of the crystal, where the length has been related to the diameter by the
) b Ž .
relation dsa L with as0.7 and bs1.0 for the smaller crystals L-100mm , and
as0.07 and bs0.5 for the larger ones.
Application of the ray-tracing technique complemented by Fraunhofer diffraction
Ž .
theory, as described by Macke 1993 then provided the scattering functions and coefficients for each size class. The optical thickness of cirrus cloud is derived from the measured number density and projected particle area by averaging along each leg. It should be noted that the optical thickness for scattering of the model cirrus cloud is independent of the wavelength.
3.2. Multiple scattering calculations for a homogeneous layer
Our first analysis uses arithmetic averages over all quantities measured within a specific flight leg. We later discuss also the possible effects of horizontal inhomo-geneities within the cirrus.
The multiple scattering calculations have been made with a modified version of a
Ž .
as shown in Fig. 3. The number of discrete directions in the doubling–adding
calcula-Ž .
tions is 11. The solar spectral data of the World Radiation Center Iqbal, 1983 has been
Ž .
adopted for the solar irradiance at the top of the atmosphere TOA . The atmospheric column has been divided in the vertical into 17 homogeneous layers, where optical thickness for molecular scattering and absorbing constituents such as ozone, water
Ž .
vapor, and oxygen are obtained from LOWTRAN7 code Kneizys et al., 1988 . From the surface to 25 km, the input parameters for LOWTRAN7 were based on the nearest radiosonde data, which was released at 12:00 UT from the German research vessel ‘‘MS Polarstern’’, which has been stationed within the permanent sea ice away from the island, whereas from 25 to 100 km, the standard LOWTRAN7 data for sub-arctic winter model were used. The vertical profile of water vapor has been modified to obtain saturation within the cloud layer.
The ocean surface is simulated by multiple facets whose slopes have an isotropic
Ž .
Gaussian distribution that depends on surface wind speed Cox and Munk, 1953 . Reflection by the ocean surface is considered for the entire wavelength region, but radiation emerging from below the ocean surface at wavelengths larger than 0.6 mm is neglected. The effect of whitecaps on the irradiance is accounted for by taking their reflectance to be 0.45 at all wavelengths. Indeed, most of the upward solar radiation inside of the cirrus cloud field originates from the clouds below it and not from the ocean surface, whose reflectance is about 5% to 8%.
For the water clouds below the cirrus, we used the asymmetry factor and single
Ž .
scattering albedo of model Sc1 by Stephens 1978, 1979 . The phase function of water cloud droplets is approximated by the Henyey–Greenstein function for the lower water
cloud. The values of the asymmetry factor g vary with the wavelength. For example, g is 0.84, 0.80, and 0.78 for the wavelengths of 0.55, 1.05, and 1.89mm, respectively. The measurements showed that the reflectance, defined as the ratio of the upward flux density to the downward flux density, amounted to 0.38 at the lowest leg. To satisfy this
Ž .
condition, the optical thickness tsc of the Sc1 layer is chosen to be 3.8.
Computations are carried out for 85 unequally spaced wavelength bands between 0.3 to 3.0mm. The transmittance functions for absorption by water vapor in each band are obtained by an exponential sum fitting procedure. The absorption by ozone, oxygen and carbon dioxide has been calculated according to the procedure by Braslau and Dave
Ž1973 . The computational accuracy has been compared with the results of a line-by-line.
Ž .
model Masuda et al., 1995 . The relatively small effect of the aerosol scattering and absorption inside the clouds is neglected.
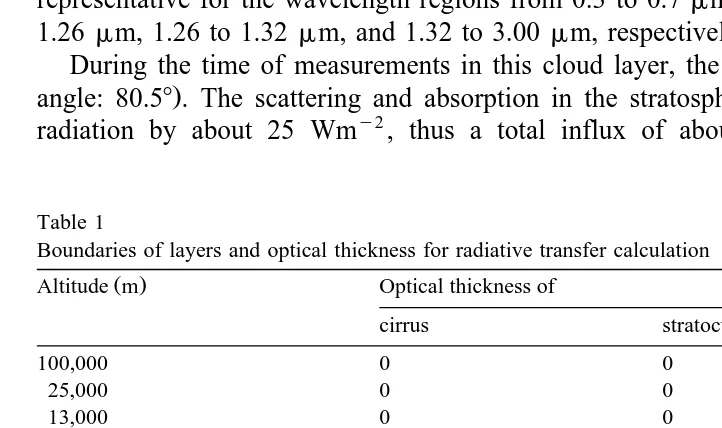
The optical thickness of the cirrus layer was determined from the number density and extinction coefficients of particles. The boundaries of layers and optical thickness of cirrus are shown in Table 1. The total optical thickness for scattering amounts to only 5.58 independent of the wavelength up to 3mm.
In this study, the optical properties of ice crystals have been calculated for five wavelengths of 0.55, 0.77, 1.05, 1.29, and 1.89 mm. These ranges are assumed to be representative for the wavelength regions from 0.3 to 0.7mm, 0.7 to 0.84 mm, 0.84 to 1.26mm, 1.26 to 1.32 mm, and 1.32 to 3.00mm, respectively.
Ž
During the time of measurements in this cloud layer, the sun was very low zenith
.
angle: 80.58. The scattering and absorption in the stratosphere reduce the downward radiation by about 25 Wmy2, thus a total influx of about 195 Wmy2 should be
Table 1
Boundaries of layers and optical thickness for radiative transfer calculation
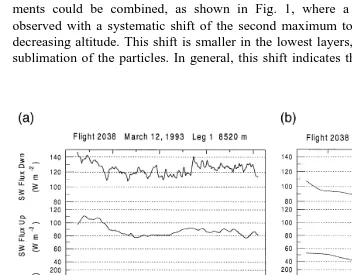
observable at the uppermost flight level at 8520 m altitude, while the observed flux density at this level was only 127 Wmy2. We exclude in our considerations calibration errors, since both pyranometers were calibrated before and after the campaign, but we cannot entirely guarantee their exact performance at high altitudes and high speeds
Žabout 150 to 180 msy1.during their operation. The measurements of up and downward
solar radiation showed a strong variability of about "10 Wmy2 after correction for
small aircraft attitude variations.
To explain further these differences, we assume an additional layer above the highest flight level, since cirrus particles were indeed sampled even at this highest leg, although the experimenters observed by eye mostly cloud free air, and the extinction coefficient at
Ž .
8500 m was estimated as 0.6 Koch, 1996 . It is reasonable to add such an additional cirrus cloud layer above that altitude, where we considered cirrus cloud particles up to an altitude of 10,000 m with the same size distribution as at the second level at 7910 m.
4. Comparison of measured and calculated flux densities
4.1. Effect of an additional cirrus layer aboÕe the highest flight leÕel
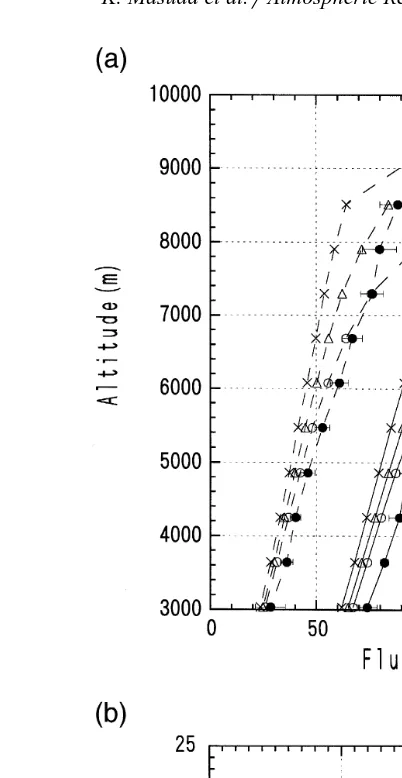
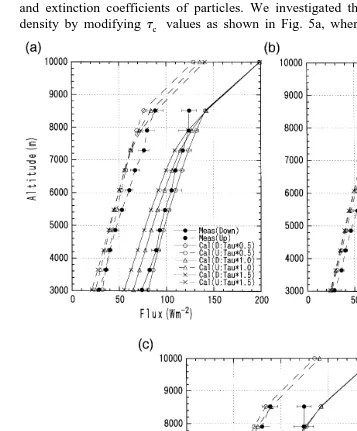
Fig. 4a compares the leg-averaged values of measured and computed upward and downward solar broadband flux densities of the measurements on 12 March 1993. Calculations have been made by changing the optical thickness of the additional layer, denoted byta above the highest leg. In Fig. 4b, the root mean square difference between calculated and measured layer-average values are shown as a function ofta.
The optical thickness of the additional layer should be determined to fit the measured radiation values at the highest flight level. We found a best match for tas0.6. We therefore select the model with this value of ta to investigate the effect of the optical properties of cirrus clouds on the flux density in the following subsections.
4.2. Effect of the background atmosphere
The optical thickness for molecular scattering and absorption has been calculated with the LOWTRAN 7 code based on the radiosonde data at 12:00 UT. No significant difference was obtained when we used the radiosonde data at 06:00 UT instead. The optical thickness of stratospheric aerosol in the visible region of the spectrum is about 0.004 while after the eruption of Mount Pinatubo in 1991, it reached values of up to
Ž .
0.2–0.3 at the Mauna Loa Observatory Dutton et al., 1994 . It dropped to values of
Ž .
about 0.05 21 months after the eruption Dutton et al., 1994 . We included into our calculation stratospheric aerosols composed of spherical droplets of 75% sulfuric acid in water solution. Values of single scattering albedo and asymmetry factor of these
Ž .
particles has been taken from the compilation in WMO 1986 .
Ž . Ž . Ž . Ž
Fig. 4. a Comparison of upward dashed lines and downward solid lines flux density 12 March 1993,
.
10:25–11:50, Location : 778N, 68E for each of the 10 measurement legs. Closed circles: measurements, error bars show the standard deviations. Open circles, triangles, and crosses, respectively, denote the calculation for
Ž . Ž .
the optical thickness of the additional layer ta of 0.0, 0.6, and 1.4. b Root mean square difference of calculation with the measurements as a function of the optical thickness of the additional layer.
than 0.8 and 0.2 Wmy2 at 8500 and 3000 m, respectively. Thus, it is not very important
to include the stratospheric aerosols explicitly in a radiative transfer model, when particular attention is paid only to the radiation inside a cloud layer in the troposphere.
4.3. Effect of optical properties of cirrus cloud
Ž .
The optical thickness of cirrus cloud tc was determined from the number density and extinction coefficients of particles. We investigated the effect of tc on the flux density by modifying tc values as shown in Fig. 5a, where original values of tc are
Ž .
Fig. 5. a The effect of the optical thickness of cirrus cloud on the upward and downward flux density. Open
Ž .
circles: optical thickness of cirrus tc is multiplied by 0.5, triangles: reference model, crosses:tc is multiplied
Ž . Ž . Ž .
by 1.5. b The same as a , but for the effect of the single scattering albedo v0. Open circles: single
Ž .
scattering co-albedo 1yv0 is multiplied by 0.5, triangles: reference model, crosses: single scattering
Ž . Ž .
Ž . Ž .
multiplied by 0.5 open circles and by 1.5 crosses . The downward flux density is influenced by 10–15 Wmy2 with this 50% change oftc. The effect oftc on the upward flux density is smaller than on the downward flux. It is obvious that the reflectance at each level increases with increasing values of tc.
The single scattering properties of cirrus particles have been calculated only for the five wavelength intervals given in Section 3. The absorption by the cloud may be underestimated or overestimated due to this simple treatment. To estimate the effect of
Ž .
the single scattering albedo v0 on the uprdownward flux density in the cirrus cloud,
Ž .
the single scattering co-albedo 1yv0 of cirrus particles, has artificially been
de-Ž . Ž .
creased less absorption or increased more absorption by 50% of its value. The results of this sensitivity study are shown in Fig. 5b by open circles and by crosses, respectively, for smaller and higher absorption. It can be seen that the effect of the change of the single scattering co-albedo by 50% on the uprdownward flux density ranges only between values of 2 and 3 Wmy2.
The shape of the phase function is one of the candidates to alter the flux density in
Ž . Ž
the cirrus cloud. Here, the phase functions are artificially modified, by P Q -y1yc
Ž .. Ž .
PcosQ PP Q where the constant c is assumed to be 0.35. By this modification,
Ž . Ž .
P Q in the forward direction Q-90 decreases while that in the backward direction
ŽQ)90 increases, resulting in a smaller asymmetry factor. The magnitude of the.
decrease of asymmetry factor depends on the shape of the single scattering phase
Ž .
function, P Q . It decreased by 5–11% for the single scattering phase functions used in our calculation. This effect of phase function shapes is shown in Fig. 5c. Difference from the reference model is larger for the downward flux density than for the upward flux density. As expected, the reflectance at each leg increases by this modification.
4.4. Effect of temporal changes of the cloud field structure
In the previous subsections, the cirrus cloud was assumed to be stable during the time of measurements, which extended over a period of about 2 h. A sensitivity study was made for measurement and modeling error for that case. In this section, the flux density
Ž .
is compared separately in the upper part 6000–8500 m and in the lower part
Ž3000–5500 m of the cirrus cloud layer, allowing the change of cloud properties in the.
other part. Fig. 5a suggests, that a decrease oftc shifts the flux density in the lower part closer to the measurements.
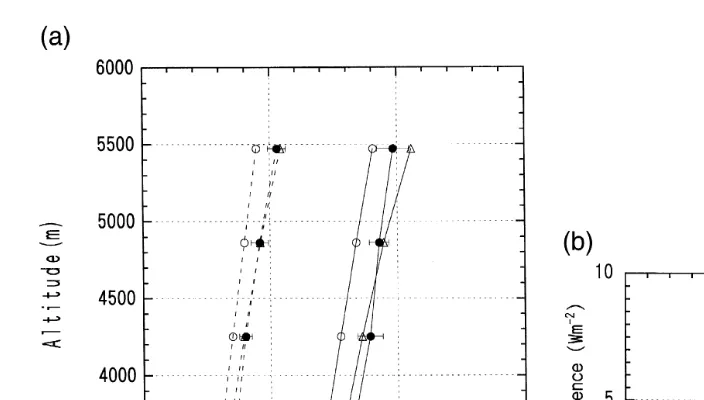
Fig. 6a shows the flux densities in the lower part. Here, values oftc in the upper part as well as ofta are decreased by 50%. Almost all calculated values are now within the error bar. The root mean square difference from the measurements are shown in Fig. 6b
Ž .
as a function of a multiplier fortc upper andta. If the optical thickness in the upper part decreases by 50%, the RMS error in the lower part becomes about 3 Wmy2.
Ž .
However, it is not clear that the decrease in tc upper is true or is it an effective decrease due to the inhomogeneity of cirrus cloud discussed in the next subsection. Similar calculations were done by increasingtc in the lower part as well astsc by 50%. The reflectance at 6000 m was 0.51 for the reference model while it was 0.57 for
Ž .
Ž .
Fig. 6. a The same as Fig.5a, but for the lower part of cirrus layer. Open circles: reference model, triangles:
Ž .
tc at the upper part andta are multiplied by 0.5. b Root mean square difference of calculation with the
Ž .
measurements at the lower part as a function of multiplier fortc upper andta.
the calculated flux density is within the error bars except for the downward flux at 8500 m.
5. Monte Carlo simulations for spatially structured clouds
As can be seen in Fig. 2, the observed cirrus cloud is horizontally very inhomoge-neous along the flight path at 8520 m. Similar inhomogeneities have also been found at all other altitudes.
To investigate the effect of such inhomogeneities on the radiative flux densities, preliminary analyses were made using a Monte Carlo code, with a version of the model
Ž .
described in Kobayashi 1988, 1989 , which includes all cloud–cloud interactions and also the mutual shadowing.
In this method, the distance a photon travels until it interacts with a cloud particle is determined by the volume scattering coefficient. The photon–particle interaction follows
Ž .
The purpose of the Monte Carlo calculation is not to fit the calculated flux density to the measured one, but to investigate the effect of inhomogeneity of cirrus on the flux density. The atmosphere and surface model, therefore, are much simpler. We use here a one-layer cirrus cloud model, where phase functions are vertically averaged considering the optical thickness of each layer. The top and bottom of the cirrus layer are located at 8518 and 3035 m, respectively. Both additional cirrus and stratocumulus layers intro-duced in the previous section are omitted. The atmospheric molecules are also neglected. As mentioned in Section 3, the reflectance at the lowest leg was 0.38. In the broken cloud-surface model, the angular surface reflection is assumed to be Lambertian with an albedo of 0.38.
Two kinds of cloud geometry are considered. The first is a plane-parallel model with
Ž .
an optical thickness tc of 5.58, analogous to the studies above. The other contains clouds of two different optical thicknesses: the thicker cuboidal clouds are arranged on a
Ž .
regular grid surrounded by the thinner clouds Fig. 7 . The fraction of the thicker area is
w Ž . Ž .x
assumed to be 0.5. The optical thickness of thick and thin areas tc thick andtc thin are 11.16 and 0.0 for the type A and 8.37 and 2.79 for the type B, respectively. Average optical thicknesses for both types are the same as for the plane-parallel model. Solar
Ž .
azimuth angles w0 measured from x axis are 08and 458whereas solar zenith angle is fixed to be 80.58.
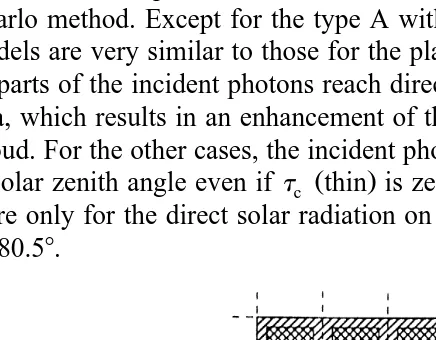
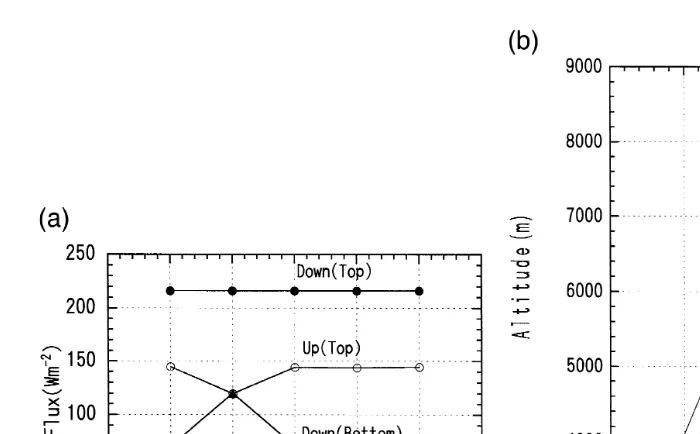
Fig. 8a shows the upward, downward, and absorbed flux densities calculated by the Monte Carlo method. Except for the type A with w0s08, the flux densities for regular array models are very similar to those for the plane-parallel model. For this type A with
w0s08, parts of the incident photons reach directly the bottom of the cloud through the open area, which results in an enhancement of the downward flux density at the bottom of the cloud. For the other cases, the incident photons hit the top or the side of cloud due
Ž .
to large solar zenith angle even iftc thin is zero. It should be noted that the results in Fig. 8a are only for the direct solar radiation on the cloud layer with the incident zenith angle of 80.58.
Ž .
Fig. 8. a Upward, downward, and absorbed flux density for the cirrus cloud model with Lambertian surface calculated by the Monte Carlo method. P–P and Reg denote the plane parallel and regular array models, respectively. For plane-parallel model,tc is 5.58. Fraction of the thick cloud area for regular array model is
Ž . Ž .
0.5.tc thick andtc thin are 11.16 and 0.0 for type A and 8.37 and 2.79 for type B, respectively. Solar
Ž .
zenith angle is 80.58. Solar azimuth angles are measured from x-axis are 08 and 458. b Upward and
Ž .
downward flux density at the top and bottom of the cirrus cloud layer for P–P and Reg A:0 models.
In an actual situation, the diffused photons are also included in the downward radiation at the top of the cloud. By considering the effect of the diffuse radiation, the above results may be changed to some extent. Fig. 8b shows the upward and downward flux density at the top and bottom of the plane-parallel model and the regular array
Ž .
model type A with w0s08. It is seen that the slopes for the regular array model
Ždashed lines are steeper than those for the plane-parallel model solid lines . This trend. Ž .
Ž .
is similar to the case wheretc is decreased by 50% Fig. 5a where the slopes for the
Ž .
decreased optical thickness model open circles in Fig. 5a are steeper than those for the
Ž .
reference model open triangles in Fig. 5a . Thus, the upward and downward flux density for the broken cloud model with the same average optical thickness of plane-parallel model shows similar trend to those for the plane-parallel model with smaller optical thickness.
Radiative transfer calculation using a more realistic multi-layered broken cloud model is necessary to further examine the effect of cloud inhomogeneity on the radiation field.
6. Summary
micro-physics of cirrus cloud with PMS FSSP-100X and OAP-2D2-C particle probes. In this paper, the measured values of the solar radiation flux density are compared with those of radiative transfer calculations, which are based on the microphysical data of 12 March 1993, measured simultaneously.
Ž
First, the cirrus cloud was assumed to be plane-parallel and stable ‘‘frozen
proper-.
ties’’ during about 2-h measurement. Calculation of the upward and downward flux densities showed root mean square differences by 9 Wmy2 from the measurements. It
was not possible to fit the calculated values to the measurements, even if we change optical properties of cirrus cloud such as optical thickness, single scattering albedo and shape of the phase functions.
To simulate possible changes of their optical properties during the time period of
Ž
measurements, the flux density was compared separately in the upper part 6000–8500
. Ž .
m and in the lower part 3000–5500 m of cirrus cloud simulating possible changes of their optical properties during the time period of measurements. This was done by
Ž . Ž .
modifying the optical thickness in the lower upper part by"50% for the upper lower part. Then, most of all calculated flux densities were within one standard deviation error for each leg. Finally, we made preliminary analysis for a broken cloud field by a Monte Carlo method because the measurements show horizontally inhomogeneous structure of the cirrus cloud. It could be shown that the downward flux density may increase by introducing a broken cloud model, resulting in a better agreement with measurements than by a plane-parallel model. Thus, it is desirable to use a more realistic 3-dimensional radiation model for further analyses. This latter study will be continued on the basis of measured cirrus cloud inhomogeneities.
Acknowledgements
This study has partly been supported by the Science and Technology Agency of Japan for K. Masuda and T. Kobayashi. The measurements obtained considerable support by the GKSS Research Center in Geesthacht, the University of Hamburg and the Alfred-Wegener-Institute for Polar Research in Bremerhaven. The pre-analysis, as
Ž .
documented in the thesis by Koch 1996 , obtained support by the GKSS Research Center in Geesthacht, and by an additional grant of the European Union within the frame
Ž .
of the project EUCREX Contract No. EV5V-CT92-0130 .
References
Albers, F., 1989. Flugzeugmessungen der Eiskristallkonzentration und Grossenverteilung mittels optisch¨
abbildender Sonden in Cirrus-Wolken. Master-Thesis. Univ. Koln, 85 pp.¨
Ž .
Albers, F., Koch, W., Raschke, E., 1993. Cirrus studies during ARKTIS’93. In: Brummer, B. Ed. , ARKTIS¨
1993: Report on the field phase with examples of measurements. Berichte aus dem Zentrum fur¨
Meeres-und Klimaforschung. Reihe A: Meteorologie, Meteorologisches Institut der Universitat Hamburg.¨
Braslau, N., Dave, J.V., 1973. Effect of aerosols on the transfer of solar energy through realistic model atmospheres: Part I. Non-absorbing aerosols. J. Appl. Meteorol. 12, 601–615.
Cashwell, E.D., Everett, C.J., 1959. A practical manual an the Monte Carlo method for random walk problems. Pergamon, 153 pp.
Dutton, E.G., Reddy, P., Ryan, S., DeLuisi, J., 1994. Features and effects of aerosol optical depth observed at Mauna Loa, Hawaii: 1982–1992. J. Geophys. Res. 99, 8295–8306.
Gardiner, B.A., Hallet, J., 1985. Degradation of in-cloud forward scattering spectrometer probe measurements in the presence of ice particles. J. Atmos. Oceanic Technol. 2, 171–180.
Gayet, J.-F., Brown, P.R.A., Albers, F., 1993. A comparison of in-cloud measurements obtained with six PMS 2D-C probes. J. Atmos. Oceanic Technol. 10, 180–194.
Gayet, J.-F., Febvre, G., Larsen, H., 1996. The reliability of the PMS FSSP in the presence of small ice crystals. J. Atmos. Oceanic Technol. 13, 1300–1310.
Gierens, K., Sausen, R., Schumann, U., 1999. A diagnostic study of the global distribution of contrails: Part II. Future air traffic scenarios.
Hansen, J., Johnson, D., Lacis, A., Lebedeff, S., Lee, P., Rind, D., Russel, G., 1981. Climate impact of atmospheric carbon dioxide. Science 231, 957–966.
Heymsfield, A.J., Baumgardner, D., 1985. Summary of a workshop on processing 2-D probe data. Bull. Am. Meteorol. Soc. 66, 437–440.
Heymsfield, A.J., Miller, K.M., Spinhirne, J.D., 1990. The 27–28 October 1986 FIRE IFO cirrus case study: cloud microstructure. Mon. Weather Rev. 118, 2313–2328.
Iqbal, M., 1983. An introduction to solar radiation. Academic Press, 390 pp.
Kneizys, F.X., Shettle, E.P., Abreu, L.W., Chetwynd, J.H., Anderson, G.P., Gallery, W.O., Selby, J.E.A., Clough, S.A., 1988. Users guide to LOWTRAN7. Air Force Geophysical Laboratory. AFGL-TR-88-0177, 146 pp.
Knollenberg, R.G., 1970. The optical array: an alternative to scattering or extinction for airborne particle size determination. J. Appl. Meteorol. 9, 86–103.
Ž .
Knollenberg, R.G., 1981. Techniques for probing cloud microstructure. In: Hobbs, P.V., Deepak, A. Eds. , Clouds: Their Formation, Optical Properties, and Effects. Academic Press, pp. 15–91.
Kobayashi, T., 1988. Parameterization of reflectance for broken cloud fields. J. Atmos. Sci. 45, 3034–3045. Kobayashi, T., 1989. Radiative properties of finite cloud fields over a reflecting surface. J. Atmos. Sci. 46,
2208–2214.
Koch, W., 1996. Solarer Strahlungstransport in arktischem Cirrus. PhD Thesis, Univ. Hamburg, and External Report 96rEr60 of GKSS Research Center, Geesthacht, 97 pp.
Krupp, C., 1993. Holographische Messungen an Eiskristallen in Cirruswolken wahrend des Internationalen¨
Ž .
Cirrus Experimentes ICE . Masters Thesis, Inst. For Geoph. and Meteorol. University of Cologne, Germany and External Report 92rE14 of GKSS Research Center in Geesthacht.
Ž .
Liou, K.N., 1986. Influence of cirrus clouds on weather and climate processes: a global perspective review . Mon. Weather Rev. 114, 1167–1199.
Macke, A., 1993. Scattering of light by polyhedral ice crystals. Appl. Opt. 32, 2780–2788.
Masuda, K., Leighton, H.G., Li, Z., 1995. A new parameterization for the determination of solar flux absorbed at the surface from satellite measurements. J. Clim. 8, 1615–1629.
Mitchell, D.L., Arnott, W.P., 1994. A model predicting the evolution of ice particle size spectra and radiative properties of cirrus clouds: Part II. Dependence of absorption and extinction on ice crystal morphology. J. Atmos. Sci. 51, 817–832.
Raschke, E., Flamant, P., Fouquart, Y., Hignett, P., Isaka, H., Jonas, P.R., Sundquist, H., Wendling, P., 1998.
Ž .
Cloud-radiation studies during the European cloud and radiation experiment EUCREX . Surveys in Geophysics 19, 89–138.
Raschke, E., Schmetz, J., Heintzenberg, J., Kandel, R., Saunders, R., 1990. The international cirrus experiment
ŽICE — a joint European effort. ESA Journal 1, 193–199..
Stephens, G.L., 1978. Radiative profiles in extended water clouds: I. Theory. J. Atmos. Sci. 35, 2111–2122. Stephens, G.L., 1979. Optical properties of eight water cloud types, Tech Paper No. 36, CSIRO Division of
Atmospheric Physics, 35 pp.
Takano, Y., Liou, K.-N., 1989. Solar radiative transfer in cirrus clouds: I. Single scattering and optical properties of hexagonal ice crystals. J. Atmos. Sci. 46, 3–19.
WMO, 1986. A preliminary cloudless standard atmosphere for radiation computation, WCP-112, WMOr TD-No. 24, 53 pp.