Nitrogen transformations and balance in
channel catfish ponds
Amit Gross
a, Claude E. Boyd
a,*, C.W. Wood
baDepartment of Fisheries and Allied Aquacultures,Auburn Uni
6ersity,Auburn,AL36849-5419,USA bDepartment of Agronomy and Soils,Auburn Uni
6ersity,Alabama36849-5419,USA Received 29 March 2000; accepted 24 July 2000
Abstract
A nitrogen (N) budget was developed for four, 400-m2 ponds stocked with 550 channel
catfish (Ictalurus punctatus) fingerlings that were fed to satiation daily for 133 days with a ration containing 4.85% N. Feed accounted for 87.9% of the N input to ponds. Abundant N from ammonia (NH3), ammonium (NH4+), and nitrate (NO3−) and the high total N: total
phosphorus ratio in pond waters prevented appreciable biological N2fixation. There were
four main N losses: fish harvest (31.5%); denitrification (17.4%); NH3volatilization (12.5%);
accumulation in bottom soils (22.6%). Nitrification averaged 70 mg N m−2d−1,
denitrifica-tion averaged 38 mg N m−2d−1, and phytoplankton removed NO
3N at 24 mg N m−2
d−1. Mineralization of feed N to NH
3averaged 59 mg N m−2d−1. As feed is the largest
N input in catfish ponds, improved feeds and feeding practices can increase the proportion of N recovered in fish and reduce the amount of NH3excreted by fish. Efficient aeration and
water circulation also should enhance nitrification and oxidation of organic N. © 2000 Elsevier Science B.V. All rights reserved.
Keywords:Channel catfish; Pond aquaculture; Nitrogen cycling; Water quality
www.elsevier.nl/locate/aqua-online
1. Introduction
Nitrogen (N) is important in pond aquaculture because it is a major component of plants and animals and influences productivity. There have been many studies of N dynamics in aquaculture ponds (Hargreaves, 1998). Some of these studies
* Corresponding author. Tel.: +1-334-8444786; fax:+1-334-8445933.
E-mail address:[email protected] (C.E. Boyd).
2 A.Gross et al./Aquacultural Engineering24 (2000) 1 – 14
provided partial or complete N budgets. Avnimelech and Lacher (1979) and Schroeder (1987) estimated N inputs and outputs to aquaculture ponds in Israel, but relatively little information was provided on N dynamics. Boyd (1985), Daniels and Boyd (1989), and Green and Boyd (1995) measured N inputs and outputs of aquaculture ponds, but N dynamics were given brief consideration. Studies by Krom and Neori (1989), Acosta-Nassar et al. (1994), and Briggs and Funge-Smith (1994) also provide estimates of N inputs and outputs to ponds. According to Hargreaves (1998), there is still a need for a more complete under-standing of factors regulating ammonia and nitrite concentrations and exchange of nitrogenous compounds between sediment and water in aquaculture ponds.
The N balance and N dynamics are of interest in channel catfish (Ictalurus punctatus) culture. Channel catfish farming is a large industry in the southeastern United States with a production of about 268 000 tons in 77 000 ha of ponds in 1999 (Anonymous, 2000). Channel catfish are fed a commercial ration and the feed conversion ratio is about 2. Annual production averages 3500 kg ha−1, so
feed use is about 7000 kg ha−1 yr−1.
Catfish feeds contain 25 – 36% crude protein or 4 – 5.8% organic N (ON) (Lov-ell, 1989). About 25 – 30% of N in feed is recovered in fish at harvest, and the rest enters the pond ecosystem (Boyd and Tucker, 1995, 1998). Fertilizers are seldom applied to channel catfish ponds. Nitrogen fixation has not been mea-sured in channel catfish ponds but is not considered important as a N source (Boyd and Tucker, 1998). Thus, feed is the major N input. Fish excrete NH3
through their gills, and bacteria mineralize ON in uneaten feed and feces to NH3.
Ammonia reacts with water to produce ammonium (NH4+) and hydroxyl ions,
and therefore an equilibrium exists between NH3 and NH4+. The sum of NH3
and NH4+ is total ammonia N (TAN). Large additions of feed cause high
con-centrations of TAN in pond water, and NH3 may reach concentrations harmful
to fish. High TAN concentrations in effluents can pollute natural water bodies (Schwartz and Boyd, 1994). The amount of N in pond ecosystems, and poten-tially in effluents, is less than the difference between feed N and fish N. This results because NH3 is volatilized from pond surfaces (Bouldin et al., 1974; Gross
et al., 1999a) and oxidized to nitrate (NO3
−) by nitrifying bacteria. Nitrate is
used as an electron acceptor by denitrifying bacteria and transformed to N gases (N2 and N2O) that diffuse into the atmosphere (Boyd and Tucker, 1998).
Nitro-gen is stored in pond sediment as ON and NH4+, and N compounds are
con-tained in waters that seep from ponds. Although the processes involved in N dynamics of ponds are well known, the relative importance of the different fluxes have not been elucidated clearly.
2. Materials and methods
2.1.Ponds and fish culture
Ponds used in this study are located on the Auburn University Fisheries Research Unit (FRU) about 10 km north of Auburn, Alabama, USA. They are rectangular with vertical concrete walls around edges to assure that no area is less than 40 cm deep when ponds are full. Ponds have a water surface of 400 m2, average depths of
0.80 – 0.90 m, and maximum depths of 1.2 – 1.5 m.
On 30 May 1997, channel catfish averaging 17 g each were stocked at 550 per pond. A floating feed guaranteed by the manufacturer to contain at least 28% crude protein was offered to fish on a satiation basis once daily for 133 days. Ponds were aerated from 00.00 h until 08.00 h with 0.37 kW, vertical pump aerator in each pond. Dissolved oxygen (DO) concentration and water temperature were monitored daily between 06.30 and 08.00 h with a polarographic oxygen meter (Yellow Spring Instrument Co., Yellow Springs, Ohio, USA). The pH of pond water was measured 1 day weekly between 06.30 and 08.00 h and between 17.30 and 19.00 h. The ponds were one treatment in a study on effects of protein concentration in feed on water quality. Soluble reactive phosphorus (SRP), total phosphorus (TP), nitrite nitrogen (NO2N), NO3N, TAN, and TN concentrations in the water column were
measured for the other study and presented by Gross et al. (1999b). Ponds were drained and fish were harvested between 7 and 9 October 1997. Fish were counted, and the total weight of fish per pond was measured.
2.2.Water budgets
A water budget was prepared for each pond (Boyd, 1982). Inflows included water to fill ponds, rainfall into ponds, and additions to maintain water levels. Runoff into ponds was insignificant because watersheds comprise only 50% of pond areas (Boyd, 1982). Outflows included seepage, evaporation, overflow, and water drained at harvest.
Rainfall samples were captured through a large funnel in a plastic bottle. Samples also were collected when water was added to fill ponds or to replace evaporation and seepage, when overflow occurred after rains, and during draining for harvest and analyzed for total N (TN) (Gross and Boyd, 1998).
2.3.Nitrogen gains
4 A.Gross et al./Aquacultural Engineering24 (2000) 1 – 14
Nitrogen fixation was estimated twice a month by the acetylene block method (Capone, 1993). Water column samples (12 ml) were placed in 20 ml, gray, butyl rubber-capped, glass vials and treated with 2.5 ml of acid-washed acetylene. Vials were incubated in ponds, and head space gas was sampled with a syringe after 0, 1, 2, and 4 h. Head space gas was stored in 1-ml sealed vials until analyzed for ethylene with a gas chromatograph (Varian Model Star 3600, Sugarland, Texas, USA) equipped with hydrogen flame ionization detector and a 2-m Porapak N column (Capone, 1993). Courier gas was N2 with a flow rate of 30 ml min−1.
2.4.Nitrogen losses
Three fish collected from each pond at harvest were ground mechanically and mixed aliquots dried at 60°C for moisture analysis. Dried fish was analyzed for TN by the Kjeldahl method (Lovell, 1981).
Pond bottom soil samples were collected with a 5-cm diameter core tube from the upper 5-cm stratum at five points in each pond on 26 May and 5 October. Samples were dried at 60°C, pulverized to pass a 0.25-mm screen, and analyzed for total carbon (TC) and TN with a Leco CHN 600 Analyzer (Leco Corporation, St. Joseph, Minnesota, USA). Aliquots of soil samples also were extracted with 2 M KCl (Keeney and Nelson, 1982), and extracts were analyzed for NO3N by the
NAS reagent method (Gross and Boyd, 1998), for NO2N by the diazotation
method, and for TAN by the phenate procedure (Eaton et al., 1995). Nitrogen accumulation in pond soil between 26 May and 6 October was calculated by the following equation
DSN=(SNf−SNi)
100 (BD)(Vs), (1)
whereDSN=N accumulation in soil (g pond−1
), SNf=TN in soil in October (g
kg−1
), SNi=TN in soil in May (g kg
−1
), BD=soil bulk density (kg m−3
),
Vs=soil volume in upper 5-cm layer (m
3). Bulk density of the top 5-cm soil layer
averages about 300 g cm−3 in ponds on the FRU (Masuda and Boyd, 1994a).
Losses of N in seepage were estimated from the average monthly seepage rate calculated from water budgets and the amount of N in seepage. To estimate the latter, 15 undisturbed, 5-cm diameter×20-cm long bottom soil cores and overlying water were brought to the laboratory and pond water was replaced with a solution containing 10 mg l−1 each of NO
3N and TAN. Gauze sponges were attached to
the bottoms of the cores, and after the original pore water had been replaced by N solution, soil column leachates were collected during five, consecutive 12-h periods. The leachates were filtered and analyzed for NO3N with the NAS reagent method
and for TAN with the phenate method. The percentage of NO3N and TAN that
passed through the soil column was used to calculate NO3N and TAN losses in
seepage as illustrated in the following equation for TAN
STAN=CTAN(s) (A)
X
whereSTAN=TAN lost in seepage (g pond
−1mo−1),
CTAN=TAN concentration
in pond water (g m−3),
X=percentage of TAN lost in seepage (from laboratory study),s=average monthly seepage rate (m mo−1), and A=pond area (m2).
Ammonia losses to the atmosphere by diffusion were measured with oxalic acid traps mounted on rotating weathervane samplers. This effort was part of a separate study on ammonia volatilization, and the methodology and estimates of ammonia losses over time are provided by Gross et al. (1999a).
Denitrification was estimated in situ twice a month by measuring NO3N
disappearance from water confined in tubes within each pond (Capone, 1993). This method assumes that there is no denitrification in the water column at night when DO concentration declines. This assumption was accepted because ponds were aerated at night and DO concentrations below 3 mg/l have seldom been recorded in aerated ponds on the FRU. Pairs of 10-cm diameter PVC pipes were inserted into pond bottoms. One pipe was sealed at the bottom to prevent water from contacting bottom soil. The other pipe had an open bottom to permit contact between soil and water. Sodium nitrate was added to water in the pipes to increase NO3N concentrations by 1.0 mg l−1. Water samples were collected immediately
after and 8 h after NaNO3 introduction for NO3N analysis by the NAS reagent
method. Nitrate-N loss from the pipe with the sealed bottom represented uptake by phytoplankton, and NO3N loss from the pipe with the open bottom resulted from
both denitrification and phytoplankton uptake. The difference in NO3N loss
between the open pipe and the sealed pipe represented denitrification. The percent-age decrease in NO3N concentration during 8 h was multiplied by three to
estimate the loss in 24 h. This allowed estimation of NO3N loss as illustrated
below for denitrification
Nd=(CNO3) (Vp) (m)
X
100, (3)
where Nd=denitrification (g N pond
−1 mo−1), C
NO3=average monthly NO3N
concentration in pond water (g m−3), V
p=pond volume (m
3), X=percentage
decline in NO3N concentration in 24 h, and m=number of days in month. A
similar approach was used to estimate NO3N uptake by phytoplankton.
Nitrification in the water column was measured biweekly. The procedure was based on the difference in DO consumption between pairs of samples in which one was treated with nitrification inhibitor and the other was not (Boyd and Gross, 1999). The amount of DO consumed in nitrification was converted to its N equivalent as follows
Neq=(DOn) N
2O2, (4)
where Neq=N equivalent of DO consumed in nitrification (mg N l
−1 d−1),
DOn=DO consumed by nitrification (mg l−1 d−1), and N and O2=molecular
weights of N and O2. The daily nitrification rate in terms of NO3N produced was
calculated as follows
6 A.Gross et al./Aquacultural Engineering24 (2000) 1 – 14
where Nn=nitrification (g N pond
−1d−1). Values of N
nwere averaged to provide
monthly estimates.
Net mineralization of feed N was estimated from the difference between feed N and in fish N at harvest, ON accumulation in bottom soil, and ON in pond water at draining. The appropriate equation is
M=FN−(RN+ONs+ONw), (6)
where M=net feed N mineralization (g pond−1), FN=feed N (g pond−1),
RN=N recovered in fish (g pond−1), ON
s=ON accumulation in soil (g pond−1),
ONw=ON in water at draining.
2.5.Nitrogen budget
Budgets were prepared for each pond by summing the gains and losses of N. Inputs were fish stock, feed, intentional water additions, rainfall, and N2 fixation.
Losses resulted from fish harvest, outflow, accumulation in soil, seepage, NH3
volatilization, and denitrification. Data for individual ponds were averaged to provide a single N budget.
3. Results and discussion
3.1.Feeds and fish production
An average of 3525 kg ha−1
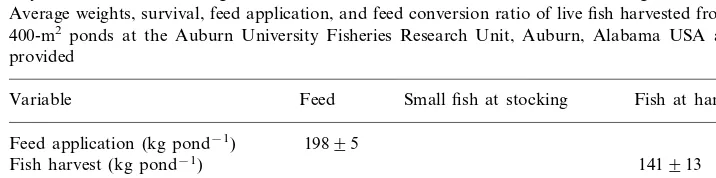
of fish were harvested. Survival averaged 94%, and the mean feed conversion ratio was 1.4. At stocking, small fish contained 21.69 1.4% dry matter and the dry matter was 9.17% N. Harvested fish contained 30.5% dry matter, and N concentration was 7.8% (Table 1).
Table 1
Dry matter and total nitrogen concentrations9SE for channel catfish at stocking and at harvest. Average weights, survival, feed application, and feed conversion ratio of live fish harvested from four, 400-m2 ponds at the Auburn University Fisheries Research Unit, Auburn, Alabama USA also are
provided
Variable Feed Small fish at stocking Fish at harvest Feed application (kg pond−1) 19895
141913 Fish harvest (kg pond−1)
1.490 Feed conversion ratio
9492 Survival (%)
94.390.3 30.590.5
Dry matter (% wet weight) 21.691.4
7.8090.14 9.1790.76
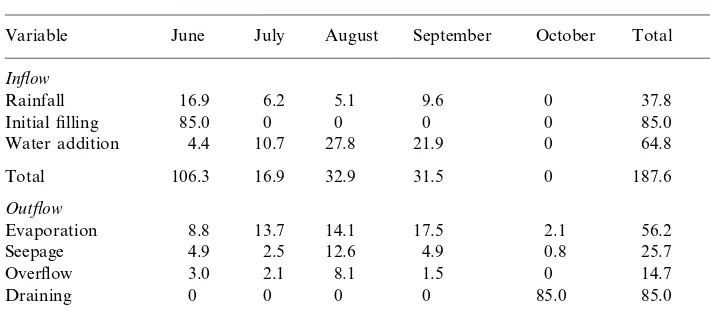
Table 2
Average water budget of four, 400-m2 channel catfish ponds on the Auburn University Fisheries
Research Unit, Auburn, Alabama USAa
August
Variable June July September October Total (%)
Inflow
5.1
Rainfall 16.9 6.2 9.6 0 37.8 20.1
0 0 0
16.7 34.8 23.9 87.9 181.6 100.0
Total
aValues are in centimeters of water depth. 3.2.Water budget
Overflow and seepage averaged 14.7 cm and 25.7 cm, respectively (Table 2). Overflow was 15% and seepage was 27% of water losses. Evaporation was the greatest water loss from ponds. Terms in the water budget were similar in magnitude to those reported by Boyd (1982) and Gross et al. (1998) for ponds on the FRU.
3.3.Nitrogen gains
Feed was 94.3% dry matter and the dry matter contained 4.85% N (Table 1). An average of 198 kg of feed containing 9.1 kg N (average of 171 mg m−2 d−1) was
applied to each pond. Feed accounted for 87.89% of N entering ponds.
Water used to initially fill ponds and rain accounted for 4.65% and 3.67% of N inputs, respectively. Pipe inflow and small fish at stocking accounted for 1.91% and 1.83%, respectively, of the N input (Table 3).
Nitrogen fixation was negligible (Table 3) and measurable only in June when N input in feed was small (:15 g feed N pond−1 d−1). In the laboratory (Jiwyam,
1996) and in fertilized fishponds (El Samara and Olah, 1979; Lin et al., 1988) N2
fixation by symbiotic bacteria and blue-green algae is suppressed by increasing concentrations of TAN. Findlay et al. (1994) and Hendzel et al. (1994) showed that a molar ratio of TN:TP above 13 completely inhibited N2fixation. They suggested
that a low TN:TP ratio causes phytoplankton to become N deficient and gives blue-green algae capable of fixing N2 a competitive advantage over other
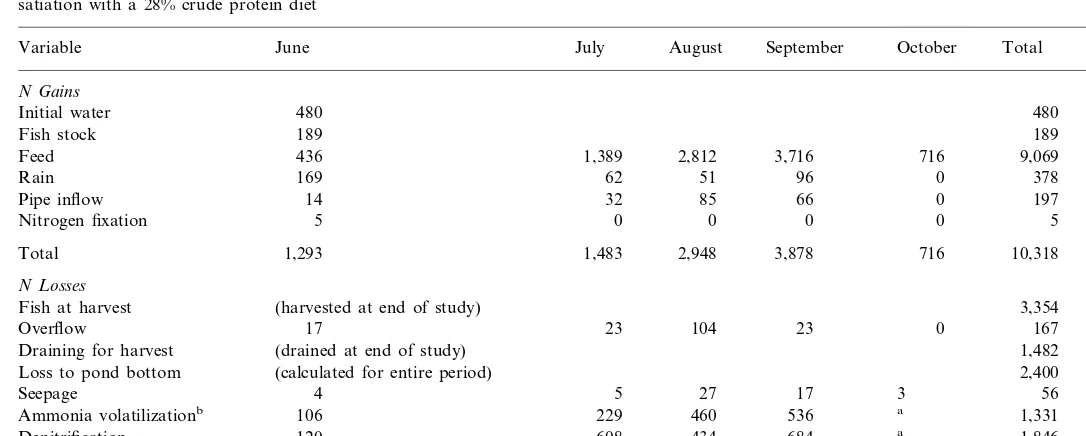
8
A nitrogen budget for channel catfish ponds on the Auburn University Fisheries Research Unit, Auburn, Alabama USA. This budget provides average gains and losses for nitrogen (g pond−1)during a growing season (30 May to 9 October 1997) in four, 400-m2ponds each stocked with 550 fish fed to
satiation with a 28% crude protein diet
September October Total (%)
Total 1,293 1,483 2,948 3,878 716 100.0
N Losses
(harvested at end of study) 3,354 31.53
Fish at harvest
23 0 167 1.57
Overflow 17 23 104
1,482 13.93 Draining for harvest (drained at end of study)
2,400 22.57 Loss to pond bottom (calculated for entire period)
17 3 56 0.53
120 608 434 684 1,846 17.36
Denitrification
1,260 7,239 10,636 100.0
Total 247 865 1,025
aMissing data.
ponds on the FRU usually have abundant populations of blue-green algae capable of fixing N (Boyd, 1990), so a shortage of potential N2 fixing organisms is not a
likely explanation for the lack of N2 fixation in this study.
3.4.Nitrogen losses
An average of 3354 g N pond−1or about 31.53% of the N input from all sources
was recovered in fish at harvest (Table 3). These results agree with reports by Avnimelech and Lacher (1979), Boyd (1985), Green and Boyd (1995) regarding the proportion of feed N recovered in fish at harvest. Nitrogen losses in effluents during overflow and at draining accounted for 1.57 and 13.93% of N losses, respectively, and were equivalent to 41.2 kg N ha−1
(Table 3). Unlike ponds on the FRU that are drained annually at harvest, commercial catfish ponds in the United States are only drained at 6- to 8-year intervals (Boyd and Tucker 1995). Nitrogen losses during pond draining would be much smaller per unit area in commercial ponds than in ponds of this study.
Accumulation of TN in pond soil averaged 2400 g pond−1(46 mg m−2d−1) and
accounted for 22.57% of the N loss (Table 3). Bottom soil N was mainly associated with organic compounds because organic C increased in the soil between May and October and the increase in inorganic N was much less than the increase in TN (Table 5).
Table 4
Average concentrations of total nitrogen (TN) and total phosphorus (TP) and their ratio in channel catfish pondsa
aData are from Gross et al. (1999b).
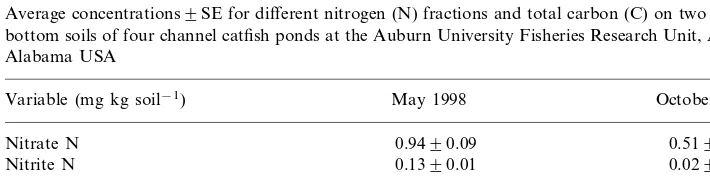
Table 5
10 A.Gross et al./Aquacultural Engineering24 (2000) 1 – 14
Fig. 1. Rates of nitrate production by nitrification, nitrate loss through denitrification, and nitrate uptake by phytoplankton between 2 June and 3 October 1997 in four, 400-m2channel catfish ponds on
the Auburn University Fisheries Research Unit, Auburn, Alabama. Vertical bars represent standard errors.
Table 6
Monthly averages9SE of morning (6.30–8.00 h) and afternoon (17.30–19.00 h) pH, and morning dissolved oxygen (DO) and temperature in four, 400-m2 channel catfish ponds at the Auburn
University Fisheries Research Unit, Auburn, Alabama USA
Afternoon pH DO (mg l−1) Water temperature (°C)
Morning pH
6.890.6
7.390.2 2591.5
June 8.690.4
July 7.490.2 8.890.4 5.090.8 27.191.9 8.790.3
7.490.3 5.290.4 2691.4
August
5.790.4 23.792.5 8.690.4
September 7.090.3
6.090.6 2191.9 October 6.890.5 8.390.3
2.8–7.0 21–29 8.3–10.6
Ranges 6.7–7.5
Denitrification occurred throughout the study (Fig. 1) and the estimated average was 38 mg N m−2 d−1 with individual values up to 80 mg N m−2 d−1. The
estimated N loss through denitrification averaged 1846 g pond−1 or 17.36% of the
N loss (Table 3). Denitrification rate varies with temperature, pH, abundance of denitrifying bacteria, and concentrations of NO3N, organic C, and DO
(Harg-reaves, 1995). Dissolved oxygen concentrations in pond waters were greater than 3 mg l−1
phyto-plankton (Munsiri et al., 1995). Optimal pH for denitrification is between 6 – 8 (Boyd and Tucker, 1998), and the pH of anaerobic sediment in ponds of the FRU is usually between 6 – 7 (Masuda and Boyd, 1994b). The most likely factor influenc-ing denitrification rate was NO3N availability. Concentrations in the water column
were often below 0.2 mg l−1 and seldom exceeded 5 mg l−1(Gross et al., 1999b).
There was little direct input of NO3N to ponds in water sources, and NO3N for
denitrification was probably derived mainly from NO3N produced in nitrification.
Also, Hargreaves (1997) suggests that denitrification rate is closely linked to a supply of NO3N from nitrification in surface layers of sediment. Average
denitrifi-cation rate was highest in July and August when DO concentrations were lowest and water temperatures were highest (Table 6). Denitrification rates in this study (Fig. 1) were within the range commonly encountered in eutrophic aquatic systems (Hargreaves, 1995).
The measured ammonia volatilization averaged 1331 g pond−1
(25 mg m−2
d−1
) and accounted for about 12.51% of N loss from ponds (Table 3). This is equal to 33 kg N/ha and is nearly as great as the amount of N lost in effluents (Table 3). Nitrogen in seepage accounted for about 0.53% of the N loss from ponds. Bottom soils of fishponds are generally compacted and contain about 10 – 30% clay to reduce seepage. Clay particles are negatively charged and can adsorb NH4+ that
is the most abundant form of inorganic N in pond water. Nitrate is negatively charged and subject to leaching because it is not retained on clay particles. Nevertheless, the mean9SE for percentages of NO3N and TAN seeping through
20-cm long bottom soil cores in the laboratory study of seepage were 10.693.8 and 51.098.3. Apparently, NO3N leached less than TAN because it was denitrified by
soil microorganisms.
Despite the rather crude techniques used for estimating N losses through seepage and denitrification, the N budget was fairly accurate because all terms were based on actual measurements of inputs and outputs, and the N gains (10 318 g pond−1)
were approximately equal to N losses (10 636 g pond−1). A previous N budget for
channel catfish ponds (Boyd, 1985), it was assumed that N2 fixation and N
accumulation in soil were negligible. Losses of N via denitrification and NH3
volatilization were estimated by subtracting the sum of all other measured N losses from the measured N inputs. This difference was 6920 g N for 400-m2 ponds and
represented 57.3% of the N loss. In the present study, 22.6% of N loss resulted from accumulation of N in soil, and denitrification and NH3 volatilization combined
accounted for 29.9% of the loss. These three variables account for 52.5% of total N loss which is roughly the same proportion calculated for denitrification plus NH3
volatilization in the earlier study. However, the present study shows that accumula-tion of N in bottom soils, NH3 volatilization and denitrification are all significant
factors in the N dynamics of ponds.
3.5.Ammonia mineralization and nitrification
12 A.Gross et al./Aquacultural Engineering24 (2000) 1 – 14
metabolism and the remainder was effected by microbial activity in the water column and bottom soil. Assuming that all TAN mineralized from feed reached the water, it would equal a daily TAN input of 0.069 mg l−1. The mineralization rate
for feed N was less than the actual rate of N mineralization in the ponds. Phytoplankton is continually turning over, and ON in dead plankton is mineralized to TAN and recycled internally. Also, some of the ON in residual soil organic matter present at the beginning of the study also was mineralized. Thus, nitrifica-tion and other processes removed much TAN from the water or the TAN concentration would have been much greater than observed.
Nitrification was measurable in the water column throughout the study (Fig. 1), and the estimated average was 70 mg N m−2
d−1
. Possibly there was additional nitrification in the surface layer of bottom soil (Hargreaves, 1995; Word, 1996) that was not included. The mineralization rate of TAN from feed was 58.7 mg N m−2
d−1
that is less TAN than needed for the observed rate of nitrification. Additional TAN was available from N recycling within ponds, and concentrations of TAN in pond waters ranged between 0.2 and 2.5 mg l−1 during the study (Gross et al.,
1999b).
Denitrification was estimated to average 38 mg N m−2d−1, and phytoplankton
removed NO3N from pond water at a rate of 24 mg N m−2d−1. In addition, the
concentration of NO3N in pond water at harvest equaled a daily accumulation of
1.5 g N m−2 d−1. Thus, most of the NO
3N produced in nitrification can be
accounted for.
4. Conclusions
A better understanding of the N cycle may lead to practical ways to improve fish growth, pond water quality, and effluent quality. The source of nearly 90% of the nitrogen entering channel catfish ponds is feed. Most of the N applied is lost from the pond water in one of three ways. The largest loss of N (about one-third of the input) is recovered in fish at harvest. Improved fish feeds and efficient feeding practices can increase N recovery in fish (Boyd and Tucker, 1995). These practices also will potentially improve pond water and effluent quality. About 30% of the N was lost by diffusion to the atmosphere through denitrification and NH3
volatiliza-tion, and about 23% of the N was incorporated into the bottom soil. Use of mechanical aeration and water circulation can enhance the rate of nitrification and convert potentially toxic NH3 to NO3 and enhance losses of N by providing more
NO3 for denitrification. Aeration and water circulation also should favor NH3 loss
References
Acosta-Nassar, M.V., Morell, J.M., Corredor, J.E., 1994. The nitrogen budget of a tropical semi-inten-sive freshwater fish culture pond. J. World Aquac. Soc. 25, 261 – 270.
Anonymous, 2000. Status of world aquaculture 2000. Aquaculture Magazine Buyer’s Guide and Industry Directory 29, 6 – 42.
Avnimelech, Y., Lacher, M., 1979. A tentative nutrient balance for intensive fishponds. Bamidgeh 31, 3 – 8.
Bouldin, D.R., Johnson, R.L., Burda, C., Kao, C.W., 1974. Losses of inorganic nitrogen from aquatic systems. J. Environ. Quality 3, 107 – 114.
Boyd, C.E., 1982. Hydrology of small experimental fishponds at Auburn Alabama. Trans. Am. Fish. Soc. 111, 638 – 644.
Boyd, C.E., 1985. Chemical budgets for channel catfish ponds. Trans. Am. Fish. Soc. 114, 291 – 298. Boyd, C.E., 1990. Water Quality in Ponds for Aquaculture. Alabama Agricultural Experiment Station,
Auburn University, AL, p. 482.
Boyd, C.E., Gross, A., 1998. Use of probiotics for improving soil and water quality in aquaculture ponds. In: Flegel, T.W. (Ed.), Advances in Shrimp Biotechnology. 5th Asian Fisheries Forum, Chiangmai, Thailand, pp. 101 – 106.
Boyd, C.E., Gross, A., 1999. Biochemical oxygen demand in channel catfishIctalurus punctatusponds. J. World Aquac. Soc. 30, 349 – 356.
Boyd, C.E., Tucker, C.S., 1995. Sustainability of channel catfish farming. World Aquac. 26, 45 – 53. Boyd, C.E., Tucker, C.S., 1998. Pond Aquaculture Water Quality Management. Kluwer Academic
Publishers, Nowell, MA, p. 700.
Briggs, M.R.P., Funge-Smith, S.J., 1994. A nutrient budget of some intensive marine shrimp ponds in Thailand. Aquac. Fish. Mgt. 25, 789 – 811.
Capone, D.G., 1993. Determination of nitrogenase activity in aquatic samples using the acetylene reduction procedure. In: Kemp, P.F., Sherr, B.F., Sherr, E.B., Cole, J.J. (Eds.), Current Methods in Aquatic Microbial Ecology. Lewis Publishers, New York, NY, pp. 621 – 631.
Daniels, H.V., Boyd, C.E., 1989. Chemical budgets for polyethylene-lined, brackishwater ponds. J. World Aquac. Soc. 20, 53 – 59.
Eaton, A.D., Clesceri, L.S., Greenburg, A.E., 1995. Standard Methods for Examination of Water and Wastewater, 19th ed. American Public Health Association, Washington, DC, p. 1034.
El Samara, M.I., Olah, J., 1979. Significance of nitrogen fixation in fish ponds. Aquaculture 18, 367 – 372.
Findlay, D.L., Hecky, R.E., Hendze, L.L., Stainton, M.P., Regehr, G.W., 1994. Relationship between N2-fixation and heterocyst abundance and its relevance to the nitrogen budget of lake 227. Can. J.
Fish. Aquatic Sci. 51, 2254 – 2266.
Green, B.W., Boyd, C.E., 1995. Chemical budgets for organically fertilized fish ponds in the dry tropics. J. World Aquac. Soc. 26, 284 – 294.
Gross, A., Boyd, C.E., 1998. A digestion procedure for the simultaneous determination of total nitrogen and total phosphorus in pond water. J. World Aquac. Soc. 29, 300 – 303.
Gross, A., Boyd, C.E., Wood, C.W., 1999a. Ammonia volatilization from freshwater fish ponds. J. Environ. Quality 28, 793 – 797.
Gross, A., Boyd, C.E., Lovell, R.T., 1999b. Effects of feed protein concentrations and feeding rate combinations on quality of pond water and effluent in channel catfish culture. Bamidgeh 51, 47 – 57. Gross, A., Boyd, C.E., Lovell, R.T., Eya, J., 1998. Phosphorus budgets for channel catfish ponds
receiving diets with different phosphorus concentrations. J. World Aquac. Soc. 29, 31 – 39. Hargreaves, J.A., 1995. Nitrogen biochemistry of aquaculture pond sediments. Ph.D. dissertation.
Louisiana State University, LA.
Hargreaves, J.A., 1997. A simulation of ammonia dynamics in commercial catfish ponds in the southeastern United States. Aquac. Eng. 16, 27 – 43.
14 A.Gross et al./Aquacultural Engineering24 (2000) 1 – 14
Hendzel, L.L., Hecky, R.E., Findlay, D.L., 1994. Recent changes of N2-fixation in lake 227 in response
to reduction of the N:P loading ratio. Can. J. Fish. Aquatic Sci. 51, 2247 – 2253.
Jiwyam, W., 1996. Nitrogen fixation of blue-green algae and its nutritional value in fish culture, Ph.D. dissertation. Asian Institute of Technology, Bangkok, Thailand.
Keeney, D.R. Nelson, D.W., 1982. Nitrogen – inorganic forms. In: Page et al. (Eds.), Methods of Soil Analysis, Part 2, 2nd ed., Agron. Monogr. 9. ASA, Madison, WI, pp. 643 – 698.
Krom, M.D., Neori, A., 1989. A total nutrient budget for an experimental intensive fishpond with a circularly moving seawater. Aquaculture 83, 345 – 358.
Lin, C.K., Tansakul, V., Aphiapath, C., 1988. Biological nitrogen fixation as a source of nitrogen input in fishponds. In: Pullin, R.S.V., Bhukaswan, T., Tonguthai, K., Maclean, J.L. (Eds.), The Second International Symposium on Tilapia in Aquaculture. ICLARM Conference Proceedings 15. Depart-ment of Fisheries, Bangkok, Thailand, and International Center of Living Aquatic Resources Management, Manila, Philippines, pp. 53 – 58.
Lovell, R.T., 1981. Laboratory Manual for Fish Feed Analysis and Fish Nutrition Studies. Department of Fisheries and Allied Aquacultures, Auburn University, Alabama, p. 65.
Lovell, R.T., 1989. Nutrition and Feeding Fish. Van Nostrand Reinhold, New York, NY, p. 260. Masuda, K., Boyd, C.E., 1994a. Phosphorus fractions in soil and water of aquaculture ponds built on
clayey Ultisols at Auburn, Alabama. J. World Aquac. Soc. 25, 379 – 395.
Masuda, K., Boyd, C.E., 1994b. Chemistry of sediment pore water in aquaculture ponds built on clayey, Ultisols at Auburn, Alabama. J. World Aquac. Soc. 25, 396 – 404.
Munsiri, P., Boyd, C.E., Hajek, B.J., 1995. Physical and chemical characteristics of bottom soil profiles in ponds at Auburn, Alabama, and a proposed method for describing pond soil horizons. J. World Aquac. Soc. 26, 346 – 377.
Schroeder, G.L., 1987. Carbon and nitrogen budgets in manured fish ponds on Israel’s coastal plain. Aquaculture 62, 259 – 279.
Schwartz, M.F., Boyd, C.E., 1994. Channel catfish pond effluents. Prog. Fish-Cult. 56, 273 – 281. Word, B.B., 1996. Nitrification and denitrification: probing the nitrogen cycle in aquatic environments.
Microbial. Ecol. 32, 247 – 261.