Classification of rotifers with machine vision by
shape moment invariants
Chan-Yun Yang, Jui-Jen Chou *
Department of Agricultural Machinery Engineering,National Taiwan Uni6ersity, No.136Chou-Shan Road,Taipei,106Taiwan,ROC
Received 3 April 2000; accepted 25 August 2000
Abstract
An automated system for the identification of rotifers under a microscope with machine vision by shape analysis has been developed, which tends to be substituted for human appraisal. A suitable image recognition algorithm was proposed and the results were discussed in detail. In this study, rotifers were classified into the exact types despite the debris, which appeared from sludge in the degraded water or from rotifer carcasses. Two stages of a discrimination model based on shape analysis were built: one was to separate debris from rotifers, and the other was to classify rotifers into three groups. A set of shape descriptors, including geometry and moment features, was extracted from the images. The set of shape descriptors had to satisfy the RST (rotation, scaling, and translation) invariance. Shape analysis was proved to be an effective approach since the classification accuracy was approx. 92%. The results from different classification approaches were also compared. The machine vision system with shape analysis and the 2-stage discrimination model had a greater effect on the reduction of manpower requirement for the classification of rotifers. © 2000 Elsevier Science B.V. All rights reserved.
Keywords:Rotifer; Classification; Pattern recognition; Shape analysis
www.elsevier.nl/locate/aqua-online
1. Introduction
Rotifer is an excellent first live feed for larval fish because of its small size, slow swimming speed, habit of staying suspended in water, high reproductive rate, and
* Corresponding author. Tel.: +886-2-23635375; fax:+886-2-23627620. E-mail address:[email protected] (J.J. Chou).
possibility for mass production. Rotifer is also valuable for larval fish because of its amino acid composition and high digestibility (Watanabe et al., 1983), it can be enriched with fatty acids and antibiotics, and can be used to transfer these substances into fish larvae (Lubzens et al., 1989).
Estimating the density of rotifers is a general method for assessing and monitor-ing the physiological condition of rotifer cultures (Hoff and Snell, 1997). This assessment depends upon the computation of the number of rotifers and carried eggs. Since rotifers are small, a sample from the culture tank needs to be examined under a microscope, so that the number of rotifers as well as carried eggs can be counted one by one. Although this is important, the counting is time-consuming and labor-intensive (Fulks and Main, 1991). Further, errors might be introduced due to worker’s fatigue and carelessness. Hence, the development of an automatic system to substitute for human counters is required.
Rotifers are similar in shape, except when bearing eggs. Rotifer size has been reported in the range of 123 – 292mm in length and 114 – 199mm in width (Snell and Carrillo, 1984). The body size of rotifers is primarily genetically determined which changes with environmental factors like temperature, salinity, or food type. Rotifers have a repeatedly parthenogenetic life cycle that contains both asexual and sexual phases. The eggs produced from the sexual phase are slightly bigger in size and are more spherical than those from the asexual phase with smooth oval appearance. Sexual eggs are covered with tough shells. The shells protect the eggs from extreme environments (Hoff and Snell, 1997).
The major objective of this study was to develop a system for the rotifer identification using pattern recognition under a microscope. Following the conven-tional operation steps, a shape analysis technique is to be employed to characterize the difference between various types of rotifers and to be substituted for human inspection. A set of features was introduced to make the identification depend only on rotifer’s shape despite its orientation, dimensions, and location. This study concentrated on three types of rotifers: rotifers without egg, rotifers with one egg, and rotifers with two eggs. Functions on the developed system included identifying, counting and then recording the number of rotifers which carried the eggs automatically.
2. Materials and methods
2.1.Sample preparation
to make the microscopic observation easier, the sub-sample was added with 0.05 ml of 1% iodine solution to kill and stain the rotifers. This procedure let the rotifers sprawl under water so that we could examine their eggs clearly. In order to avoid the objects from entanglement, the dense rotifer specimen was diluted repeatedly using 1:1 clean seawater until the objects became separated. The number of rotifers in dense specimens could also be estimated by inverted trace of the dilution operations.
2.2.System description
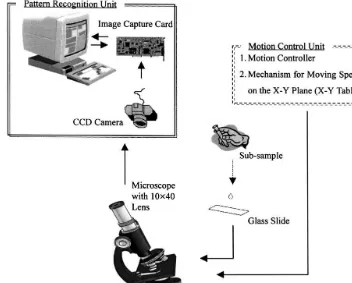
Fig. 1 illustrates the automatic processing system for classifying and counting rotifers. The system consists chiefly of two units: a pattern recognition unit and a motion control unit. A microscope with 40 magnification was necessary for the clear observation of rotifers. The microscope was equipped with a CCD camera to grab the rotifer images. Before starting the automatic system, a slide containing certain sub-sample was carefully placed on a movingX-Ytable. TheX-Ytable of the control unit was designed for moving the slide step by step like moving on certain virtual grids, i.e. it could hold during image processing and move to next grid when the process was finished. The function of the pattern recognition unit was to capture the image of grids and send it to the computer for image processing. After the image processing, the computer sends a signal to activate the motion controller for moving theX-Ytable forward for next process. This paper focuses on the pattern recognition unit which was the most important kernel when the system was designed.
2.3.Image processing
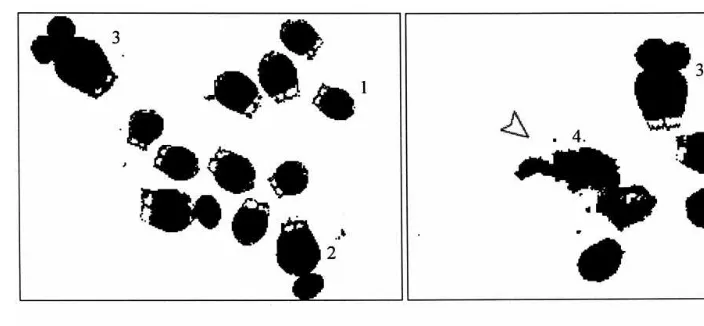
In image segmentation, a region is defined as a group of spatially connected pixels. A region, when properly defined, corresponds to an object. As shown in Fig. 2, proper regions disjointed from one another were screened for the discrimination model. Each region was a candidate for extracting corresponding features for pattern recognition. An essential issue for invariants with the properties of rotation,
Table 1
Samples for testing and verification
Rotifer with Debris
Density estimation Specimen No. Date Feeding
(individuals/ml) carried eggs 2
0 1
SP-1 09/02/99 Tetraselmis chui 203 34 96 36 37
242 75
SP-2 10/02/99 Chaetoceros affinis 375 43 15
Nannochloropsis oculata 35 213 65 66
10/02/99 379
Fig. 1. Main units of the automatic processing system.
scaling, and translation invariance (RST invariance) was introduced as well in this study. The RST invariants indicate that the features of objects are invariant in terms of rotation, scaling, and translation. The extracted features should be RST invariants, because the concerned individuals were classified by their similarity regardless of their orientation, size, or position.
The pilot image processing is drawn schematically in Fig. 3. Since the specimen was brown due to the iodine, the red channel component was more significant than the other two components, both green and blue channels, in the standard RGB color model. The image in the red channel component was acquired and was quantized into a 256-gray-level image.
Fig. 2. Rotifer images obtained from a microscopic observation: (a) without debris; (b) with debris, marked by a pointer. Where: 1-rotifer without eggs; 2-rotifer with one egg; 3-rotifer with two eggs; 4-debris.
types of rotifers were obtained from the microscopic observation: rotifers without egg, rotifers with single egg, and rotifers with two eggs. In this study, rotifers were classified into the exact types in spite of debris that came from the sludge in the degraded water or from spoiled rotifer carcasses.
The requirement of the quality of images was important as they related to the image processing techniques. In degraded images, rotifers usually appear with many
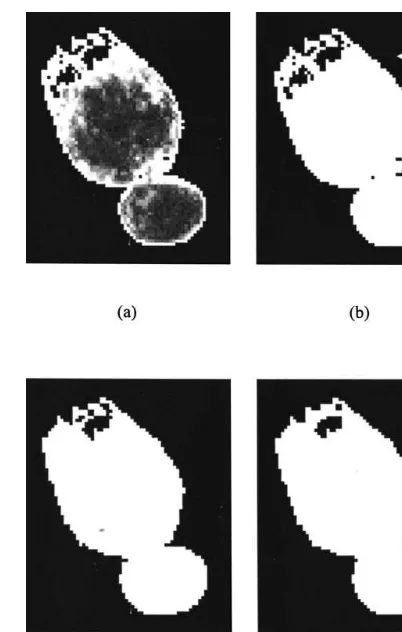
Fig. 4. Region modification for filling up rotifer’s interior: (a) original region in gray scale; (b) original region in binary; (c) region with morphological closing; (d) region refilling after closing.
trivial objects. The trivial objects are regions that can be separated easily before the discrimination model is applied. In order to maintain the images in a constant quality, we used size to exclude some trivial objects, which were unquestionably not rotifers. The exclusion also reduced the calculation time and misclassification rates. This study confined the objects of interest from 2,200 to 12,500 pixels for further identification.
2.4.Moment in6ariants
The pattern recognition technique of moment invariants was appropriate to distinguish rotifers from debris because they were quite different in their shapes. Many techniques are available for shape description. If the situation in which the rotifer under observation appear in any position or orientation, or in different sizes is considered, a shape analysis technique with RST invariance is required. Moment invariants are really suitable for such requirements. They have frequently been used in several researches for shape recognition (Gupta and Srinath, 1987; Leu, 1991; Wen and Lozzi, 1993; Shen et al., 1994; Yang and Albregtsen, 1996). Moment invariants are important due to their special properties associated with their RST invariance (Hu, 1962; Gonzalez and Woods, 1992; Wood, 1996).
Hu has introduced the theory of moments of inertia to establish a set of seven shape moments with RST invariance (derivation is shown in Appendix A).
f1=h2,0+h0,2
Reddi (1981) showed that Hu’s moments could be expressed in terms of radial and angular moments. Subsequently, Li (1992) used radial and angular moments in a general way to derive invariant functions (Appendix B). By applying binomial theorem to the radial and angular moments, generalized shape moment functions were obtained. The conceptual importance of Li’s research eliminated the phase angle effect by multiplying the generalized functions using the complex conjugates to derive invariant functions of arbitrary order. The invariant functions might reconstruct Hu’s moments. Moreover, they might derive higher-order moments. Since the order of Hu’s moments was not enough to classify the rotifers in our study, higher-order invariants were introduced. The higher-order invariants will result in higher sensitivity. Proper invariants, the orderp+q of hp,q is less than or
f10=(h4,0−6h2,2+h0,4)
2.5.Two-stage discrimination model
A two-stage model was built to identify the input patterns. First, debris was dropped out of the class for interested regions. Secondly, the outcomes (rotifers) from the first stage were classified into three groups.
2.5.1. Separation of debris from rotifers
Several ways have been evaluated in our study to separate the debris from rotifers. The debris might be the spoiled carcasses of rotifers or the sludge in degraded water. In general, debris do not have any regular form: some appear to have significant visible differences from rotifers and others are similar to rotifers in shape. It makes debris separation more difficult than rotifer classification. To solve this problem, two feasible ways are introduced in this paper, one is similarity measurement approach and the other is a degree of membership approach using the foregoing shape moment invariants.
2.5.1.1.Similarity measurement approach. The shape moment invariantsf1–f12 are features for discrimination which construct a multidimensional discrimination feature spaceV. Using the distance of moment invariants to measure the similarity between two objects in V, we could decide which class the objects belonged. Assuming the two feature vectors as:
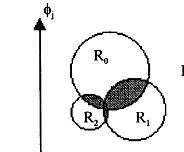
Fig. 5. DebrisRDseparated from rotifers in terms ofR0,R1, andR2. Here:Vis the whole feature space.
fiandfjare arbitrary features inV.R0,R1, andR2are the class scopes of rotifers with eggs 0, 1, and
2, respectively, inV, andRDis the class scope of debris.
The similarity measure of these two vectors was defined by
Fi−Fj=
% n k=1fik−fjk
2
1/2. (3)
One hundred and eighty-five rotifer samples, including 96 without eggs, 63 with single egg, and 26 with two eggs have been investigated for the centers and radii of class scopes in V (mean points for centers and average length for radii). Test samples with their features appeared as points in the feature space. Points located within a region were classified to their corresponding classes. In practice, the rotifer class regions in V have been found to be overlapped each other. A simplified two-dimensional plot is shown in Fig. 5, where fi and fj are chosen arbitrarily
fromf1–f12. As shown in Fig. 5, from the points in the overlapped portion, it was not easy to determine the class they belonged. Hence, similarity measurement is not so good to be applied to distinguish rotifers. Nevertheless, it is still appropriate to separate debris RD from rotifers in terms of R0, R1, and R2. Points outside the boundary of the union region are obviously regarded as debrisRD. Points inside the union region of R0,R1, and R2 are considered as rotifers.
2.5.2. Degree of membership approach
A degree of membership approach was proposed for comparison with the method of similarity measurement for debris separation. The peak-like distributions are based on the probability histograms of a moment invariant fi for different
regions,R0,R1,R2, andRD, mentioned in the previous section (Fig. 6). Here,fiis
chosen arbitrarily fromf1–f12. The membership for each region appeared from its corresponding probabilities with respect to a specificfi. For example, a test sample
which has a valuexon thefi-axis in Fig. 6 can yield the probabilities (degrees of
membership)Px,R0,Px,R1,Px,R2, andPx,RDcorresponding to classesR0,R1,R2, and
RDrespectively. SincePx,R0is zero, the sample is not certainly classified as classR0.
Using the magnitudes of these non-zero values, Px,R1, Px,R2, and Px,RD, we can
determine the corresponding class of the sample. When Px,R1 or Px,R2 is greater
than their specified threshold TR1 or TR2, the sample with value x can be
Fig. 6. Schematic diagram to illustrate the degree of membership approach, where: definitions offi,fj, R0,R1,R2, andRDare the same as in Fig. 8. An input valuexis given, particular probabilities (degree
of membership)Px,R0,Px,R1,Px,R2, andPx,RDcorresponding to classesR0,R1,R2, andRDwould be obtained from the distribution curves.TR1andTR2are specified thresholds for membership determina-tion.
2.5.3. Classification of rotifers
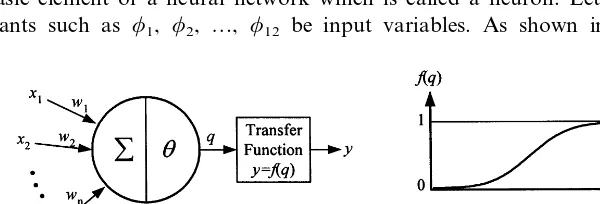
The features extracted from rotifer patterns constituted the basis for classifica-tion. To develop an effective model with the features, an accurate classification is important. In pattern recognition field, there are several ways to construct such a model. A stochastic model using Fisher’s discrimination function had been evalu-ated. Since the accuracy was relatively less, they are not quite suitable for the classification of rotifers. Artificial intelligent approaches were considered more suitable than stochastic approach, because of the complicated correlation between three types of rotifers. Therefore, an artificial neural network (ANN) was chosen because of its effectiveness on sophisticated classification problems. The ANN uses a non-algorithmic black box strategy to form a model by supervised or unsuper-vised training. The ANN has the advantage of solving problems in higher dimen-sional feature space, especially, complex interactions among features. Fig. 7 shows the basic element of a neural network which is called a neuron. Let the moment invariants such as f1, f2, …, f12 be input variables. As shown in Fig. 7, the
Fig. 8. The significant procedures for discrimination.
transformation of a linear combination of input variables with their weights and biases by a transfer function f produces the neuron outputy:
y=f(%
n i=1
wi·xi−u) (4)
where xi, input variables; wi, weights of input variables; u, bias; and y: neuron
output.
Several types of transfer functions have been developed. Choice of the transfer function depends upon applications. A typical sigmoid non-linear transfer function is shown in Fig. 7(b).
The ANN consists of a large number of highly inter-connected processing elements (neurons). It is therefore more robust than the other methods in dealing with complex problems. The most frequently used ANN is a back propagation neural network (BPNN). The BPNN is a typical supervised neural network whose learning rules are to keep adjusting the weights and biases of the network to minimize the sum of squared errors of the network. The minimization is done by continually changing the values of the network weights and biases in the direction of the steepest decent with respect to the sum of errors. This is called a gradient descent procedure. Changes in each weight and bias are proportional to element’s effect on the sum-squared error of the network. Eventually, we use these weights and biases when the training finished to build the classification model for rotifers.
3. Results and discussion
A flow chart showing significant procedures for a complete discrimination model is shown in Fig. 8. It still followed the strategy of the two-stage model as mentioned in Section 2.5, but a redundant information reduction procedure was inserted for better efficiency. Several experimental data were used to verify the model pro-grammed with MATLAB (version 5.1, The Mathworks Inc.).
3.1.Separation of debris from rotifers
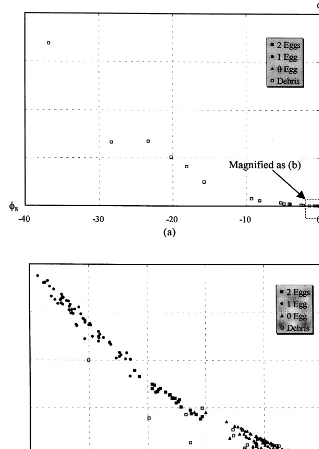
Fig. 9. Plot of moment invariantsf8andf9: on the legend, the hollow square () represents only the
debris and solid symbols (, and) represent rotifers without eggs, rotifers with 1 egg, and rotifers with 2 eggs, respectively. (a) Full scope off8andf9, including three types of rotifers as well as debris
Table 3
Experimental results for separating debris from rotifers in SP-1, SP-2, and SP-3 using similarity measurement approach
Rotifers
Actual/Predicted as Debris
SP-1:
found in other moment invariants, which resulted in poor separating condition of the debris from the rotifers.
Tables 3 and 4 show the results obtained using the method introduced in Section 2.5.1. Here SP-1, SP-2 and SP-3 are specimens from Table 1. The tables reported both correct and incorrect discriminations with the two approaches. For SP-2 in Table 3, 325 rotifers were correctly classified as rotifers, 7 rotifers as debris, 15 debris as rotifers, and 28 debris as debris. The misclassifications resulted from an overlap in the moment invariants as mentioned previously. A comparison between these two methods is shown in Table 5, where the error count is the sum of misclassifications. In Table 5, the misclassification rate is the percentage of error counts over the total number in each sample batch. As pointed out in this table, misclassification rate with the degree of membership approach (2.61%) is lower than the one with the similarity measurement (6.48%). However, the degree of member-ship approach reflects the real distribution characteristics of each group. The similarity measurement approach represents the relationship merely by the distance to the class center that is linearly proportional. Therefore, the former approach should be better than the latter.
Table 4
Table 5
Comparison of misclassifications between similarity measurement and degree of membership approach Similarity measurement approach Degree of membership approach
Error count Error count
Sample Misclassification Misclassification
rate (%) rate (%)
203 14 6.90 6 2.96
375 22 5.87 9 2.40
10 2.64
6.86
379 26
Total:
29 2.61
6.48
957 62
3.2.Selection of moment in6ariants
There are two problems when moment invariants were used to classify rotifers and debris: redundant information and magnitude differences for moment invari-ants. The problem of the magnitude differences among moment invariants is discussed in the next section. We propose a method to select efficient invariant features for redundant information reduction in this section.
The bases in the kernel of Fourier – Mellin transform are not orthogonal (Sheng and Arsenault, 1986). This causes the moment invariant fi, derived by Fourier –
Mellin transform, correlated or redundancy existed among moment invariants. A subset of these invariant features which is sufficient to accomplish the pattern recognition is necessary to reduce the complex correlation. It is difficult to follow a particular method to determine the appropriate set of invariants and to analyze the redundancy of information. In general, this selection depends on processed images.
A Euclidean distance approach was proposed to reduce the dimension of the feature space (Johnson and Wichern, 1998). The coefficientlstands for the grade of separation which is the ratio of inter-class distance to within-class distance:
l= inter-class distance
within-class distance. (5)
Generally, the inter-class distance is greater than the within-class distance to reduce the overlapping condition introduced in Section 2.5.1.1. Table 6 shows a preliminary test for the whole set of featuresf1–f12. Ten patterns in each rotifer class were chosen randomly to calculate l for different features and to examine their effectiveness of discrimination. The above discussed method can be formu-lated as
l=Bi,j/Wk\1 (6)
Bi,j: inter-class distance between groupsi and j,
Wk: within-class distance of group k,
for i, j=0, 1, 2; k=ior j.
47
Effective feature selection to reduce the feature space dimensiona
f5 f6 f7 f8 f9 f10 f11 f12
328.21 81.47 5.21 22.45 37.16 139.25
4.38 24.82 328.58 1.19
26.09 21.66
B0,1/W0 l
1.07 1.48 0.06 5.89 3.68 2.20 1.88
B0,1/W1 6.92 4.93 1.47 1.65 0.12
1.07 1.49 0.06 2.49 2.16 2.10
1.70 1.70 0.14
0.23 0.26 1.35 7.27 4.64 0.92
Table 7
Comparison between inter-class distances and within-class distances in full 12-D feature space Rotifers with 0 egg Rotifers with 1 egg Rotifers with 2 eggs
and 1 egg and 2 eggs and 0 egg
distance 6.26 79.77 79.77 40.34 40.34 6.26
SB1,2/SW1 SB1,2/SW2
f9, f11} was selected to reduce feature space dimension from 12-D to 6-D. For rotifer discrimination, it was preferable to use a subset of lower-order moments than using the entire set of moments.
The corresponding results are listed in Table 7 and Table 8 for comparison after redundant information reduction. Here, Bi,j and Wkare defined as
%Bi,j=
%Comparison between inter-class distances and within-class distances after redundant information reduction of the feature space, whenf1,f2,f3,f8,f9,f11are used
Rotifers with 1 egg
Rotifers with 0 egg Rotifers with 2 eggs and 0 egg
distance 0.33 1.85 1.85 0.45 0.45 0.33
Fig. 10. The BPNN model for rotifer classification.
In most cases,ls in Table 8 were greater than those in Table 7. In other words, increase in the distance between groups made the discrimination easier.
3.3.Classification of rotifers
A BPNN described in Section 2.5.2 was proposed as a classifier for various rotifer types. To establish the model, a batch of training samples with reduced features (f1,f2,f3,f8,f9,f11) for arbitrary types of rotifers was necessary. With the six moment invariants and an object area (A) as input variables, the BPNN model produced appropriate weights and biases for each node upon finishing the training. Since the magnitude of the invariant features in lower-order was often larger than the features in higher-order, the input variables were unbalanced. Using a weighting operation (normalization) on the features could counterbalance this unbalancing situation. A convenient way to normalize the features is to divide each coefficient by their maximum value. A schematic diagram of the three-layer BPNN model with five neurons in the hidden layer is represented in Fig. 10.
One hundred and eighty-five rotifer samples mentioned in Section 2.5.1.1 have been trained. The experimental results for three validation batches are shown in Table 9. Transfer functions for the neurons in the hidden layer and output layer were sigmoid functions:
f(x)= 1
1+e−x. (9)
C
Three experimental results for classification stage 2, reduced features:f1,f2,f3,f8,f9,f11and area were used as inputsa
Total Classification rate (%) Rotifer without egg
Actual/Predicted as Rotifer with 1 egg Rotifer with 2 eggs
SP-1:
Rotifer without egg 95 0 1 96 98.96
85.71
Debris not discarded in stage 1 3 1 0
90.64
Rotifer without egg 237 5
73 95.89
Rotifer with 1 egg 2 70 1
0 78.57
Rotifer with 2 eggs 3 11 14
4 0 2 6
Debris not discarded in stage 1
335 94.93
Rotifer without egg 205 4
63 96.83
Debris not discarded in stage 1
344 93.90 61
Correct count 205 57
Table 10
Total classification rate in stage 2a1
Batch Comparison
SP-3 (%) Average (%) SP-1 (%) SP-2 (%)
94.93 93.90
90.64 93.15
Condition: ‘‘debris not discarded in stage 1’’ was included
92.81
Condition: ‘‘debris not discarded in stage 1’’ 96.66 95.28 94.92 was excluded
aSystem performance was examined and compared when the condition ‘‘debris not discarded in stage
1’’ was included or excluded.
as the number of rotifer eggs increases. It indicates that the rotifer shape becomes complex when it carries multiple eggs. The complex shapes resulted in more overlapping in the discrimination space of moment invariants.
Table 11 shows the classification results using a full set of features. The classification rate was less accurate compared to the classification in Table 9. The classification rate was degraded due to serious misclassification of rotifers with two eggs. Although the classification rate increased slightly for the first two classes in Table 11, the total classification rate did not increase accordingly due to the serious decrease for the last class. This consequence followed the assumption in Section 3.2, and validated the importance of the removal of non-effective features. The accuracy for each stage was summarized in Table 12. The average accuracy in the three batches was about 97.34% in the first stage, 93.15% in the second stage, and 92.49% overall. The processing time was less than 0.1 s for a frame of image if parameters in the system had already tuned.
4. Conclusions
C
Results of stage 2 classificationa1
Total Classification rate (%) Rotifer without egg
Actual/Predicted as Rotifer with 1 egg Rotifer with 2 eggs
SP-1:
Rotifer without egg 96 0 0 96 100.00
88.57
0 31 4 35
Rotifer with 1 egg
36 63.89
Rotifer with 2 eggs 2 11 23
4
Debris not discarded in stage 1 2 2 0
87.72
Rotifer without egg 238 3
73 95.89
Rotifer with 1 egg 1 70 2
0 57.14
Rotifer with 2 eggs 6 8 14
3 1 2 6
Debris not discarded in stage 1
335 94.33
Rotifer without egg 206 4
63 93.65 59
Rotifer with 1 egg 3 1
65 76.92
Rotifer with 2 eggs 2 13 50
2 1 2 5
Debris not discarded in stage 1
344 91.57 59
Correct count 206 50
Table 12
Summary of accuracy in the two stages discrimination system
Batch Stages
aDegree of membership approach was adopted.
more eggs. Therefore more effective shape factors added to increase the accuracy of the discrimination model may be required.
Acknowledgements
We would like to express our gratitude to Council of Agriculture, Taiwan, for the financial support.
Appendix A. Derivation of Hu’s moment invariants
Hu introduced regular moments: for two non-negative integerp, q, the (p+q)th order moments of patternf(x, y) are given by:
Wheref(x,y) is assumed to be a piecewise continuous function, which is only in a finite part of the plane. We also have the discrete form,
mp,q= %
However, locating the base point of mp,q at the centroid of image f eliminates the
54 C.Y.Yang,J.J.Chou/Aquacultural Engineering24 (2000) 33 – 57
Discrete central moments are redefined correspondingly
mp,q= %
As the image moments are translation-invariant, they now should be scale-invari-ant by taking normalization. The normalization is obtained by dividing the moments by m0,0[(p+q)/2]+1 to make the moments dimensionless. The normalized central moments, denotedhp,q, are defined as:
hp,q=
Furthermore, for rotation-invariance, Hu derived functions based on the scale normalized central moments defined in Eq. (Eq. (14)), and proposed a set of seven RST invariants of the second and the third-order moments, as Hu’s moments.
f1=h2,0+h0,2
Appendix B. Derivation of higher order of moment invariants
Using radial and angular moments, Fourier – Mellin transformation of an irradi-ant distribution functionfn(r, u) can be expressed as
M(s,l)=
&
the centroid of the distributed function (image). The relationship between fn(r, u)
x=r cos u, y=r sin u, r=(x2
n is an integer when s-l is given an even number 2, 4, 6…, applying binomial theorem to the right-hand side of the above equation:
(x2+y2)n= %
Substituting of the above two expansions into Eq. (Eq. (16)) leads to
rs−2exp(−jlu)=(x2+y2)n(x−jy)l=P−jQ. (19)
as,l= %
The scale invariance of Fourier – Mellin transform can be achieved by normalization:
I(s,l)=M(s,l)/m0,0s/2. (27)
I(s, l) has been centralized in the complex plane at present so that it has the property of translation invariance. Multiplying I(s, l) by its complex conjugate to eliminate the rotation invariance, we could derive invariant functions for the arbitrary order. So, we obtained higher order moment invariants:
f8=h4,0+h2,2+h0,4
Fulks, W., Main, K., 1991. The design and operation of commercial-scale live feeds production system. In: Fulks, W., Main, K. (Eds.), Rotifer and Microalgae Culture System. The Oceanic Institute, HI, pp. 23 – 52.
Gonzalez, R.C., Woods, R.E., 1992. Digital Image Processing. Addison – Wesley, Reading, MA. Gupta, L., Srinath, M.D., 1987. Contour sequence moments for the classification of closed planar
shapes. Patt. Recognit. 20 (3), 267 – 272.
Hoff, F.H., Snell, T.W., 1997. Plankton Culture Manual, 4th edn. Florida Aqua Farms, Dade City, FLpp.
Hu, M.K., 1962. Visual pattern recognition by moment invariants. IRE Trans. Inform. Theory 8, 179 – 187.
Johnson, R.A., Wichern, D.W., 1998. Applied Multivariate Statistical Analysis, 4th edn. Prentice-Hall, Englewood Cliffs, NJ.
Leu, J.G., 1991. Computing a shape’s moments from its boundary. Patt. Recognit. 24 (10), 949 – 957. Li, Y., 1992. Reforming the theory of invariant moments for pattern recognition. Patt. Recognit. 25 (7),
723 – 730.
Reddi, S.S., 1981. Radial angular moment invariants for image identification. IEEE Trans. Patt. Analy. Mach. Intell. PAMI 3 (2), 240 – 242.
Shen, L., Rangayyan, R.M., Desautels, J.E.L., 1994. Application of shape analysis to mammographic calcifications. IEEE Trans. Med. Imag. 13 (2), 263 – 274.
Sheng, Y., Arsenault, H.H., 1986. Experiments on pattern recognition using invariant Fourier – Mellin descriptors. J. Opt. Soc. Am. A (Opt. Image Sci.) 3 (6), 771 – 776.
Snell, T., Carrillo, W., 1984. Body size variation among strains of rotifer Brachionus plicatilis. Aquaculture 37, 359 – 367.
Tsai, W.H., 1985. Moment-preserving thresholding: a new approach. Comput. Vision, Graphics, Image Processing. 29, 377 – 393.
Watanabe, T., Tamiya, T., Oka, A., Hirata, M., Kitajima, C., Fujita, S., 1983. Improvement of dietary value of live foods for fish larvae by feeding them on omega-3 highly unsaturated fatty acids and fat-soluble vitamins. Bull. Jap. Soc. Scient. Fisher. 49 (3), 471 – 480.
Wen, W., Lozzi, A., 1993. Recognition and inspection of manufactured parts using line moments of their boundaries. Patt. Recognit. 26 (10), 1461 – 1471.
Wood, J., 1996. Invariant pattern recognition: a review. Patt. Recognit. 29 (1), 1 – 17.
Yang, L., Albregtsen, F., 1996. Fast and exact computation of Cartesian geometric moments using discrete Green’s theorem. Patt. Recognit. 29 (7), 1061 – 1073.
.

