DATA PROCESSING CONCEPTS FOR THE INTEGRATION OF SAR INTO
OPERATIONAL VOLCANO MONITORING SYSTEMS
F. J. Meyer a, *, D. B. McAlpin a, W. Gong a, S. Arko a, P. W. Webley a, and J. Dehn a
a
Geophysical Institute, University of Alaska Fairbanks, Fairbanks, Alaska, 99775 - (fjmeyer, dbmcalpin, gwenyu, pwwebley, jdehn, saarko)@alaska.edu
KEY WORDS: Hazards, Volcanoes, Change Detection, Monitoring, SAR, Decision Support, Performance, Multisensor
ABSTRACT:
Remote Sensing plays a critical role in operational volcano monitoring due to the often remote locations of volcanic systems and the large spatial extent of potential eruption pre-cursor signals. Despite the all-weather capabilities of radar remote sensing and despite its high performance in monitoring change, the contribution of radar data to operational monitoring activities has been limited in the past. This is largely due to (1) the high data costs associated with radar data, (2) the slow data processing and delivery procedures, and (3) the limited temporal sampling provided by spaceborne radars. With this paper, we present new data processing and data integration techniques that mitigate some of the above mentioned limitations and allow for a meaningful integration of radar remote sensing data into operational volcano monitoring systems. The data integration concept presented here combines advanced data processing techniques with fast data access procedures in order to provide high quality radar-based volcano hazard information at improved temporal sampling rates. First performance analyses show that the integration of SAR can significantly improve the ability of operational systems to detect eruptive precursors. Therefore, the developed technology is expected to improve operational hazard detection, alerting, and management capabilities.
* Corresponding author.
1. INTRODUCTION
Volcanic eruptions are among the most significant hazards to human society, capable of triggering natural disasters on regional to global scales. In the last decade, remote sensing techniques have become established in operational forecasting, monitoring, and managing of volcanic hazards (Dean et al., 2002). Monitoring centers like the Alaska Volcano Observatory (AVO) are nowadays heavily relying on remote sensing data from a variety of optical and thermal sensors to provide time-critical hazard information (Webley et al., 2009). Despite the heavy utilization of these remote sensing data for early detection of eruptive activity and monitoring of ongoing volcanic eruptions, the presence of clouds and a dependence on solar illumination are limiting their impact on decision making processes.
Synthetic Aperture Radar (SAR) systems are widely believed to be superior to optical sensors in operational monitoring situations, due to the weather and illumination independence of their observations (Lu et al., 2004). The capability of SAR for observing volcanoes is further emphasized by the high performance of SAR in change detection applications and by the ability of spaceborne interferometric SAR (InSAR) to measure eruption-related surface deformation signals. Despite these benefits, the contribution of SAR to operational volcano monitoring has been limited in the past due to the following reasons: (1) high SAR data costs have largely prohibited their large scale usage in operational systems; (2) data processing has traditionally been slow, causing significant delays in data delivery; (3) most data processing routines applied to detect change and measure surface deformation require acquisitions from near-identical vantage points, reducing temporal sampling. In this study, we present new data processing and data integration techniques that mitigate some of the above mentioned limitations and allow for a meaningful integration of
SAR into operational volcano monitoring systems. Techniques are presented that improve the temporal frequency with which hazard-related products can be produced. Additionally, improvements in SAR data processing and data integration procedures are presented that provide dramatic improvements in the timeliness with which SAR data can be delivered.
A prototype monitoring system was created that integrates SAR-based hazard information with data from other sensors. This prototype system was applied to historic eruptions in the North Pacific for which detailed baseline information about eruption behavior and eruption timing is available. For these historic eruptions, the addition of SAR enhanced the capabilities of activity detection and eruption forecasting, and improved the accuracy and timeliness of eruption alerts.
2. OVERVIEW OF THE SAR DATA INTEGRATION CONCEPT
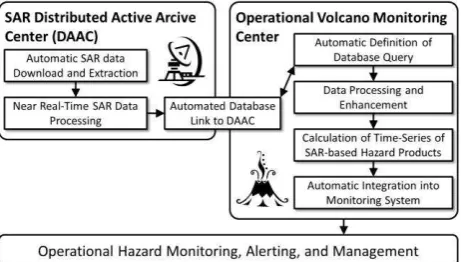
Figure 1 shows the data processing workflow that was created to facilitate an automatic integration of SAR data into existing volcano monitoring systems. To demonstrate the feasibility of
Figure 1. Conceptual design of the integration of SAR data into an existing operational volcano monitoring system.
our approach, SAR data was integrated into the monitoring system of the Alaska Volcano Observatory (AVO). AVO is a joint program of the United States Geological Survey (USGS), the Geophysical Institute of the University of Alaska Fairbanks (UAFGI), and the State of Alaska Division of Geological and Geophysical Surveys (ADGGS). AVO is responsible to monitor volcanic activity in the North Pacific region, which is one of the most geophysically active regions in the world. AVO’s mission is to assess volcanic hazards associated with anticipated volcanic activity, and to provide timely and accurate hazard information and warnings to local, state, and federal officials, the public, and the aviation industry.
Due to the vastness of its area of responsibility, AVO has heavily relied on remote sensing techniques to conduct their operational monitoring efforts (Dean et al., 2002; Webley et al., 2009). Their remote sensing-based monitoring system has been developed over more than 6 years and can be counted to one of the most advanced monitoring systems of its type. Therefore, AVO’s monitoring system is an ideal test bed to evaluate the performance improvements that can be achieved by adding SAR data to the mix of used remote sensing observations. Figure 1 highlights the processing steps that were established to facilitate a seamless integration of SAR data into AVO’s monitoring systems. Details on these processing steps are provided in the following sections.
3. NEAR REAL-TIME SAR DATA ACCESS
3.1 Improved Data Access to SAR Data Archives
To establish rapid and seamless data access to large archives of SAR data, a database link was created that connects AVO with the archives of the Alaska Satellite Facility (ASF). ASF provides access to 20 years of SAR data from the European Remote Sensing satellites ERS-1 and -2, the Canadian SAR satellite Radarsat-1, and the PALSAR sensor on board of the Japanese Aerospace Exploration Agency’s (JAXA) Advanced Land Observing Satellite (ALOS). Through generous commitments of NASA, this historic archive is available to NASA-related researchers free of charge. Additionally, changes in the data policy at the European Space Agency (ESA) are enabling free and open access to all historic and future acquisitions of ESA-operated SAR sensors. Through ESA’s upcoming C-band SAR sensor constellation Sentinel-1, routine and open data access to valuable SAR information is therefore guaranteed for the near future.
For this project, a data download client was built that enables direct access to the ASF SAR data archive. The ASF archive is exposed to the public through a RESTful-type application programming interface (API) that allows for search, metadata export and data download. Written in python and taking advantage of the ASF API and the Google geocoding API, the developed downloading tool searches for available data by volcano name and a variety of other criteria. The tool returns a formatted list of available data products, a KML file for viewing the results in Google Earth(TM) and directly downloads historic or new data as it enters the archive. For operational use, this tool will be integrated via a cron-type interface to automatically search for new data over volcanoes of interest and download the data when it becomes available.
3.2 Improved Near-Real Time Processing Capabilities
Given its day/night, all-weather capability, SAR has been a vital data source for near-real time (NRT) applications for many years. ASF has demonstrated this value with over 20 years of
NRT support to the ice charting and marine safety communities. Throughout this time, the ASF production environment has been continuously enhanced with an emphasis on technologies that enable the rapid processing and delivery of data. Via automated, parallelized computing systems and high-speed networks, ASF is able to guarantee delivery of NRT data to customers within four hours of reception. More commonly, data are provided to customers in under an hour and a half. With such rapid turnaround times, SAR data are now a viable data source for disaster alert systems.
4. CREATION OF DATA REQUESTS AND DATABASE INTEGRATION
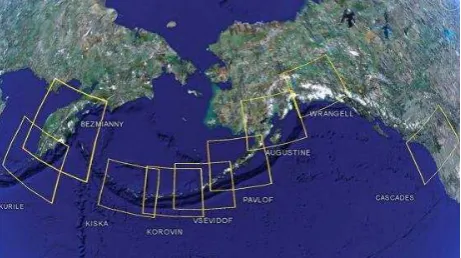
Currently, the creation of volcano alerts in the AVO monitoring system is based on changes in thermal activity in acquisition of the Advanced Very High Resolution Radiometer (AVHRR) sensor (see within Webley et al., 2009). To organize these data, the North Pacific volcanic region is divided into sectors based on the geographic location of associated volcanoes (see Figure 2). After completion of the integration of SAR data into AVO’s monitoring environment, SAR sensors will be added to the AVHRR feed to support routine observations of key areas of the North Pacific volcanic arc. For this purpose, the established near real-time data acquisition and processing stream (see Section 3) will liaise with the Distributed Active Archive Center (DAAC) databases at ASF. SAR data is grouped and catalogued according to their corresponding sector ID and interface with the currently existing volcano monitoring database (see http://avo.images.alaska.edu/tools/datacenter/). This ensures that those in volcano monitoring and analysis are exposed to newly processed data and are integrating SAR data into their analyses. Once an alert is created based on the AVHRR and SAR data, urgent requests are placed to the NASA ASTER sensor (see Ramsey and Dehn, 2004; Ramsey et al., 2004) to get additional multi-spectral imaging information for the active region. The ASTER requests are defined to be timely and ensure that ASTER duty cycles are not swamped. The final data analysis and hazard assessment is then based on the combined data stream from all of these sensors. A web-based image analysis tool was developed to allow operators to perform monitoring duties from any location around the globe and in a 24/7 setting. A screenshot of this data analysis system is shown in Figure 7 for your reference.
5. DATA PRE-PROCESSING CONCEPTS
While SAR data is regularly used to analyze volcanic systems after eruptions have occurred (Amelung et al., 2000a; Amelung et al., 2000b; Biggs et al., 2010; Dzurisin, 2006; Dzurisin et al., Figure 2. Geographic sectors that are used to organize remote sensing data in the AVO system. Sector outlines and sector names are shown (adapted from Webley et al., 2009). International Archives of the Photogrammetry, Remote Sensing and Spatial Information Sciences,
2009; Fournier et al., 2009; Lu, 2007), not much research has been dedicated towards assessing the applicability of SAR for pre-eruptive hazard detection. Aside from the data access issues addressed in Sections 3 and 4, this was largely due to the fact that most data processing routines applied to detect change and measure surface deformation from SAR have required acquisitions from near-identical vantage points, reducing temporal sampling. In this section, we introduce data management concepts as well as pre-processing steps that enhance the achievable temporal sampling provided by existing SAR sensors.
5.1 SAR Image Focusing and Calibration
For each geographic sector, SAR data are grouped using their track and frame information and the initial raw SAR data are focused to single look complex (SLC) images. Neighboring frames are concatenated wherever the imaging geometry prohibits full coverage with one individual frame. The concatenated SLCs are calibrated to preparation them for a range of change detection methods. Subsequently, SLCs with identical track and frame IDs are co-registered into a unique geometry.
5.2 Preparation of Data for Coherent and Incoherent Change Detection
5.2.1 Data preparation for InSAR analysis: To prepare the data for interferometric processing, the following preparatory steps are automatically executed:
A Digital Elevation Model (DEM) is extracted from a multi-temporal DEM database. This DEM is used to compensate topographic phase components in interferograms and to facilitate precise geocoding of processing results. Due to the rapid topographic changes around volcanic systems, selecting a temporarily coordinated DEM is imperative for precision phase correction and geocoding.
For every new incoming SAR image a total of three historic images are selected for InSAR processing. These include (1) the previous image in the time series, (2) a seasonally coordinated image acquired in the previous year, and (3) a seasonally coordinated image acquired two years prior. Where available, GPS data are extracted from AVO’s
database to support error detection and correction in the InSAR processor.
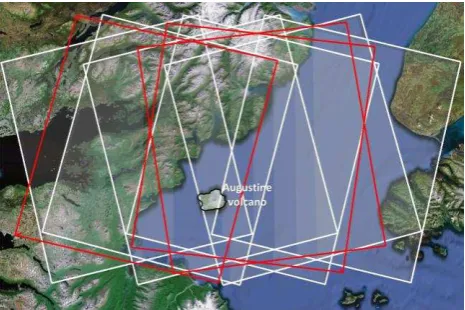
As data originates from various sensors, observation geometries, and orbit directions (see Figure 3 for an example), interferometric data can be produced at dense time intervals.
5.2.2 Preparation for amplitude-based change detection: Due to the high geographic latitude of AVO’s area of operation, every volcanic system is covered by several neighboring satellite swaths imaging the area under slightly different observation geometries (Figure 3). To enable a joint analysis of these multi-geometry data, relative geometric and radiometric distortions are removed using the following workflow:
Geometric terrain correction is conducted to remove geometric image distortions. The previously extracted time coordinated DEM is used in this step.
Radiometric terrain normalization is performed to remove geometry dependent radiometric distortions. The radiometric normalization technique in (Small, 2011) is applied.
An example of the benefits of the geometric and radiometric normalization procedure is shown in Figure 4. Figure 4(a) shows an original ALOS PALSAR image over an area near the Denali fault, Alaska. The effects of geometric correction are shown in Figure 4(b) and the effects of radiometric normalization are presented in Figure 4(c). The normalized data are exported to GeoTIFF format for subsequent change detection procedures.
6. PRODUCTION OF TIME-SERIES OF SAR-BASED HAZARD PRODUCTS
6.1 Amplitude-based Change Detection Procedure
In the current implementation, change detection maps are produced using an automated multi-step procedure including the formation of log-scaled ratio images, constant false alarm rate outlier detection, and subsequent denoising operations.
6.1.1 Formation of log-scaled ratio images: To identify potential surface changes from SAR data, a ratio image is formed between a newly acquired image and a reference data set. Using ratio images in change detection was suggested in (Dekker, 1998). To minimize the effects of seasonal variations as well as spurious changes of surface reflectivity on the change detection product, the reference image used to form the ratio image is created by averaging three historic seasonally coordinated geometrically and radiometrically corrected SAR images. The ratio image can then be modeled as
xR
r (1)
Figure 3. Ground tracks of neighboring SAR image swaths covering Augustine volcano, Alaska. White frames are ERS-2 data and red frames identify Radarsat-1 tracks.
(a) (c)
Figure 4. Example of geometric (b) and radiometric (c) normalization that is applied to every image (a) to enable joint analysis of data from multiple observation geometries for change detection purposes. (b)
where r is the observed intensity ratio, x is a multiplicative speckle contribution, and R is the underlying true intensity ratio. The ratio image r has the disadvantage that the statistical distribution of its gray values is highly non-normal and that its multiplicative noise is difficult to remove. Therefore, a logarithmic scaling is applied to r , resulting in:
Q y
t (2)
where y10log
x , Q10log
R , and t is the log-scaled ratio data. A 55 averaging filter is applied to t to reduce the now additive noise y and to achieve symmetric near-normal distribution of the data. An example of a filtered log-scaled ratio image is shown in Figure 5. Bright areas in this figure indicate surface changes associated with the 2008 eruption of Okmok volcano, Alaska.6.1.2 Image thresholding and filtering of change detection mask: For creating a first change candidate mask, the probability density function of t is first tested for multi-modality. If unimodal data is identified, a two-tailed Fisher’s Z-test (Fisher, 1915) is be applied to the probability density function of t by calculating
Q Q
Q Z
~ ~
~
(3)
where Q~ is the estimate of Q after the 55 averaging filter was applied to Eq. (2). To identify image pixels affected by surface change, the calculated Z value is compared to a critical value that is selected for a confidence level of 195%. For bimodal data, a sum of two Gaussians is fitted to the data and the change detection threshold is defined by the minimum between the estimated Gaussians.
To filter the original (noisy) change detection mask, a combination of opening and closing operations are applied (Haralick and Shapiro, 1993) similar to the approach in (Meyer et al., 2010).
6.2 Creation of InSAR-based Change Detection Products
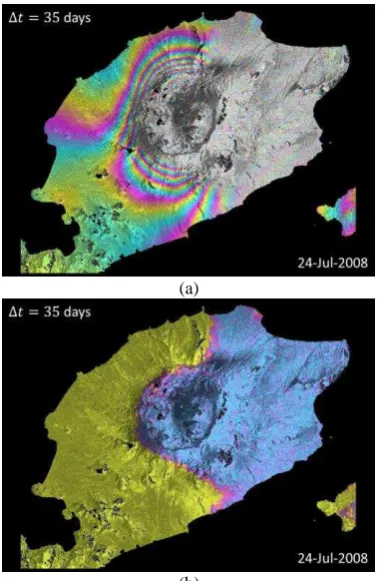
For every new SAR acquisition, automated interferometric SAR processing relative to three historic SAR acquisitions (see Section 5.2.1) is performed, resulting in two sets of hazard information: (1) Surface deformation maps are produced to highlight changes in the volcanic plumbing system that often occur in the weeks leading up to an eruption (Amelung et al., 2000b; Lu et al., 2010a); (2) coherent change detection maps are created to identify changes in a volcano’s thermal conditions, detect effusion of material prior to eruptions, and provide means to map depositional features (e.g., ash) as well as flow structures (e.g., lava, lahars, pyroclastic flows) (Lu et al., 2010b; McAlpin and Meyer, 2013).
Examples of automatically produced InSAR-based hazard products are shown in Figure 6 for the eruption of Okmok volcano in 2008. Figure 6(a) highlights the surface deformation that accumulated within the first few days of Okmok’s eruptive period. Figure 6(b) shows the associate change detection map derived from the InSAR coherence map. Figure 5 and 6 cover the same time period and indicate the comparability of coherent and incoherent change detection techniques. The InSAR processor used in the developed system is based on the Interferometric SAR Processor (ISP) distributed by GAMMA Remote Sensing.
7. INTEGRATION INTO OPERATIONAL MONITORING PROCESS
Section 4 highlighted how SAR data and derived products are fed into the existing operational databases and how AVO will use thermal- and SAR-based hazard products to create volcanic Figure 5. Log-scaled and filtered ratio image t indicating
change associated with the 2008 eruption at Okmok volcano. Bright pixels where changed by ash fall and deposition of eruptive material.
(a)
(b)
Figure 6. Surface deformation and surface change that occurred within the first few days of Okmok’s eruptive period in 2008. (a) Surface deformation accumulated within the first 12 days of the eruptive period. Associated surface change induced by ash fall and deposition of eruptive material.
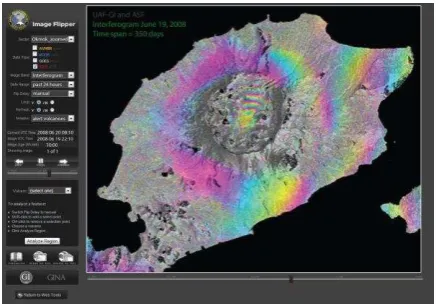
hazard alerts. Figure 7 illustrates how SAR-derived hazards data will be used within AVO’s operational web-based monitoring system. Here, a prototype of the “Image Flipper” system is shown to illustrate how the user will interface with the derived products. AVO’s Image Flipper is a multi-sensor hazard analysis tool that enables monitoring staff to jointly analyze remote sensing data from thermal, multi-spectral, and now microwave sensors for eruption-related activity. It supports overlaying of image data, animating time series of data, quantitative analysis of image content (e.g., measuring of surface temperatures, measuring of size of ash clouds or deposition features), and reporting of identified anomalies. Reports from AVO’s remote sensing-based monitoring system are used together with other data feeds to create and issue hazard information.
8. ASSESSMENT OF THE BENEFIT OF INTEGRATING SAR INTO OPERATION VOLCANO
MONITORING
Since 2006, there have been a large number of major volcanic eruptions around the North Pacific, e.g. Augustine volcano (Bailey et al., 2010; Power et al., 2006; Webley et al., 2010), Okmok volcano (Larsen et al., 2009), Kasatochi volcano (Waythomas et al., 2010) and Sarychev Peak volcano (Rybin et al., 2011), where real-time monitoring was critical for understanding volcanic activity. These historic eruptions are utilized to assess the impact of SAR products on the decision-making made for these events. Goal is to analyze how the
addition of SAR improves the timing of eruption alert issuing. In hazard warning systems, it is important to be accurate and timely in indicating both the presence and absence of hazards. Therefore, the impact of SAR will be analyzed both for raising and lowering of alert levels.
So far, we have analyzed the impact of SAR data on decision-making processes associated with the eruption of Okmok volcano, whose last eruptive episode started on July 12, 2008 and lasted until Sept 15, 2008. The timeline of this eruption is shown in Figure 8 together with the approximate geographic location of the volcano (insert on the right side of Figure 8). Figure 8 shows that AVO’s traditional methods for hazard alerting identified eruptive pre-cursors only 20 minutes prior to the start of the eruption. At that time (19:40UTC), seismic stations identified increased tremor in the area.
While AVO’s traditionally used remote sensing resources did not identify any activity increase prior to eruption, an integration of SAR data would have identified eruption pre-cursors already 25 days before the start of the eruption. On June 19, 2008, a sudden inflation was identified that caused about 9 cm of uplift of parts of Okmok’s crater area (see Figure 8, insert on left). Therefore, for this eruption, SAR data would have significantly improved the timeliness and accuracy of hazard alerts issued by AVO’s operational system.
9. CONCLUSIONS AND OUTLOOK
With this paper, we presented a prototype system that integrates SAR-derived hazard information into the operational volcano monitoring environment of the Alaska Volcano Observatory. The workflow of the developed system was shown and processing steps were described that allow for a meaningful integration of SAR into operational volcano monitoring systems. Specifically, techniques were presented that improve the temporal frequency with which hazard-related products can be produced.
A first performance assessment indicates that operationally and automatically produced SAR data can lead to a significant improvement of the timeliness and accuracy of issued hazard alerts. The research team is currently working on the development of additional SAR-based hazard products and on the completion of the integration of SAR data into AVO’s operational monitoring system. The performance assessment will be expanded by analyzing events with different eruptive behaviors at volcanoes with different physical and geometric properties.
10.ACKNOWLEDGEMENTS
We acknowledge funding support by the National Aeronautics and Space Administration (NASA) through the Research Opportunities in Space and Earth Sciences (ROSES) program “A.33 Earth Science Applications: Disasters”. The authors want to thank the Japanese Aerospace Exploration Agency (JAXA) and the Alaska Satellite Facility (ASF) for providing the data for this study.
11.REFERENCES
Amelung, F., Jonsson, S., Zebker, H. and Segall, P., 2000a. Widespread uplift and 'trapdoor' faulting on Galapagos volcanoes observed with radar interferometry. Nature, 407(6807): 993-996.
Figure 7. Screenshot of a prototype of the modified “Image Flipper”, AVO’s operational web-based monitoring system. This modified prototype adds SAR products to the list of multi-sensoral hazard information.
Figure 8. Timeline of the eruption at Okmok volcano in 2008 together with the timeline of hazard alerts. The chart shows that no pre-eruptive signatures could be detected by thermal and multi-spectral remote sensing data. First eruptive indicators were detected by seismic stations only 20 minutes prior to the start of the eruption. The addition of SAR would have improved the warning period from 20 minutes to 25 days.
Amelung, F., Oppenheimer, C., Segall, P. and Zebker, H., 2000b. Ground deformation near Gada 'Ale Volcano, Afar, observed by Radar Interferometry. Geophysical Research Letters, 27(19): 3093-3096.
Bailey, J., Dean, K., Dehn, J. and Webley, P., 2010. Integrated satellite observations of the 2006 eruption of Augustine Volcano. In: J.A. Power, Coombs, M.L., and Freymueller, J.T. (Editor), The 2006 eruption of Augustine Volcano, Alaska: U.S. Geological Survey Professional Paper 1769, pp. 481–506.
Biggs, J., Lu, Z., Fournier, T. and Freymueller, J.T., 2010. Magma flux at Okmok Volcano, Alaska, from a joint inversion of continuous GPS, campaign GPS, and interferometric synthetic aperture radar. Journal of Geophysical Research, 115(B12): B12401.
Dean, K.G., Dehn, J., Engle, K., Izbekov, P., Papp, K. and Patrick, M., 2002. Operational satellite monitoring of volcanoes at the Alaska Volcano Observatory. Monitoring Volcanic Hotspots using Thermal Remote Sensing, AJH Harris, M. Wooster and DA Rothery (Eds), Advances in Environmental Monitoring and Modelling, 1: 70-97.
Dekker, R.J., 1998. Speckle filtering in satellite SAR change detection imagery. Int J Remote Sens, 19(6): 1133-1146.
Dzurisin, D., 2006. Volcano deformation: New geodetic monitoring techniques. Springer.
Dzurisin, D., Lisowski, M. and Wicks, C.W., 2009. Continuing inflation at Three Sisters volcanic center, central Oregon Cascade Range, USA, from GPS, leveling, and InSAR observations. B Volcanol, 71(10): 1091-1110.
Fisher, R.A., 1915. Frequency distribution of the values of the correlation coefficient in samples from an indefinitely large population. Biometrika, 10(4): 507-521.
Fournier, T., Freymueller, J. and Cervelli, P., 2009. Tracking magma volume recovery at Okmok volcano using GPS and an unscented Kalman filter. J Geophys Res-Sol Ea, 114: -.
Haralick, R.M. and Shapiro, L.G., 1993. Computer and robot vision. Prentice Hall.
Larsen, J., Neal, C., Webley, P., Freymueller, J., Haney, M., Mc-Nutt, S., Schneider, D., Prejean, S., Schaefer, J. and Wessels, R., 2009. Eruption of Alaska volcano breaks historic pattern. Eos, 90(20).
Lu, Z., 2007. InSAR imaging of volcanic deformation over cloud-prone areas - Aleutian Islands. Photogramm Eng Rem S, 73(3): 245-257.
Lu, Z., Dzurisin, D., Biggs, J., Wicks, C. and McNutt, S., 2010a. Ground surface deformation patterns, magma supply, and magma storage at Okmok volcano, Alaska, from InSAR analysis: 1. Intereruption deformation, 1997-2008. J Geophys Res-Sol Ea, 115: -.
Lu, Z., Dzurisin, D., Jung, H.S., Zhang, J. and Zhang, Y., 2010b. Radar image and data fusion for natural hazards
characterisation. International Journal of Image and Data Fusion, 1(3): 217-242.
Lu, Z., Rykhus, R., Masterlark, T. and Dean, K.G., 2004. Mapping recent lava flows at Westdahl Volcano, Alaska, using radar and optical satellite imagery. Remote Sensing of Environment, 91(3–4): 345-353.
McAlpin, D. and Meyer, F.J., 2013. Multi-sensor data fusion for remote sensing of post-eruptive deformation and depositional features at Redoubt Volcano. J Volcanol Geoth Res(0).
Meyer, F., Mahoney, A., Eicken, H. and Denny, C., 2010. L-Band SAR Interferometry for Mapping Arctic Landfast Ice, pp. 0517.
Power, J., Nye, C., Coombs, M., Wessels, R., Cervelli, P., Dehn, J., Wallace, K., Freymueller, J. and Doukas, M., 2006. The reawakening of Alaska’s Augustine volcano. Eos, 87(37): 373-377.
Ramsey, M. and Dehn, J., 2004. Spaceborne observations of the 2000 Bezymianny, Kamchatka eruption: the integration of high-resolution ASTER data into near real-time monitoring using AVHRR. J Volcanol Geoth Res, 135(1–2): 127-146.
Ramsey, M.S., Dehn, J., Wessels, R., Byrnes, J., Duda, K., Maldonado, L. and Dwyer, J., 2004. The ASTER emergency scheduling system: a new project linking near-real-time satellite monitoring of disasters to the acquisition of high-resolution remote sensing data, American Geophysical Union, Fall Meeting 2004, pp. abstract #SF23A-0026.
Rybin, A., Chibisova, M., Webley, P., Steensen, T., Izbekov, P., Neal, C. and Realmuto, V., 2011. Satellite and ground observations of the June 2009 eruption of Sarychev Peak volcano, Matua Island, Central Kuriles. B Volcanol, 73(9): 1377-1392.
Small, D., 2011. Flattening Gamma: Radiometric Terrain Correction for SAR Imagery. Ieee T Geosci Remote, 49(8): 3081-3093.
Waythomas, C.F., Scott, W.E., Prejean, S.G., Schneider, D.J., Izbekov, P. and Nye, C.J., 2010. The 7–8 August 2008 eruption of Kasatochi Volcano, central Aleutian Islands, Alaska. Journal of Geophysical Research, 115: B00B06.
Webley, P., Dean, K., Dehn, J., Bailey, J. and Peterson, R., 2010. Volcanic-ash dispersion modeling of the 2006 eruption of Augustine Volcano using the Puff model. In: J.A. Power, Coombs, M.L., and Freymueller, J.T. (Editor), The 2006 eruption of Augustine Volcano, Alaska: USGS Professional Paper 1769, pp. 507 - 526.
Webley, P., Dehn, J., Lovick, J., Dean, K., Bailey, J. and Valcic, L., 2009. Near-real-time volcanic ash cloud detection: Experiences from the Alaska Volcano Observatory. J Volcanol Geoth Res, 186(1-2): 79-90.