FEATURE EXTRACTION FROM GEOEYE-1 STEREO PAIRS
DATA FOR FORESTED AREA
P. Stournara a, *, C. Georgiadis b, D. Kaimaris c, M. Tsakiri-Strati a, V. Tsioukas a
a
Aristotle University of Thessaloniki (AUTH), School of Rural and Surveying Engineering, Greece – [email protected], [email protected], [email protected]
b
Aristotle University of Thessaloniki (AUTH), School of Civil Engineering, Greece – [email protected]
c
Aristotle University of Thessaloniki (AUTH), School of Spatial Planning and Development, Greece – [email protected]
Commission VI, WG VI/4
KEY WORDS: Geoeye-1, Stereo pairs, High Pass Filter fusion technique, DSM generation, Forested area
ABSTRACT:
Remote sensing facilitates the extraction of information for earth’s surface through its capability of acquiring images covering large areas and the availability of commercial software for their processing. The aim of this study is the feature extraction from three Geoeye-1 stereo pairs for forested area. The study area is located in central mountainous forested peninsula of Chalkidiki, in northern Greece. Dominant forest tree species of the site are oak (Quercus conferta), beech (Fagus moesiaca), black pine (Pinus nigra) and calabrian pine (Pinus brutia). Very High Resolution (VHR) Geoeye-1 stereo pair satellite images were utilized in panchromatic and multispectral mode. The panchromatic mode was employed for Digital Surface Model (DSM) generation and its evaluation. In this study the High Pass Filter (HPF) data fusion technique was applied between panchromatic and multispectral mode for acquiring a new image with the benefits of both contracting images. Because of the fact that the feature extraction was attempted
in a forested region, NDVI index and Tasseled Cap transformation were applied in the fused images’ evaluation procedure. Optical assessment was also applied. The accuracy of the generated DSM and the evaluation results of the fused images were remarkable.
* Corresponding author
1. INTRODUCTION
Forest management is important to environmental protection, biodiversity preservation, recreation, timber production and mitigation of climate change (Peterson et al., 1999). Remote
sensing facilitates the extraction of information for earth’s
surface through its capability of acquiring images over large areas. This is even more useful in the case of consistent and repetitive monitoring of forests (Hussin and Bijker, 2000). Feature extraction from satellite images strengthens the ability
of monitoring the Earth’s surface and therefore forested areas.
In this study Geoeye-1 stereo pairs were utilized to extract information on a forested area of Chalkidiki peninsula. Geoeye-1 satellite was launched on September 2008 from Vandenburg Air Force Base in California. It collects panchromatic and multispectral imagery at 0.41m and 1.65m resolution at nadir, while distributed commercially at 0.5m and 2m respectively (DigitaGlobe, 2015). VHR Geoeye-1 images in stereo mode are utilized to provide highly accurate DSMs. In (Saldaña et al., 2012) the vertical accuracy of the Geoeye-1 generated DSMs was better than 0.5m (standard deviation) in a study area with a smooth coastal terrain and a mean elevation close to 7m in Spain. For the same study site DSM vertical accuracy reported by Aguilar et al. (2013) was up to 0.39m (standard deviation). Other studies refer to the good georeferencing accuracy of the Geoeye-1 stereomodels. Meguro and Fraser (2010) reported an accuracy of 0.35m in planimetry and 0.7m in height, Fraser and Ravanbakhsh (2009) reported an accuracy reaching 0.10m in planimetry and 0.25m in height.
2. STUDY AREA AND DATASETS 2.1 Study area
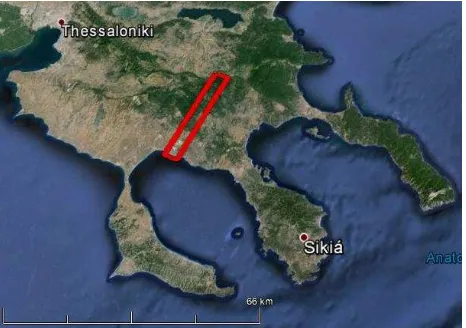
The study area is located in central Chalkidiki (Figure 1), Northern Greece. The major part includes mountainous region (mount Cholomontas) with height variation from around 300-1165m. Vegetation species are calabrian pine (Pinus brutia), black pine (Pinus nigra), beech (Fagus moesiaca), maritime pine (Pinus maritima), oak (Quercus confertae) and various bushes (broadleaf evergreen). Figure 2 presents a more detailed view of the study area.
Figure 1. The study site is located in Chalkidiki peninsula, Northern Greece.
Figure 2. The geographical location of the study area.
© GoogleEarth Copyright 2015
2.2 Datasets
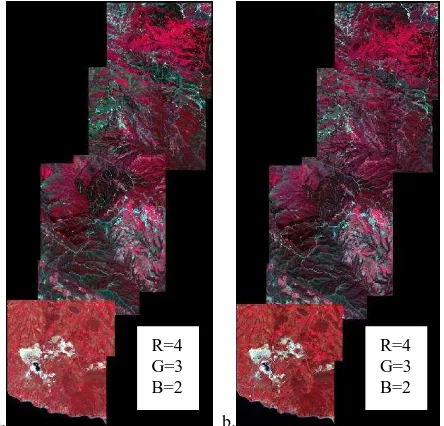
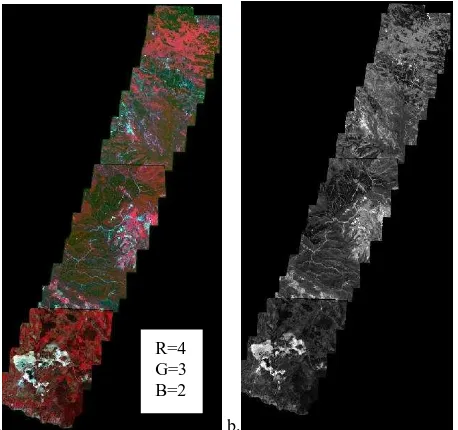
The satellite data was three Geoeye-1 stereo pairs taken on 27/04/2013 in UTM projection, zone 34, ellipsoid WGS84 and geodetic datum WGS84, both in multispectral (MS) (2m resolution) (Figures 3, 5) and panchromatic mode (PAN) (0.5 resolution) (Figures 4, 6). Rational Polynomial Coefficients (RPC), which relate image space coordinates (line and column) to object coordinates (Samadzadegan et al., 2008; Krishna et al., 2008), were also available. 50 Ground Control Points (GCPs) were collected during July and October of 2013 using the Global Positioning System (GPS) and the RTK method (Fotiou et al., 2009) for the aerotriangulation of the stereo pairs. Their 3D accuracy was around 0.10m.
a. b.
Figure 3. The Geoeye-1 MS stereo pairs (2m).
a. b.
Figure 4.The Geoeye-1 PAN stereo pairs (0.5m).
Figure 5. Part of the MS image.
Figure 6. Part of the PAN image.
3. METHODOLOGY 3.1 Overall process
The basic procedure and application is shown in Figure 7. R=4
G=3 B=2 R=4
Figure 7. Flowchart of the overall process.
3.2 Aerotriangulation
The aerotriangulation is performed in order to determine the external orientation of the stereomodel. Two aerotriangulations were performed, one with the MS stereo pairs and one with the PAN stereo pairs. The processing was performed in the LPS 2011 software environment. For the MS stereo pairs 35 control points and 13 check points were utilized. For the PAN stereo pairs 37 control points and 14 check points. The overall standard deviation was 0.39 planimetrically, 0.82m vertically for the MS stereo pairs and 0.19m planimetrically, 0.28m vertically for the PAN stereo pairs (Table 1). These results correspond up to half pixel of the Geoeye-1 images and are quite satisfactory for a mountainous forested terrain.
Image dataset σxy (m) σz (m)
MS 0.39 0.82
PAN 0.19 0.28
Table 1. Aerotriangulation results: Overall standard deviation of the aerotriangulations.
3.3 DSM generation
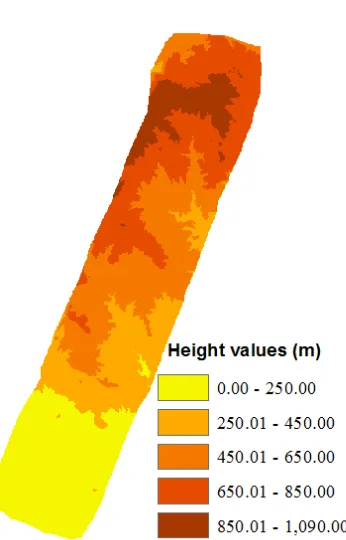
After the external orientation of the stereo model, which was determined through the aerotriangulation process, a DSM with a 5m grid size (Figures 8-9) was generated from the panchromatic stereo pair. In DSMz error assessment only check points took
part. Results are shown in Table 2. In order to further evaluate the DSM quality, the DSM point status image (Figure 10) was generated simultaneously with the DSM. It characterizes the quality of the DSM points: Points classified as excellent are rendered with green colour, as good with dark green and as fair with yellow. This classification is based on the value of the correlation coefficient between the images of the stereo pairs and it is related to the research of the homologous points during the automatic matching the process.
Figure 8. DSM.
Figure 9. DSM height values.
DSMz error Error (m)
RMSE (Root Mean
Square Error) 1.5
Mean absolute error 0.9 Table 2. DSM accuracy. Satellite stereo pair
MS, PAN
Aerotriangulation
Automatic DSM Generation
Orthoimagery Generation
Figure 10. DSM point status image.
3.4 Orthoimagery generation
After the aerotriangulation of the stereo pairs, orthorectification of MS and PAN images was implemented. In both images the 5m grid size DSM was utilized. The orthorectified images are shown in Figure 11.
a. b.
Figure 11. a: Geoeye-1 orthoMS (2m), b: Geoeye-1 orthoPAN (0.5m).
3.5 Data Fusion
Geoville, Inc. and Derrold Holcomb of ERDAS, Inc. was implemented. This technique involves a convolution using a High Pass Filter (HPF) on the high resolution data. This reduces the lower frequency spectral information of the high spatial resolution image (Han et al., 2008). The multispectral image is resampled to the pixel size of the high pass resolution image. Then the filtered image is added to the MS image combining the spatial information of the PAN image with the multispectral information of the MS image.
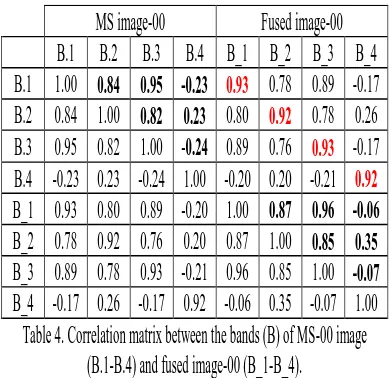
The correlation matrices between the bands of each MS image and the fused image are presented in Tables 4-6. Spectral quality of the fused image can be evaluated by the correlation between the bands of each image (MS and fused image) and the correlation of the corresponding bands of the two images (Tsakiri et al., 2002).
The NDVI index and Tasseled Cap transformation were applied to the multispectral and the fused images, and the correlation between them was computed, since most of the images include areas of vegetation. The results for the value of the correlation coefficient of the NDVI images are presented in Table 3 and for the Tasseled Cap transformation in Tables 7-9.
NDVI images (MS, fused)
Corellation Index
00 0.97
01 0.96
02 0.98
Table 3. Correlation coefficient values between the NDVI-MS and NDVI-fused image.
Figure 12. A part of the fused image.
Figure 13. An extract of the fused image. R=4
MS image-00
Fused image-00
Table 4. Correlation matrix between the bands (B) of MS-00 image
(B.1-B.4) and fused image-00 (B_1-B_4).
Table 7. Correlation matrix between the bands (B) of Tasseled Cap MS-00 image
(B.1-B.4) and Tasselled Cap fused image-00 (B_1-B_4).
MS image-01
Fused image-01
Table 5. Correlation matrix between the bands (B) of MS-01 image
(B.1-B.4) and fused image-01 (B_1-B_4).
Table 8. Correlation matrix between the bands (B) of Tasselled Cap MS-01
image (B.1-B.4) and Tasselled Cap fused image-01 (B_1-B_4).
MS image-02
Fused image-02
Table 6. Correlation matrix between the bands (B) of MS-02
image (B.1-B.4) and fused image-02 (B_1-B_4).
Tas. Cap MS-02
Tas. Cap Fused-02
Table 9. Correlation matrix between the bands (B) of Tasselled Cap MS-02
4. DISCUSSION AND CONCLUSIONS
Aerotriangulation results were very good and compatible with other studies (Meguro & Fraser, 2010; Fraser & Ravanbakhsh, 2009). The DSMz error was 1.5m (RMSE) and 0.9m (mean
absolute error), which is quite satisfactory for a mountainous forested terrain. Other studies have showed better accuracy (Saldaña et al., 2012; Aguilar et al., 2013), but they were conducted in a study area with smooth coastal terrain. The DSM point status image shows the good quality of the DSM points (Figure 10). The statistical results from the High Pass Filter fusion show a very good correlation between the corresponding bands of the MS and the fused image. The correlation values were 0.92-0.99, while for the Tasseled Cap images the correlation values were generally over 0.90, except in three cases, which were between 0.80-0.90. NDVI and Tasseled Cap transformation are very significant for forested areas. The high correlation values show there is high similarity in the spectral behavior of NDVI index and Tasseled Cap transformation between the MS and the fused image. We can conclude that Geoeye-1 stereo pairs have a significant potential for forested areas to produce DSMs with high accuracies and fused images that preserve detail and are suitable and ancillary in procedures such as photointerpretation, classification (Karydas et al., 2014) etc.
ACKNOWLEDGEMENTS
This research has received funding by the European Union (European Social Fund-ESF) and Greek national funds through the Operational Program “Education and Lifelong Learning” of the National Strategic Reference Framework (NSRF) Research Funding Program: THALES. The authors wish to thank for the financial support of the 36th ISRSE Organizing Committee travel support program.
REFERENCES
Aguilar, M.A., Saldaña, M.M. and Aguilar, F.J., 2014. Generation and Quality Assessment of Stereo-Extracted DSM From GeoEye-1 and WorldView-2 Imagery. IEEE Transactions on Geoscience and Remote Sensing, 52(2): 1259-1271.
DigitalGlobe, 2015. Geoeye-1 https://www.digitalglobe.com (15 March 2015). Accuracy of GeoEye-1 Imagery. Photogrammetric Engineering & Remote Sensing, 75(6), pp. 634-638.
Han, S.S., Li, H.T., Gu, H.Y., 2008. The study on image fusion for high spatial resolution remote sensing images. In: The International Archives of the Photogrammetry, Remote Sensing and Spatial Information Sciences, Beijing, China, Vol. XXXVII, Part B7, pp. 1159-1164.
Hussin, Y.A., Witske, B., 2000. Inventory of remote sensing applications in forestry for sustainable management. In: The
and Spatial Information Sciences, Amsterdam, Holland, Vol. XXXIII, Part B7, pp. 575-579.
Karydas, C., Stournara, P., Gitas, I., Tsakiri, M., 2014. Mapping vegetation species for the United Nations Framework Convention on Climate Change (UNFCCC) using Geoeye-1 imagery. In: 5th GEOBIA Proceedings, Thessaloniki, Greece, and South-Eastern European Journal of Earth Observation and Geomatics, 3(2S), pp. 85-88.
Krishna, B.G., Amitabh, T.P., Srinivasan, P. and Srivastava, K., 2008. DEM Generation from High Resolution MultiView Data Product. In: The International Archives of the Photogrammetry, Remote Sensing and Spatial Information Sciences, Beijing, China, Vol. XXXVII, Part B1, pp. 1099-1102.
Meguro, Y. and Fraser, C.S., 2010.Georeferencing accuracy of Geoeye-1 stereo imagery: experiences in a Japanese test field. In: The International Archives of the Photogrammetry, Remote Sensing and Spatial Information Sciences, Kyoto, Japan, Vol. XXXVIII, Part 8, pp.1069-1072.
Peterson, D.J., Resetar, S.A., Brower, J. and Diver, R., 1999. Forest Monitoring and Remote Sensing, A Survey of Accomplishments and Opportunities for the Future. RAND Corporation
http://www.rand.org/pubs/monograph_reports/MR1111z0.html (15 March 2015).
Saldaña, M.M., Aguilar, M.A., Aguilar, F.J. and Fernández, I. DSM extraction and evaluation from Geo-eye stereo imagery. In: ISPRS, Annals of the Photogrammetry, Remote Sensing and Spatial Information Sciences, Melbourne, Australia, Vol. I-4, 2012, pp. 113-117.
Samadzadegan, F., Ramzi, P. and Abootalebi, A., 2008. Capability assessment of high resolutionsatellite imagery for 3D reconstruction using RPC parameters. In: The International Archives of the Photogrammetry, Remote Sensing and Spatial Information Sciences, Beijing, China, Vol. XXXVII, Part B1, pp. 889-894.