THERMAL INFRARED INSPECTION OF ROOF INSULATION USING UNMANNED
AERIAL VEHICLES
Junjie Zhang a, *, Jaewook Jung a, Gunho Sohn a, Michael Cohen b
a GeoICT Lab, Department of Earth and Space Science & Engineering, York University, 4700 Keele Street, Toronto, ON M3J 1P3, Canada - (jason84, jwjung, gsohn)@yorku.ca)
b Industrial SkyWorks Inc., Toronto, Canada - ([email protected])
Commission III, WG III/4
KEY WORDS: Thermal Imaging, Roof Inspection, Unmanned Aerial Vehicles, Thermal Anomaly Detection, Radiation Calibration, Super-pixel, Markov Random Fields, Segmentation
ABSTRACT:
UAVs equipped with high-resolution thermal cameras provide an excellent investigative tool used for a multitude of building-specific applications, including roof insulation inspection. We have presented in this study a relative thermographic calibration algorithm and a superpixel Markov Random Field model to address problems in thermal infrared inspection of roof insulation using UAVs. The relative thermographic radiometric calibration algorithm is designed to address the autogain problem of the thermal camera. Results show the algorithm can enhance the contrast between warm and cool areas on the roof surface in thermal images, and produces more constant thermal signatures of different roof insulations or surfaces, which could facilitate both visual interpretation and computer-based thermal anomaly detection. An automatic thermal anomaly detection algorithm computer-based on superpixel Markov Random Field is proposed, which is more computationally efficient than pixel based MRF, and can potentially improve the production throughput capacity and increase the detection accuracy for thermal anomaly detection. Experimental results show the effectiveness of the proposed method.
1. INTRODUCTION
The use of Unmanned Aerial Vehicles (UAVs) in commercial sector is growing rapidly to provide aerial imaging solutions (Nex and Remondino 2013). UAVs equipped with high-resolution thermal cameras provide an excellent investigative tool used for a multitude of building-specific applications, including roof insulation inspection. They can graphically depict energy inefficiencies and identify wet insulations in the roof façade or elsewhere by showing temperature variations within the building surveyed with great efficiency, which leads to decreased operational and maintain costs, shortened investigation span and improvement of other safety issues (Tremco 2014b).
1.1 Thermal Infrared Inspection of Roof Insulation Using UAVs – General Principle
Roof inspection is typically performed to detect wet insulation, which is the number one enemy for build-up roofs. Identifying the wet insulation and recovering it at early stage can greatly reduce the maintenance cost and prolong the life span of a roof. This is where thermal infrared roof inspection stands above all other methods for this purpose. This contact and non-destructive method provides a fast, accurate and inexpensive way to locate areas of wet insulation and potential leaks that gives maintenance personnel the opportunity to limit their roof problem before they become costly.
Thermal patterns can be observed on the roof due to material differences in thermal capacity. During the day, sun heats the roof structure. As wet roof insulation has a much higher thermal capacity, it absorbs and retains more solar energy than dry roof insulation. After sunset, wet roof insulation radiates heat for a longer period of time and cools down slower, causing hot-spots
* Corresponding author
or thermal anomalies which can be detected by a thermal infrared camera during the window of uneven heat dissipation.
Traditionally, thermal infrared roof inspection is carried out as on-roof survey, which means sending a crew of people onto a roof at night. This is usually a labour intensity, time-consuming, and at times, a dangerous undertaking. The most efficient way to perform roof inspection is the aerial survey. Aerial survey can get a perspective and coverage not humanly possible. It has a straight-down view and better meets the needs in applications where large areas must be covered within a limited “window” of observation.
Without needing an onboard pilot, UAV can be operated by highly-trained technicians safely on the ground, fly to a precise height, scan the roof and return. Two important imager specifications to consider for UAV thermal infrared roof inspection to produce usable imagery are thermal sensitivity and image resolution (Wood 2013). The thermal sensitivity or noise-equivalent temperature difference (NETD) is the measurement of the smallest temperature difference that a thermal imager can detect in the presence of electronic noise. The lower the thermal sensitivity, the more detailed and less noise present on the thermogram. Highly sensitive (low-NETD) thermal imagers show more temperature differences, and thus more patterns. Image resolution is important for capturing clear images from a distance. Modern thermal infrared imagers used for roof inspection usually have an image resolution greater than 320x240. Higher resolutions are needed when observing the roof from greater distance, such as in a flyover.
1.2 Research Problems
For accurate detection and delineation of wet insulation in roof inspection, ground resolution is a more meaningful measure. One
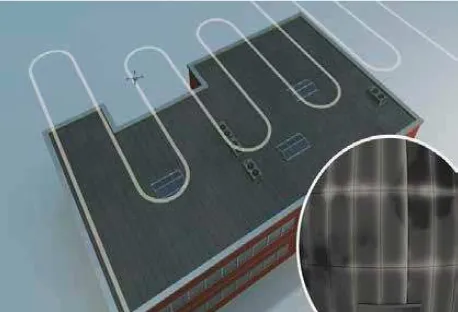
way to increase spatial resolution and get a wider viewpoint is to stitch multiple images together. The UAV scans the roof in a programmed pattern and takes hundreds of photographs, which are combined into a single large image of the roof, as shown in Figure 1. The orthomosaic photo generation with images acquired from a UAV platform follows the standard photogrammetric pipeline, which is generally well established (Armenakis 2013). The produced orthomosaic image is the starting point for thermal anomaly detection.
Figure 1: Conceptual illustration of UAV-based thermal infrared inspection of roof insulation (Tremco 2014a)
However, the orthomosaic image generation brings in the autogain control (AGC) problem of thermal cameras. For thermal imagers, heat energy emitted by objects is a particular scene is converted into a series of electrical signals, which are processed and automatically gain corrected for store and display. AGC algorithms automatically adjust the gain settings to render the image based on the relative thermal emission of objects in the scene, which means the grayscales of objects with the same apparent temperature are scaled differently in different scenes. This will produce complex thermal signatures for different roof structures. The image blending in the image mosaicking step will further distort the temperature variances and thermal patterns of the orthomosaic roof image.
After the orthomosaic roof images are generated, they are handed to thermographers to detect thermal anomalies and delineate their boundaries visually. The labour-centric and empirical thermography analysis significantly limits the efficiency and production throughput capacity of such practice. An automatic thermal anomaly detection method is in demand to improve the efficiency and enable UAV-based thermal infrared roof inspection.
1.3 Research Objectives
In this work, we aim to address the two research problems by proposing two methods on (i) relative thermographic calibration for autogain correction, and (ii) superpixel Markov Random Field (SMRF) for automatic thermal anomaly detection.
The relative thermographic radiometric calibration method attempts to address the autogain problem of the thermal camera. When compared the existing gain compensation methods (Brown and Lowe 2007), the algorithm enhances the contrast between warm and cool areas on the roof surface in thermal images, and produces more constant thermal signatures of different roof insulations, which facilitates both visual interpretation and computer-based thermal anomaly detection.
The superpixel Markov Random Field (SMRF) method deals with thermal anomaly detection by aggregating pixels of similar grayscales and spatial pattern into image regions – superpixels. A MRF is then formulated on superpixles rather than pixel level to perform segmentation and detect potential thermal anomaly areas, which improve both the efficiency and detection accuracy.
The paper is organized as follows: the methods are detailed in
FLIR’s Quark lightweight infrared camera is designed for easy mounting on a variety of UAVs for thermographic surveying and detect analysis applications such as roof inspection. Due to its low energy consumption, small size and modest weight, it has little to no impact on the flight time of the UAV it is mounted to. Despite the small proportions and low energy consumption, the FLIR Quark thermal imaging camera provides excellent quality thermal images with a resolution of 640 x 480 pixels and a thermal sensitivity of below 50 mK (0.05°C) (FLIR website). The thermal camera was mounted on an Aeryon Labs SkyRanger UAV system to collect thermal infrared images for rooftop inspection in this study. Figure 2 shows four thermal images of parts of a rooftop collected by the system.
Figure 2: Four thermal images collected by FLIR Quark thermal imaging camera onboard an Aeryon Labs SkyRanger.
2.2 Relative Thermographic Radiometric Calibration
The relative thermographic radiometric calibration consists of three steps: (i) base image selection, (ii) overlap region co-registration of neighbouring images, and (iii) pairwise relative thermographic calibration.
To implement a relative thermographic radiometric calibration, it is crucial to determine the base image for other images to calibrate to. One of the main consideration for our selection is to ensure a well thermal contrast between background (normal) regions and thermal anomalies. In another words, we want thermal anomalies to be distinct and clearly visible on ‘dark’ backgrounds after calibration.
Once base image is selection, we need to find a proper adjustment function to calibrate other images with respect to the base image.
This is done by two following steps of finding matching (overlap) regions of neighbouring images and establishing adjustment functions between matching images. The calibration should produce more constant thermal signatures of different roof insulation regions, e.g. thermal anomalies and background regions, which facilitates both visual interpretation by the thermographers and computer-based thermal anomaly detection. An overview of the three steps we proposed is illustrated in Figure 3.
Figure 3: Overview of our relative thermographic calibration method
2.2.1 Base image determination: In this step, we determine the base image as the one with the ‘darkest’ background, to ensure a well contrast between thermal anomalies and background region. For this purpose, we first apply Otus thresholding on all images to have a pre-segmentation of foreground and background regions. Then we determine the image with the lowest average pixel value of background region as the base image for other images to calibrate to.
2.2.2 Overlap zone localization: To establish an adjustment function of grayscales between an image with its neighboring reference image, we need to first localize the matching (overlap) regions between the two. One of the most effective ways to register sequential images is to perform homography estimations between successive images (pairwise alignment) (Kekec et al. 2014).
Typically, homographies are estimated between images by finding feature correspondences in those images. The most commonly used algorithms make use of point feature correspondences, though other features can be used as well, such as lines or conics. In this study, we extract point features on thermal images by SIFT algorithm (Lowe 2004).
(a)
(b) (c)
Figure 4: Matching region of neighbouring images in (a). (b) and (c) show left and right image overlapped by the homographic projected bonding box of its corresponding matching image, respectively.
As one of the most commonly used robust estimation method, RANSAC (Random Sample Consensus) is used to estimate the homographies of neighboring images. The idea of the algorithm is simple: for a number of iterations, a random sample of 4 correspondences is selected and a homography is computed from those four correspondences. Each other correspondence is then classified as inlier or outlier depending on its concurrence with . After all iterations are done, the iteration that contained the largest number of inliers is selected. can then be recomputed from all the correspondences that were considered as inliers in that iteration. A matching result is shown in Figure 4.
Once we have the homography estimated, we can project the range of the image to its neighbouring reference image to localize the matching region.
2.2.3 Relative Thermographic Calibration: We assume the histogram distributions of the overlap region of two neighboring images (one as a reference image , and the other as the image to be calibrated ) should be identical.
We first build adjustment functions → of the intensity values of the overlap regions of the two images using histogram matching. The basic principle of histogram matching is to compute the histogram of each image individually, then get their discrete cumulative distribution functions (CDFs). Let’s denote the CDF of the first image as while the CDF of the second image as . To make the histograms of the two images similar after calibration, we only need to find the mapping function , for each intensity value in , we find an intensity value in
such that:
= � �2∈[ , 55]min | − | , ∀ ∈ [0, 255] (1)
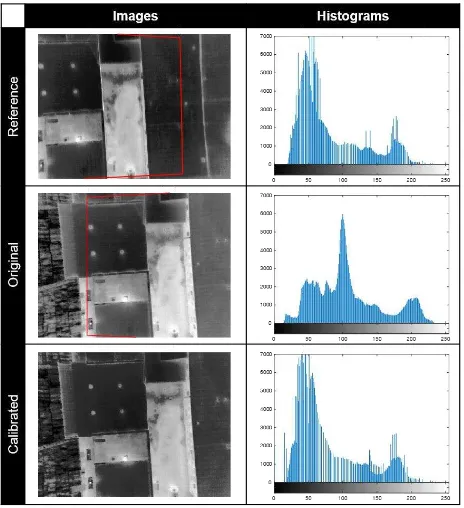
Then we apply the function � on to get the calibrated image . A calibration example in shown in Figure 5. As we can see from the figure, the histogram of the calibrated image is very similar with that of the reference image. Background of calibrated image is darker than the original image and contrast between backgrounds and thermal anomalies is enhanced.
Figure 5: Relative thermographic calibration. First column shows the reference (top), original (middle) and calibrated (bottom) images, while the second column shows the histograms of corresponding images.
2.3 Superpixel Markov Random Field (SMRF) for Thermal Anomaly Detection
A novel superpixel-based Markov Random Field method is proposed to automatically detect thermal anomalies from thermal infrared images of rooftops. In this Markov Random Field Model, aggregated regions of pixels with similar intensity or spatial properties, or superpixel, is treated as basic unit instead of operating at pixel level (Schick et al. 2012).
2.3.1 Superpixel Markov Random Field: In this paper, the improved version of simple linear iterative clustering (SLIC) algorithm is adopted to aggregate locally similar pixels into superpixels (Achanta et al. 2012). This method offers flexibility in the compactness and the number of superpixels it generates, while preserving object boundaries accurately. Serving as the smallest units in image space, superpixel like homogeneous regions is considered to provide important spatial support, thus more robust to noise and compensates for outlier and erroneous pixels. Further, with reduced nodes and adjacency graph, SMRF offers the advantage of simplicity and accuracy over pixel-based MRF .
2.3.2 Model Formulation: A probabilistic MRF is defined on the superpixel segmentation of thermal images to detect potential thermal anomalies on roof insulation. The problem is then to label each superpixel as thermal anomaly (T) or normal roof surface (R).
Let , denote the SMRF with a superpixel node ∈ and a pair ( , ) ∈ be an edge between neighboring segments and , then an energy can be defined with respect to the class labels � = {� , … , ��}, � ∈ { , } of superpixels . Generally, the energy can be defined as:
�| = ∑ |�
∈�
+ ∑ � , |� , �
, ∈� (2)
where |� expresses the unary potential of a superpixel node, and � , |� , � computes the prior potential between the superpixels and . In this application, those potential functions are designed based on the intensity features of superpixels. Detection results of the designed SMRF are presented in Section 3.2.
3. EXPERIMENTAL RESULTS
This section presents experimental results of our proposed relative thermographic calibration and superpixel Markov Random Field based thermal anomaly detection methods.
3.1 Relative Thermographic Calibration Results
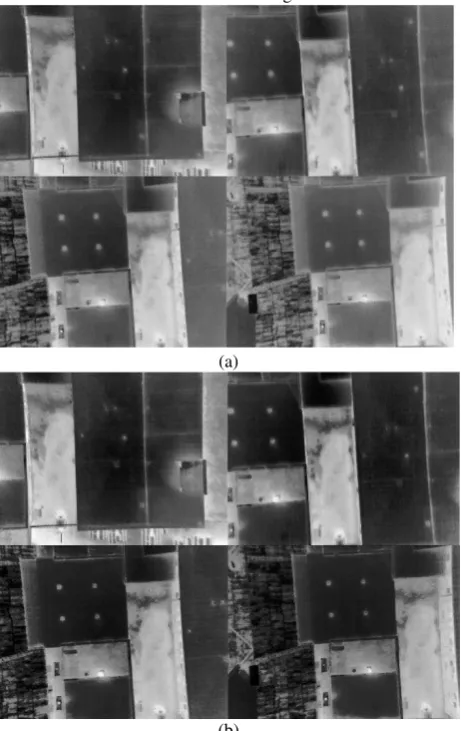
The relative thermographic calibration results are displayed in Figure 6. As can be seen, compared with original thermal images, the calibrated images appears darker and overall contrast of bright and dark areas are more distinct, which proves appropriate base image selected for calibration by our proposed method. Meanwhile, the greyscale variations across sequential images of corresponding roof surface regions become smaller after
calibration, indicating a more constant thermal signatures of the same surfaces in difference thermal images.
(a)
(b)
Figure 6: (a) Thermal images before relative thermographic calibration and (b) after.
(a) (b)
Figure 7: (a) CDFs of original thermal images and (b) CDFs of calibrated ones.
The effects of relative calibration can be more clearly observed by the CDF curves before and after calibration as shown in Figure 7. The CDFs clearly present a shift of grayscale towards lower end of 8-bits pixel value range of [0, 255]. The CDFs of calibrated images are also more similar with each other.
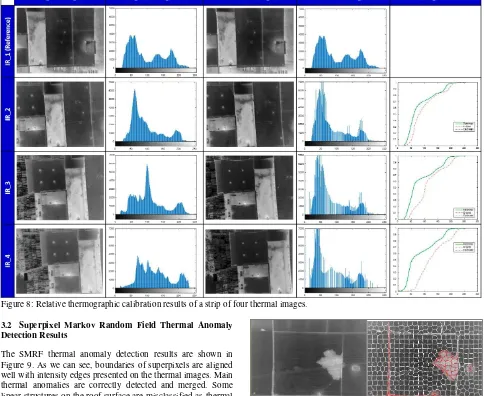
Some pairwise comparisons of thermal images and CDF shift respect to reference image before and after calibration are presented in detail in Figure 8. As can be seem in the last column, the CDFs of original thermal images are adjusted to be almost identical with the reference images after calibration.
Figure 8: Relative thermographic calibration results of a strip of four thermal images.
3.2 Superpixel Markov Random Field Thermal Anomaly Detection Results
The SMRF thermal anomaly detection results are shown in Figure 9. As we can see, boundaries of superpixels are aligned well with intensity edges presented on the thermal images. Main thermal anomalies are correctly detected and merged. Some linear structures on the roof surface are misclassified as thermal anomalies, however, because of their high thermal intensity. It is considered to incorporate shape/geometric priors in the energy term to exclude those parts from the final detection. We will also further extend the SMRF to take more spatial supported features, such as texture, into consideration, to pre-segment roof surfaces built of different materials showing distinctive thermal patterns to improve the detection accuracy in complex situations.
4. CONCLUSIONS
In this study, we have proposed a relative thermographic calibration algorithm and a superpixel Markov Random Field model to address problems in thermal infrared inspection of roof insulation using UAVs. The relative thermographic radiometric calibration algorithm is designed to address the autogain problem of the thermal camera. Results show the algorithm can enhance the contrast between warm and cool areas on the roof surface in thermal images, and produces more constant thermal signatures of different roof insulations or surfaces, which facilitate both visual interpretation and computer-based thermal anomaly detection. The automatic thermal anomaly detection algorithm designed based on superpixel Markov Random Field is more computationally efficient than pixel based MRF, which can potentially improve the production throughput capacity and increase the detection accuracy for thermal anomaly detection. Further work may include improvement of the SMRF model with more comprehensive energy terms to exclude false alarms.
Figure 9: Original thermal images (left column) and thermal anomaly detection results based on SMRF (right column). Thermal anomalies detected are marked with red boundaries.
ACKNOWLEDGEMENTS
The authors would like to thank Industrial SkyWorks Inc. for providing the thermal infrared roof insulation images for the research.
REFERENCES
Achanta, R., Shaji, A., Smith, K., Lucchi, A., Fua, P., & Su x0308 sstrunk, S. (2012). SLIC Superpixels Compared to State-of-the-Art Superpixel Methods. Pattern Analysis and Machine Intelligence, IEEE Transactions on, 34, 2274-2282
Armenakis, C. (2013). Small UAS for Geomatics. Ontario Professional Surveyor, 1-3
Brown, M., & Lowe, D.G. (2007). Automatic panoramic image stitching using invariant features. International Journal of Computer Vision, 74, 59-73
Kekec, T., Yildirim, A., & Unel, M. (2014). A new approach to real-time mosaicing of aerial images. Robotics and Autonomous Systems, 62, 1755-1767
Lowe, D.G. (2004). Distinctive image features from scale-invariant keypoints. International Journal of Computer Vision, 60, 91-110
Nex, F., & Remondino, F. (2013). UAV for 3D mapping applications: a review. Applied Geomatics, 6, 1-15
Schick, A., Bauml, M., & Stiefelhagen, R. (2012). Improving foreground segmentations with probabilistic superpixel Markov random fields. In, Computer Vision and Pattern Recognition Workshops (CVPRW), 2012 IEEE Computer Society Conference on (pp. 27-31): IEEE
Tremco (2014a). Collect and analyze building data from the roof, the façade and everywhere in between. In (pp. 1-4)
Tremco (2014b). Tremco Roofing Launches Aerial Building Scan Program. In (pp. 1-2)
Wood, S. (2013). Infrared Thermography for Roof Investigations. Interface, 1-11
.


