GEOMATICS APPROACH FOR ASSESSMENT OF RESPIRATORY DISEASE MAPPING
Mamta Pandey a, *, Varun Singh b, R. C.Vaishya c
a
GIS Cell,Motilal Nehru National Institute of Technology, Allahabad, India- [email protected] b
GIS Cell,Motilal Nehru National Institute of Technology, Allahabad, India- [email protected] c
GIS Cell,Motilal Nehru National Institute of Technology, Allahabad, India- [email protected]
Commission VI, WG VI/4
KEY WORDS: Air Quality Index, Fuzzy Inference System, Geostatistical Analysis, Respiratory risk map, IDW Technique, Gettis
Statistical Technique
ABSTRACT:
Air quality is an important subject of relevance in the context of present times because air is the prime resource for sustenance of life especially human health position. Then with the aid of vast sums of data about ambient air quality is generated to know the character of air environment by utilizing technological advancements to know how well or bad the air is. This report supplies a reliable method in assessing the Air Quality Index (AQI) by using fuzzy logic. The fuzzy logic model is designed to predict Air Quality Index (AQI) that report monthly air qualities. With the aid of air quality index we can evaluate the condition of the environment of that area suitability regarding human health position. For appraisal of human health status in industrial area, utilizing information from health survey questionnaire for obtaining a respiratory risk map by applying IDW and Gettis Statistical Techniques. Gettis Statistical Techniques identifies different spatial clustering patterns like hot spots, high risk and cold spots over the entire work area with statistical significance.
*Corresponding Author.
1. INTRODUCTION
Air pollution has reached a great concern globally due to manifestation of technological and scientific innovations in various countries in addition to the diverse activities of human beings for their sophistication. In late years, the urban and non urban pollution problems have grown in a big way and have taken on a very serious dimension. The unplanned growth, rapid evolution of industrialization has deteriorated the ambient air quality. Anthropogenic air pollution continues to be seen as a environmental and public health problem. Its seriousness lies in the fact that elevated pollutant levels are brought up in environments where harm to human health and welfare is more probable. Due to deterioration of ambient air quality our communities, countryside and even remote location changes from hour to hour, day to day and over longer time scales. Air quality can be seen poor when cause a reduction in visibility, soil building surfaces and damage materials, damage crops and other plants, cause adverse health effects.
Awareness of the air quality levels is important to those who suffer from sickness, caused by air pollution. For the general public information, the questioner usually will not be satisfied with raw data, time series plots, statistical analysis and other complex findings pertaining to air quality. So for analyzing and representing air quality status uniformly, air quality index (AQI) is an important tool that can assess the relative change in the concentrations of groups of pollutants. The relative change with respect to the concentrations of pollutants and respective standards. The index should be based on guidelines and take into account each and every aspect of air pollution. (Chelani et.al., 2002). Geomatics is the science and technology of gathering, storing, analyzing, interpreting, modelling, distributing and using georeferenced information so geomatics
is multidisciplinary and it comprises a broad range of disciplines including surveying and mapping, remote sensing, geographical information system (GIS) & global positioning system(GPS). (Boulos et.al. 2001). One of the most important is GIS technology that allows the organization, manipulation, analysis and visualization of spatial data, often uncovering relationships, patterns and trends (Scott et.al., 2010). So Geographic information systems (GIS) can be described as automated systems for the capture, storage, retrieval, analysis
and display of spatial data’. Geographic information system
(GIS) is a computer database management and mapping program that organizes, store and display large amounts of multipurpose information. With the help of epidemiological data by using GIS, construct disease maps for mapping populations at risk and analyzing trends over space and time. The aim of this paper is to develop, implement and evaluate methods and tools for visualizing and analyzing geospatial health data and enhance public health research. Disease maps can be used to assess the need for geographical variation in health resource allocation or could be useful in research studies of the relation of incidence to exploratory variables. Disease mapping usually chooses certain spatial interpolation method (s) and then creates a continuous surface of disease distribution according to geographically distributed sampling data of disease. There are all kinds of spatial interpolation methods, which include Inverse Distance Weighted (IDW), global polynomial, local polynomial, and Kriging etc.
2. STUDY AREA AND DATA COLLECTION
Sonebhadra is the 2nd largest district of Uttar Pradesh, India. The territory takes in an area of 6788 km2 and a population of
1,463,468 with a population density of 216 persons per km2. In this report, there are two locations Anpara & Renusagar are viewed of Sonebhadra district of Uttar Pradesh, India. This location covering an expanse of nearly 6 km2 with a population of 22,385 and extends from latitude 24.2060N and 82.7650 E. It hosts a thermal power station with a total set up capacity of power generation of 2830 MW. It is built aside Govind Ballabh Pant Sagar Lake and the Rihand River. Renusagar is a town in Sonebhadra district in the province of Uttar Pradesh, India. Renusagar is the home of Renupower, a 700 MW captive power plant which provides electricity to Hindalco Industries' operations in Renukoot. This location covering an expanse of nearly 5 km2 with a population of 20,000 approximately and extends from latitude 24.180 N and 82.790 E.
2.1 AIR POLLUTANT DATA COLLECTION
The present work was carried out during 2008-2011 and the concentrations of different air pollution viz. SO2, NO2, RSPM & SPM were monitored in the ambient air at two different locations where two monitoring stations, in Anpara Colony, Anpara and in Renusagar Colony, Renusagar are set up by UPPCB and these data are collected by UPPCB, Lucknow.
2.2 AGGREGATION OF HEALTH SURVEY DATA
This study utilizes data from epidemiological survey based on a standardized interviewer questionnaire referring to respiratory symptoms and diseases, life style and personal uses. This questionnaire gives information about 09 symptoms/diseases: Asthma, Bronchitis, Cough, Tuberculosis, Sinusitis, Rhinitis, Dermatitis, Eye Redness, Heart Problem (Presence/Absence of respiratory diseases/Symptoms).
3. AIR QUALITY INDEX
An air quality index is one of the important tools available for analyzing and representing air quality status uniformly so the air quality index (AQI) can be used as a measure to assess the relative change in the concentration of groups of pollutants. Air Quality Index (AQI) is specified as an overall scheme that transforms the weighted values of individual air pollution related parameters (e.g. SO2, NO2, SPM & RSPM etc.) into a single number or set of numbers. The result is a set of rules (for example, an equation) that translates parameter values into a more parsimonious form by means of numerical manipulation. (M. Sharma et.al. 2003). (Joshi P.C, et.al, 2011) describe the status of the air quality and its effects on human health, the ranges of index values have been categorized as: good, moderate, poor, very poor and severe. The AQI scale was divided into five categories describes the scope of air quality and its associated potential health issue. The indices use health based descriptions to provide meaningful data to the public.
3.1 A FUZZY INFERENCE SYSTEM BASED APPROACH FOR CALCULATING AQI
The fuzzy logic set was brought out in 1965 by Lotfi A. Zadeh that facilitates the mastery of a complicated system without knowledge of its mathematical description and represented as a precise problem-solving methodology that is capable to simultaneously handle numerical data and linguistic cognition. Fuzzy logic is really useful for addressing real world problem and uses variables like low, medium and high in place of true/false or yes/no variables. Peter Hajek et.al, 2009 describe
the general structure of FIS that contains a fuzzification process of input variables by membership functions, design base of IF – THEN rules (BRs) or automatic IF–THEN rules extraction from input data, operators (AND, OR, NOT) application in rules, implication and aggregation within these rules and process of defuzzification of gained values to crisp values. Fuzzy inference system is the real operation of mathematical function from a given input to an output using fuzzy logic. (Kumaravel R. et.al, 2012) describe two types of fuzzy inference method are Mamdani and Sugeno fuzzy inference methods. They apply antecedent and functional consequent whereas the Mamdani fuzzy model is founded on the collections of ten patterns with both fuzzy antecedent and consequent parameters. In this report we have used Mamdani fuzzy expert system with using four most significant input variables are SO2, NO2, RSPM & SPM to estimate AQI to design a fuzzy inference system. The methodology for the maturation of the fuzzy Inference System (FIS) based Air Quality Index (AQI) model involves the following steps that compute the end product of this FIS given the inputs: (a) Fuzzification of input and output variables. (b) Choice of membership functions for input and output variables. (c) Purpose of application rule base. (d) Defuzzification of IAQI.
The process of transforming crisp values into grades of membership for linguistic terms of fuzzy sets. The membership function is used to associate a grade to each linguistic term. (Upadhayay G.et. al, 2011). According to the prediction of air quality index of the two locations in Sonebhadra district, U.P.(India) as per Indian Air Quality criteria is discussed above so below given table 2 and 3 represented simulation results :
4. GEOMATICS APPROACH FOR RESPIRATORY DISEASE RISK MAP
Geomatics offers a digital lens for exploring the dynamic links between people, their health and well-being and changing physical and societal environments. With the assistance of GIS we can break down and addressing public health problems. In this paper with the aid of GIS we used to map and analyze the geographical distributions of populations at risk, health consequences and risk components to explore connections between risk factors and health issues and to address health problems. GIS makes it easier to search and analyze large databases of health events at a high degree of spatial disaggregation and to link data from surveillance systems to other information about the environment including information on the distribution of risk factors.
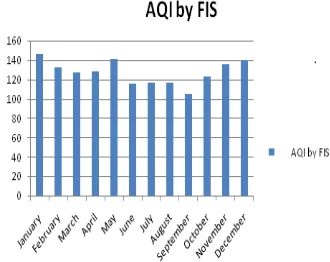
Figure 3: Graph of Air Quality Index of Anpara
Figure 4: Graph of Air Quality Index of Renusagar
4.1 USING STATISTICAL TECHNIQUES
GIS has a vital role in surveillance and control of the vector borne diseases as it is promising to scrutinize factors associated with the disease through the geocoding processes (Bhunia et.al, 2013). In the present study, we used several techniques under the umbrella of GIS. The application of GIS with spatial statistics including spatial autocorrelation and cluster analysis pertained to the other diseases, where it is often used to investigate and more clearly exhibit the spatial patterns of disease (Bhunia et.al, 2013). So the target of this investigation is the detection and enumeration of spatial heterogeneity in disease prevalence across a geographical area at high-prevalence or high risk areas.With the help of spatial statistics tool. We can describe and analyze how various geographical events occur.
4.1.1 SPATIAL AUTOCORRELATION
Spatial autocorrelation analysis was performed on the incidence rates of respiratory disease to test whether the cases were distributed randomly over space and, if not, to evaluate any identified spatial disease clusters for statistical significance (Kulldorff et.al, 1997). Global autocorrelation tests measure the tendency, across all data points, for higher (or lower) values to correlate more closely together in space with other higher (or lower) values than would be expected if the data points were drawn from a random distribution. Several tests of global
autocorrelation are available, with the Moran’s I being the most
common.(Jerrett et. Al, 2010).
4.1.2 CLUSTER-OUTLIER ANALYSIS
Moran’s I can only detect the presence of the clustering of similar values. The cluster-outlier type field distinguishes between a statistically significant (p<0.01) cluster of high values (High-High), cluster of low values (Low-Low), outlier in which a high value is surround primarily by low values (High-Low), and outlier in which a low value is surrounded primarily by high values (Low-High). A positive value for ‘I’ indicates that the feature is surrounded by features with similar values, such type of feature is part of a cluster. A negative value for ‘I’
indicates that the feature is surrounded by features with dissimilar values. Such a feature is an outlier.
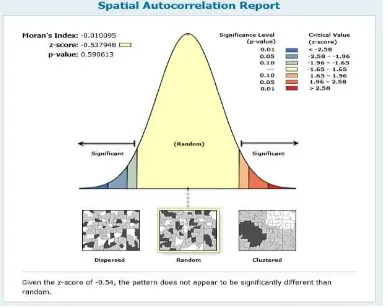
Figure 5: Spatial Autocorrelation of Anpara
Figure 6: Spatial Autocorrelation of Renusagar
In figure 5 & 6 that shows spatial autocorrelation where Moran’s I Index (Moran’s I) statistics used to evaluate autocorrelation in spatial distribution of respiratory diseases and test whether area with how incidence rates high or low. The
value of Moran’s I range from -1 to +1: a value close to ‘0’
indicates spatial randomness while a positive value indicates positive spatial autocorrelation and vice-versa and computed Z- score and p-value associated with Moran’s I, indicates the likelihood that point pattern could be a result of random chance.
The figure 7 & 8 Shows cluster analysis of study area where Local Moran’s index can only be interpreted within the context of the computed Z-score or p-value. 99% significance level (p<0.01) was used to indicate significant clusters of local autocorrelation.
4.1.3 HOTSPOT DETECTION AND ANALYSIS
Hotspot is defined as a condition indicating some form of clustering in a spatial distribution that to use Gettis-Ord Gi
* (d), which can separate clusters of high values from cluster of low values and this statistics is useful for determining the spatial dependence of neighbouring observations. The result expresses the Z-score and p-value of the calculated Gi*(d), represent the statistical significance of the spatial clustering of values, given the conceptualization of spatial relationships and the scale of
analysis. The output from Gi*(d) statistic identifies spatial clusters of high values (hot spots) and spatial clusters of low values (cold spots).
Figure 7: Cluster analysis of Anpara
Figure 8: Cluster analysis of Renusagar
4.2 USING INTERPOLATION TECHNIQUE FOR OBTAINING RESPIRATORY RISK MAP
Spatial interpolation refers to the estimation of values at unsampled points based on known values of surrounding points in space. It is commonly used in a Geographic Information System (GIS) to generate a continuous layer of data from a set of point data taken at sample locations (Li et.al., 2014).A common issue in spatial interpolation is the incorporation of data measured at various scales and over different spatial supports. This situation is frequently encountered in health studies where data are typically available over a wide range of scales (Goovaerts P. 2012). Disease mapping usually chooses certain spatial interpolation method like Inverse Distance Weighted (IDW), global polynomial, local polynomial and Kriging etc. and then creates a continuous surface of disease distribution according to geographically distributed sampling data of disease (Zhong S et.al, 2005). Inverse Distance
Weighted interpolation explicitly implements the assumption that things that are close to one another are more alike than those that are farther apart. To predict a value for any unmeasured location, IDW will use the measured values surrounding the prediction location. Those measured values closest to the prediction location will have more influence on the predicted value than those farther away. It weights the points closer to the prediction location greater than those farther away, hence the name inverse distance weighted (Li et.al, 2014) focuses on one of the deterministic models, called IDW (inverse distance weighting) interpolation. Some of the advantages for the IDW interpolation method include: (a) IDW interpolation is simple and intuitive. (b) IDW interpolation is fast to compute the interpolated values. Some of the disadvantages the IDW interpolation methods include: (a) The choice of IDW interpolation parameters are empirical (i.e., based on, concerned with or verifiable by observation or experience rather than theory or pure logic). (b) The IDW interpolation is always exact (i.e., no smoothing). (c) The IDW interpolation has sensitivity to outliers and sampling configuration (i.e., clustered and isolated points)
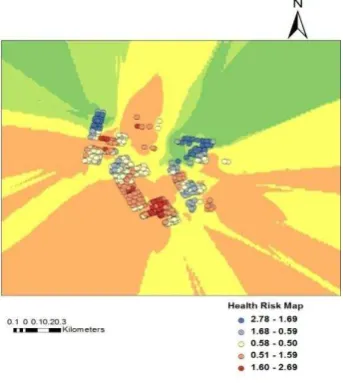
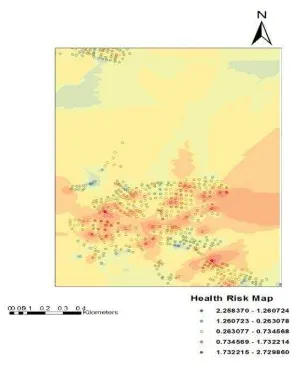
Figure 9: Health Risk map for Anpara area
In the figure 9 & 10 the spatial clusters of respiratory diseases that cover specific locations. Each hotspot analysis of respiratory incidence rate showed statistically significant hot spots (P<0.01) that show the larger Z-score is, the more intense the clustering of high values (hot spot); and the smaller the Z-score is, the more intense the clustering of low values (cold spot).In the above map, darker areas indicate statistically significant hotspots, while light areas represent significant cold spot areas. These maps show clear spatial patterns of respiratory disease. However the several authors suggest that the performance of kriging is better that IDW to interpolate and predict the pattern of distribution. But for this kind of mapping, the IDW interpolation is most appropriate because IDW interpolation is simple and intuitive and is fast to compute the interpolated values. In the above map IDW interpolation implements to predict a value for any unmeasured locations. IDW use the measured values surrounding the prediction location and these measured values closest to the prediction location that have more influence on the predicted values than those farther away thus it weights the points closer to the prediction location greater than those farther away.
Figure 10: Health Risk map for Renusagar area
5. CONCLUSION
In this study, air pollution in industrial area is currently an issue of great concern to the harmful impact on human health, agriculture productivity and forestry etc. The assessment of air quality of industrial area with four pollutants (SPM, RSPM, SO2, NO2) parameters use fuzzy logic concepts that calculate Air Quality Index (AQI).With the help of AQI standards that is prescribed by the Central Pollution Control Board of India (CPCB) we can assess the status of area, the higher the AQI value, greater is the level of air pollution and greater the damage to health. So this index uses health-based descriptions to provide meaningful information to the public. We used epidemiological sampled data that is collected from socio-economic questionnaire based survey to derive an environmental indicator of respiratory health. We applied spatial statistical tools to produce the distribution map of respiratory symptoms; these interpolated maps may be considered a good representation of the distribution of respiratory symptoms/diseases over area. From environmental point of view the study suggests the need to exploit a multilayer analysis to consider all the possible risk factors for population health status that focus on the presence of different kinds of pollution sources.
REFERENCES
Bhunia G S, Kesari S, Chatterjee N, Kumar Vand Das P, 2013. Spatial and Temporal variation and hotspot detection of kala-azar disease in Vaishalidistrict (Bihar), India, BMC Infectious Diseases, 1471-2334/13/64.
Boulos M N Kamel, 2001. Health Geomatics: An enabling suite of Technologies in Health and Healthcare, Journal of Biomedical Informatics 34, 195-219.
Chelani A.B., 2002. Formation of An Air Quality Index In India, International Journal of Environmental Studies (Taylor & Francis), Vol. 59(3), pp. - 331-342.
Dashore P, Jain S, Dashore N, Fuzzy Rule Based Metagraph model of Air Quality Index To Suggest Outdoor Activities,
International Journal of Computer Science & Engineering Technology (IJCSET), ISSN : 2229 – 3345, Vol.2 No.1. Goovaerts P, 2006. Geostatistical analysis of disease data: visualization and propagation of spatial uncertainty in cancer mortality risk using Poisson kriging and p-field simulation, International Journal of Health Geographics, 5:7.
Hajek Petr, 2009. Air Quality Indices and their Modelling by Hierarchical Fuzzy Inference Systems, WSEAS Transactions on Environment and Development, ISSN: 1790-5079, Issue 10, Volume 5
Jadsri S, Singhasivanon P 2006. Spatio-temporal effects of estimated pollutants released from an industrial estate on the occurrence of respiratory disease in Maptaphut Municipality, Thailand, International Journal of Health geographics, 5:48.
Joshi P. C, Semwal Mahadev, 2011. Distribution of air pollutants in ambient air of district Haridwar (Uttarakhand), India: A case study after establishment of State Industrial Development Corporation, International Journal of Environmental Sciences, Volume 2, No 1, ISSN 0976 – 4402.
Kulldroff M., 2009. Software for spatial and space-time scan statistics information management Services, Inc, SaTScanTM v8.0.
Kumaravel R, and Vallinayagam V, 2012. A Fuzzy Inference System For Air Quality In Using Matlab, Chennai, India, Journal of Environmental Research And Development, Vol. 7 No. 1A.
Li Lixin, 2014. Fast Inverse Distance Weighting-Based Spatiotemporal Interpolation: A Web-Based application of Interpolating Daily Fine Particulate Matter PM2.5 in the Contiguous U.S. Using Parallel Programming and k-d tree, International Journal of Environmental Research and Public Health, ISSN 1660-4601.
M. Sharma, M. Maheshwari, B. Sengupta, B.P. Shukla2003. Design of a website for dissemination of air quality index in India, Environmental Modelling & Software 18 (2003) 405-411, Science Direct.
Saxena R, Nagpal B.N., Das M.K. 2012. A Spatial statistical approach to analyze malaria situation at micro level for priority control in Ranchi district, Jharkhand, Indian J Med Res 136, pp 776-782.
Scott Lauren M., 2010, Spatial Statistics in ArcGIS, M.M. Fischer and A. Getis (eds.), Handbook of Applied Spatial Analysis: Software Tools, Methods and Applications, copyright Springer.
Upadhyaya G, Dashore N, 2010. Monitoring of Air Pollution by Using Fuzzy Logic, (IJCSE) International Journal on Computer Science and Engineering, Vol. 02, No. 07, 2010, 2282-2286.
Upadhyaya G, Dashore N, 2011. Fuzzy logic based model for monitoring air quality index, Indian Journal of Science and Technology, Vol. 4 issue 3, ISSN: 0974 – 6846.
Zhong S, Xue Y, 2005. Explore Disease Mapping of Hepatitis B Using Geostatistical Analysis Techniques, ICCS 2005, LNCS 3516, pp. 464 – 471, copyright Springer.
APPENDIX
3. METHODOLOGY FOR GEOMATICS APPROACH OF RESPIRATORY RISK MAP
Figure: 1 Flow Chart for Mapping of Health Risk
The five levels of AQI are depicted in given below Table: 1 (Joshi P.C, et.al, 2011)
Air Quality Index Value Remark
0-25 Clean air
26-50 Light air pollution
51-75 Moderate air pollution
76-100 Heavy air pollution
Above 100 Severe air pollution Air Pollutant Data
Epidemiological survey data Data Collection
Fuzzy Inference System based approach for calculating AQI
Geomatics approach for assessment of health risk
Analyses of disease occurrence on various geographical events
Evaluate Incidence rates of respiratory disease
Identification of spatial clusters
Create a continuous surface of disease distribution by using interpolation
Ambient Air Quality (Mamdani Fuzzy Model) 81 rules
Input Variables Output Variables
RSPM SPM SO2 NO2
Air Quality Index
Figure: 2 Fuzzy Logic based model for determination of Air Quality Index
Table 2: Result for prediction of AQI in Renusagar (2008)
S. No. Month(2008) SPM
µg/m3
RSPM
µg/m3
SO2
µg/m3
NO2
µg/m3
Result of AQI Remark
1. January 334 161 21.1 33.2 162 Severe air pollution
2. February 310 155 20.7 32.4 153 Severe air pollution
3. March 319 160 22.2 32.5 158 Severe air pollution
4. April 284 150 19.9 30.2 143 Severe air pollution
5. May 250 134 19.6 30.5 128 Severe air pollution
6. June 152 80 15.7 22.8 77.8 Heavy air pollution
7. July 165 80 15.6 23.5 81.9 Heavy air pollution
8. August 153 80 15.8 23.5 78.1 Heavy air pollution
9. September 233 125 18.8 28.6 120 Severe air pollution
10. October 211 113 18.1 28.1 108 Severe air pollution 11. November 272 143 18.8 20.7 133 Severe air pollution 12. December 307 164 19.5 32.8 157 Severe air pollution
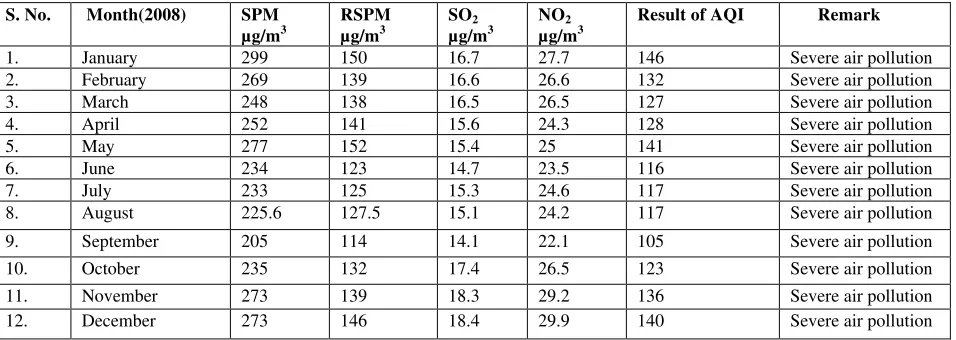
Table 3: Result for prediction of AQI in Anpara (2008)
S. No. Month(2008) SPM
µg/m3
RSPM
µg/m3
SO2
µg/m3
NO2
µg/m3
Result of AQI Remark
1. January 299 150 16.7 27.7 146 Severe air pollution
2. February 269 139 16.6 26.6 132 Severe air pollution
3. March 248 138 16.5 26.5 127 Severe air pollution
4. April 252 141 15.6 24.3 128 Severe air pollution
5. May 277 152 15.4 25 141 Severe air pollution
6. June 234 123 14.7 23.5 116 Severe air pollution
7. July 233 125 15.3 24.6 117 Severe air pollution
8. August 225.6 127.5 15.1 24.2 117 Severe air pollution
9. September 205 114 14.1 22.1 105 Severe air pollution 10. October 235 132 17.4 26.5 123 Severe air pollution
11. November 273 139 18.3 29.2 136 Severe air pollution 12. December 273 146 18.4 29.9 140 Severe air pollution