MULTI SENSOR DATA INTEGRATION FOR AN ACCURATE 3D MODEL
GENERATION
S. Chhatkuli a, *, T. Satoh a, K. Tachibana a
a
PASCO CORPORATION, Research & Development HQ, 2-8-10 Higashiyama, Meguro-ku, Tokyo, Japan
(cshahb7460, tuoost7017, kainka9209) @pasco.co.jp
IV/7 and V/4
KEY WORDS: 3D model, 3D TIN, Data fusion, Point cloud
ABSTRACT:
The aim of this paper is to introduce a novel technique of data integration between two different data sets, i.e. laser scanned RGB point cloud and oblique imageries derived 3D model, to create a 3D model with more details and better accuracy. In general, aerial imageries are used to create a 3D city model. Aerial imageries produce an overall decent 3D city models and generally suit to generate 3D model of building roof and some non-complex terrain. However, the automatically generated 3D model, from aerial imageries, generally suffers from the lack of accuracy in deriving the 3D model of road under the bridges, details under tree canopy, isolated trees, etc. Moreover, the automatically generated 3D model from aerial imageries also suffers from undulated road surfaces, non-conforming building shapes, loss of minute details like street furniture, etc. in many cases. On the other hand, laser scanned data and images taken from mobile vehicle platform can produce more detailed 3D road model, street furniture model, 3D model of details under bridge, etc. However, laser scanned data and images from mobile vehicle are not suitable to acquire detailed 3D model of tall buildings, roof tops, and so forth. Our proposed approach to integrate multi sensor data compensated
each other’s weakness and helped to create a very detailed 3D model with better accuracy. Moreover, the additional details like isolated trees, street furniture, etc. which were missing in the original 3D model derived from aerial imageries could also be integrated in the final model automatically. During the process, the noise in the laser scanne d data for example people, vehicles etc. on the road were also automatically removed. Hence, even though the two dataset were acquired in different time period the integrated data set or the final 3D model was generally noise free and without unnecessary details.
* Corresponding author.
1. INTRODUCTION
3D city modelling has been gaining quite a lot of attention recently. There are numbers of commercial software (for e.g. Street FactoryTM, Smart3DCaptureⓇ
, Agisoft PhotoScan, etc.) available that can convert imageries into realistic 3D city models without much, users’, intervention. An accurate 3D city model has several potential areas of application which ranges from simple 3D archiving to mapping, navigation, city planning, hydrodynamic simulation, etc. to name a few. Data sources from different sensors taken from different platforms have their own pros and cons. For example, airborne oblique imageries produce an overall decent 3D city models. However, an automatically generated 3D model, from aerial imageries, generally suffers from the lack of accuracy in deriving the 3D model of road under bridges, details under tree canopies, isolated trees, etc. Moreover, an automatically generated 3D model from aerial imageries also suffers from undulated road surfaces, non-conforming building shapes, loss of minute details like street furniture, etc. in many cases.
On the other hand, laser scanner data and images taken from mobile vehicle platform can produce more detailed 3D road model, street furniture model, 3D model of details under bridge, etc. However, laser scanner data and images from mobile vehicle are not suitable to acquire detailed 3D model of tall buildings, roof tops, etc.
Integration of multiple sensor data can add more information and reduce uncertainties to data processing (Gruen et al., 2013). Recently there has been an increase in interest to fuse multiple sensor data to create more detailed 3D models. Bastonero et al., (2014) demonstrated the fusion of point cloud generated from images acquired by remotely piloted aircraft system with the terrestrial point cloud generated from Terrestrial laser scanner. Gruen et al., (2013) presented a report on joint processing of UAV imagery and terrestrial mobile mapping system data for very high resolution city modelling. In most of these prior works, the multiple sensor data acquisition was conducted basically for the integration purpose.
Multi sensor data acquired during different time for different purposes could also serve the purpose of generating more detailed and geometrically more accurate 3D model if there is a novel way to integrate them.
In this paper, we have introduced a technique to integrate two different type of data sets: 3D model generated from aerial imageries and mobile vehicle laser scanned data (MMS point cloud) acquired at two different times. The data integration produced a final composite model with more details and better geometric accuracy, especially on the road surface, compared to the original 3D model generated from aerial imageries. The International Archives of the Photogrammetry, Remote Sensing and Spatial Information Sciences, Volume XL-4/W5, 2015
Indoor-Outdoor Seamless Modelling, Mapping and Navigation, 21–22 May 2015, Tokyo, Japan
This contribution has been peer-reviewed.
2. TEST SITE AND DATA SOURCES
The data integration test was performed between the 3D textured TIN model and long range MMS RGB point cloud acquired in the Yokohama area in Japan. The 3D textured TIN model was created by using a commercial software Street FactoryTM utilizing imageries taken by Leica RCD30 oblique camera during the month of January 2013. MMS RGB point cloud data was acquired by long range laser scanner system from Riegl called RIEGL VQ-450 during May 2013.
3. RESEARCH OBJECTIVE
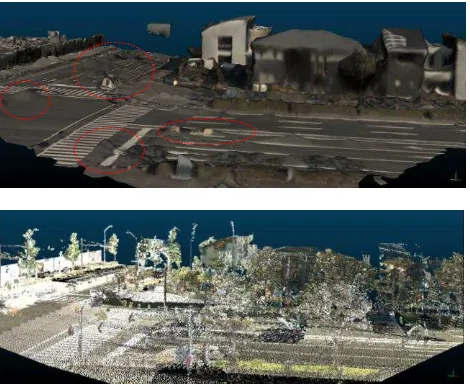
As seen in Figure. 1, the 3D model automatically generated from the oblique imagery suffered from an undulated road surface and non-confirming shapes of buildings at many places. On the other hand, MMS point cloud could capture more detailed features compared to the aerial imagery derived 3D maps, especially those that are closer to the sensor position. However MMS point cloud data also suffered from occlusion and also could not acquire details of buildings roof and so on. Hence, the purpose of this research is to formulate a workflow to create a 3D model with non-undulated road surface and with more accurate feature shapes by utilizing information from MMS point cloud. In additional to that, the further objective is to integrate the additional features like trees, electric poles, etc. from the MMS point cloud, which were missing on the original 3D model, onto the newly derived 3D model.
4. DATA INTEGRATION PROCEDURE & RESULTS
Figure 2 shows the general workflow of the proposed data integration technique. A brief description of the data integration technique that we have devised to achieve our objective is explained below.
4.1 3D model re-meshing
To evaluate and to select the common features between the MMS point cloud and the 3D model, it is desirable to have a similar resolution between the vertices of 3D model or 3D maps generated from aerial imageries and MMS point cloud. Hence, the 3D model or 3D maps derived from imagery (which will be called image model hereafter) was re-meshed to a refined size of about 50 cm. This is the first step in the data integration process.
4.2 MMS point cloud processing
Outliers of MMS point cloud were removed by utilizing a statistical outlier filter. Moving Least Square (MLS) smoothing was performed on the remaining data to smooth the small unevenness or undulation which is inherent to laser scanner
data. Then, eigenvalues (λ_1>λ_2>λ_3) of the point cloud data
were calculated. The eigenvalues were then normalized to extract shape descriptors D1, D2 and D3 where D1 = λ_1/
(λ_1+λ_2+λ_3), D2 = λ_2/ (λ_1+λ_2+λ_3), D3 = λ_3/ (λ_1+λ_2+λ_3). The point cloud with D1 >=0.85 were
considered as a linearly distributed and classified as a pole like features. On the remaining data, MLS smoothing was performed again. Eigenvectors of the point data were
calculated by performing plane fitting. Curvature analysis was then performed utilizing the computed eigenvectors. In the next step, the absolute values of eigenvectors (e1, e2, e3) were normalized. By evaluating the normalized eigenvectors Nx, Ny and Nz (where Nx = abs (e1)/ abs (e1) + abs (e2) + abs (e3), Ny
= abs (e2)/ abs (e1) + abs (e2) + abs (e3), and Nz = abs (e3)/ abs
(e1) + abs (e2) + abs (e3)), maximum and minimum eigenvalue
of curvature and the height information, the point cloud was then classified into (1) volumetric objects like trees, (2) planar flat objects like road pavement, side walk, and flat roof of a building, (3) planar vertical objects like walls, (4) curbs or road edges and (5) slopped objects in the respective order. The Point Cloud Library (PCL), which is an open source library for point cloud processing, was used to compute the parameters for point cloud classification (1). Moreover, for the classification, data clustering was performed by utilizing Jenks optimization method. Figure 3 shows the original MMS point cloud and the point cloud after classification utilizing the proposed technique.
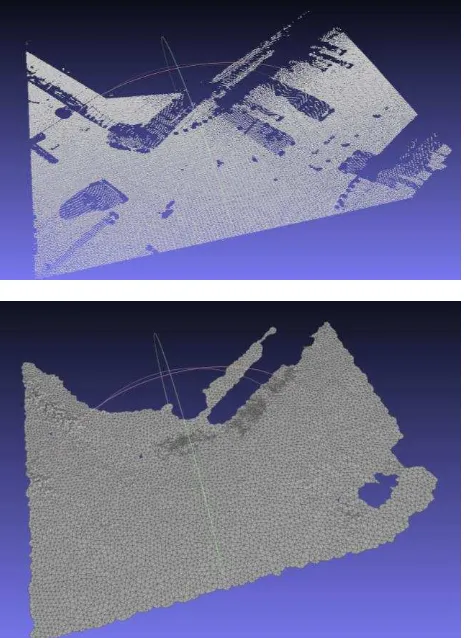
In the next step, from the classified point clouds, MMS point cloud that represent road surface was selected. As seen in Figure. 4 (top) the road MMS point cloud could suffer from holes due to the occlusion created by people on roads, vehicles, etc. Hence to fill up the holes and to create a uniformly Figure 1. 3D model from aerial imagery (top) & MMS RGB
point cloud (bottom) of the same area
Figure 2. Data integration workflow The International Archives of the Photogrammetry, Remote Sensing and Spatial Information Sciences, Volume XL-4/W5, 2015
Indoor-Outdoor Seamless Modelling, Mapping and Navigation, 21–22 May 2015, Tokyo, Japan
This contribution has been peer-reviewed.
distributed point clouds, 3D Delaunay triangulation of the MMS point cloud was performed. The 3D TIN was then refined and re-meshed to produce mesh of about 50 cm sizes (Figure. 4 (bottom). The 3D triangulation was achieved by utilizing CGAL open source project which provides geometric algorithm in the form of C++ library (2).
4.3 Data fusion
Data fusion was performed at a point cloud level. Hence the re-meshed image model was converted back to point cloud level by selecting the vertices from the 3D TIN model. Basically the fusion was achieved in two steps: namely Fusion_1 and Fusion_2. The fusion procedure is explained below.
Fusion_1: At first, the outer boundary of the resampled MMS
road data (Figure. 4 bottom) was generated. The vertices of the image model (obtained at step 4.1) were then overlaid on the boundary data. The vertices that were inside the boundary were then removed.
In the next step, the MMS point cloud (other than road data) that overlapped or were in close vicinity to the image model vertices was selected. The selected MMS point cloud was then subsampled to 50 cm to have the uniformity with image model’s vertices. Evaluating this down sampled non road MMS data, the image model’s vertices that overlapped or were in close vicinity of these point cloud were also removed.
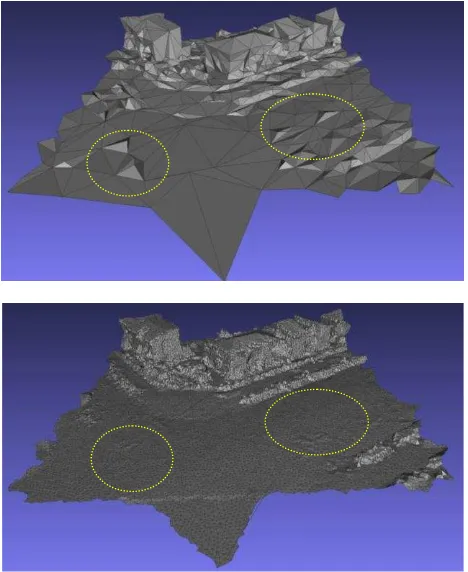
After the completion of this process, the vertices of image model that overlapped or were in close vicinity with MMS point cloud were all removed and ready for fusion with MMS derived data set. A first step of data fusion was then performed by fusing the remaining vertices of the re-meshed image model with the down sampled non-road MMS data and vertices of resampled MMS road data. A 3D TIN was created from the fused data set (Figure. 5 (bottom)). In the Figure 5 we can see that due to the fusion of MMS point cloud with image model, we could create a 3D model with a better geometric accuracy by removing the undulations, especially from the road surface.
On the newly derived 3D model, texture mapping was done by utilizing UV texture mapping technique.
Fusion_2: As seen in Figure 1, MMS point cloud could
capture more detailed features, compared to the aerial imagery derived 3D maps, especially those that are closer to the sensor position. Hence, in the second step of fusion, our goal was to add those additional features from MMS point cloud on the newly created textured 3D model. Unnecessary features like vehicles, people, etc., that were on the road surface, would be removed during the fusion process. During this second step of fusion process, at first the MMS point cloud data that represent road surface was removed. The remaining MMS point cloud was then compared against the vertices of 3D model obtained after Fusion_1 (Figure. 5 (bottom)). The MMS point cloud data that were within a close neighbourhood of the fused data was then removed. The remaining point clouds were details that were not included in the 3D model. However, in those point cloud there were still unnecessary features like cars, people etc. on the road surface. To remove those features, MMS data set were first clustered into different group utilizing their height information. The point cloud clustered as lower height classes and that were inside the road boundary were
Figure 3. MMS point cloud (top) & MMS point cloud after classification (bottom)
Figure 4. MMS point cloud representing road (top) & after holes filling (bottom)
The International Archives of the Photogrammetry, Remote Sensing and Spatial Information Sciences, Volume XL-4/W5, 2015 Indoor-Outdoor Seamless Modelling, Mapping and Navigation, 21–22 May 2015, Tokyo, Japan
This contribution has been peer-reviewed.
removed. This height threshold technique would remove vehicles, people, etc. that were on the road surface. However, features like road signs, traffic lights etc. that were overhanging inside the road boundary would be retained.
The filtered MMS point cloud was then integrated onto the textured 3D model obtained after Fusion_1.This completed the final step of fusion or Fusion_2.
Figure 6 (bottom) shows the final result obtained by utilizing the proposed data integration technique. The MMS data that overlapped with the image model were used to correct the geometric accuracy of the image model. We can clearly see that, due to our data integration technique, the undulations on the road surface that occurred in the original image model were corrected. Moreover, other details like isolated trees, electric poles, etc. which were not included in the original image model could also be added onto the newly derived model with most of the noise removed during the process.
5. CONCLUSION
We have developed an algorithm to integrate MMS RGB point cloud data with 3D model generated from aerial imageries. Due to the integration of MMS RGB point cloud with the original 3D model generated from aerial imageries, our proposed technique was successful in creating a 3D model with most of the undulation removed from the road surface. The approach to integrate multi sensor data compensated each
other’s weakness and helped to create a very detailed 3D
model with better accuracy. Moreover, the additional details like isolated trees, street furniture, etc. which were missing in the original 3D model could also be integrated in the final model automatically. During the process, the noise in the MMS RGB point cloud data for example people, vehicles etc. on the road were also automatically removed. Hence, even though the two dataset were acquired in two different time period the integrated data set or the final 3D model was generally noise free and without unnecessary details.
References from Other Literature:
Bastonero, P., Donadio, E., Chiabrando, F., & Spanò., 2014. Fusion of 3D models derived from TLS and image-based techniques for CH enhanced documentation, In: ISPRS Annals of the Photogrammetry, Remote Sensing and Spatial Information Sciences, Vol. II-5, Riva del Garda, Italy, pp. 73- 80
Gruen, A., Huang, X., Qin, R., Du, T., Fang, W., Boavida, J., & Oliveira, A., 2013. Joint processing of UAV imagery and terrestrial mobile mapping system data for very high resolution city modelling, In: International Archives of the Photogrammetry, Remote Sensing and Spatial Information Sciences, Rostock, Germany, Vol.XL-1/W2, UAV-g2013, pp. 175-182
References from websites:
(1) http://pointclouds.org/ (3April. 2015)
(2) http://www.cgal.org/index.html (3 April. 2015) Figure 6. 3D model from aerial imagery (top), MMS RGB
point cloud of the same area (mid) and data obtained after integration of the above two data sets (bottom) Figure 5. Original 3D TIN generated from aerial imagery (top)
& final 3D TIN after data fusion (bottom)
The International Archives of the Photogrammetry, Remote Sensing and Spatial Information Sciences, Volume XL-4/W5, 2015 Indoor-Outdoor Seamless Modelling, Mapping and Navigation, 21–22 May 2015, Tokyo, Japan
This contribution has been peer-reviewed.