Yield and Quality of Forage Soybean
Craig C. Sheaffer,* James H. Orf, Thomas E. Devine, and Jane Grimsbo Jewett
ABSTRACT R7 stage (one seed pod at mature color; 50% of leaves
yellow) produced forage that was similar in quality to Tall forage soybean [Glycine max(L.) Merr.] cultivars in maturity
alfalfa harvested at early bloom. When soybean was groups V, VI, and VII have been developed to supply forage. Our
objective was to determine the effect of harvest date and row spacing grown as an intercrop with corn, the forage CP concen-on the forage yield and quality of these new soybean cultivars. We tration was increased by 30 to 43% compared with corn grew forage and standard grain soybean in Minnesota with harvests alone (Herbert et al., 1984). Forage yields of the soybean in early and late September. Average maturity of tall forage soybean and corn intercrop were comparable with those of the was R3 (early harvest) to R4 or R5 (late harvest) and average maturity corn monoculture. Sod-seeding soybean into tall fescue of grain soybean was R6 (early harvest) to R7 (late harvest). Herbage
(Festuca arundinaceaSchreb) increased forage yield by of forage soybean was mostly leaves and stems at both harvests,
300% compared with tall fescue alone and increased whereas herbage of grain soybean contained an average of 400 and
the CP concentration of the forage by 10% (Ocumpaugh 595 g kg21pods at the early and late harvests, respectively. There
et al., 1981). was no harvest date3soybean entry interaction for forage yield or
forage quality. Forage and grain soybean had similar forage yields As soybean matures from stage R1 (beginning bloom) (|8.8 Mg ha21). Because adapted grain soybean was more mature to R7, the leaf proportion declines (Fehr et al., 1971).
and had a greater pod proportion than forage soybean, grain soybean Changes in the stem proportion with soybean matura-had greater crude protein (CP) and lower fiber concentration than tion are less consistent. Hintz and Albrecht (1994) re-forage soybean. Average re-forage CP for re-forage and grain types was
ported that the leaf concentration of grain soybean de-146 and 218 g kg21, respectively, while neutral-detergent fiber (NDF)
creased from 708 g kg21 at R1 to 168 g kg21 at R7. concentration was 523 and 400 g kg21, respectively. Decreasing row
Meanwhile, the stem fraction increased from 292 g kg21 width from 76 to 25 cm increased forage yield 0.8 Mg ha21but had
at R1 to 383 g kg21at R5 (beginning seed development) no effect on total herbage quality.
and then declined to 283 g kg21at R7 as the pod and seed components increased.
The harvest of soybean for forage at R6 (full seed)
S
oybean was introduced to the USA in the midto R7 maximizes both the dry matter yield and forage 1800s and was initially promoted as a forage crop quality (Hintz et al., 1992; Munoz et al., 1983). However, (Williams, 1897; Arny, 1926). Hackleman (1924) con- while the dry matter yield of soybean forage typically cluded that “...soybeans are the best annual nitrogenous increases with advancing maturity, changes in the forage seed and hay-producing plant.” By the late 1940s, the quality are less consistent. This is due to changes in the focus had shifted almost entirely from forage to soybean proportions of the leaf, stem, and pod fractions as well grain production. Soybean use for forage in the northern as the translocation of nutrients to the grain and in-Midwest has been limited to situations where there is creases in the lipid concentration of the seed (Hanway a shortage of forage from other sources or when frost and Weber, 1971). Hintz et al. (1992) reported that damage limits grain harvest. There is now an opportu- CP concentrations declined from R1 to R3, remained nity for increased use of soybean as a forage in Midwest constant between R3 and R5, and increased from R5 crop rotations because of the increased use of corn (Zea to R7. Whole-plant fiber concentrations increased from mays L.) silage and the decreased reliance on alfalfa R1 to R5 and decreased from R5 to R7.
(Medicago sativaL.) by livestock producers. Reducing row spacing from a traditional width of 76 Limited research on use of soybean for forage shows cm to 25 cm or less is recommended to enhance soybean the potential benefits of soybean as a forage crop. Hintz grain yields (Naeve, 1999). In southern Minnesota, grain et al. (1992) reported forage yields from grain-type soy- yields are typically increased by about 5%. Likewise, bean in Wisconsin ranging from 2.4 to 7.4 Mg ha21,
Hintz et al. (1992) reported that for grain soybean, a depending on the stage of maturity at harvest. They 20-cm row spacing produced more forage than a 76-cm concluded that grain soybean cultivars harvested at the row spacing. They also observed that decreasing row spacing increased the stem diameter but that row spac-ing had no effect on the total forage quality.
C.C. Sheaffer, J.H. Orf, J.G. Jewett, Dep. of Agron. and Plant
Genet-ics, Univ. of Minnesota, 1991 Upper Buford Circle, St. Paul, MN Tall forage soybean cultivars in maturity groups V, 55108; and T.E. Devine, USDA-ARS, Weed Sci. Lab., BARC, 10300
Baltimore Blvd., Beltsville, MD 20705. Minnesota Agric. Exp. Stn.
Abbreviations:ADF, acid-detergent fiber; ANOVA, analysis of vari-Journal Series no. 00-13-0143. Received 27 Jan. 2000. *Corresponding
ance; CP, crude protein; NDF, neutral-detergent fiber; NIRS, near-author ([email protected]).
infrared reflectance spectroscopy; WISC.BK, Wisconsin Black soybean.
Published in Agron. J. 93:99–106 (2001).
PA 5-2-1 that were developed at Beltsville, MD. Two types VI, and VII that reach a height of 1.5 to 2 m and have
of standard grain soybean was included: ‘Sturdy’, developed high yield potential have recently been released (Devine
at the University of Minnesota as a high-yielding grain soybean and Hatley, 1998; Devine et al., 1998a, 1998b). The
(Orf et al., 1991); and ‘IA 2008 BC’, developed at Iowa State forage soybean cultivars ‘Derry’, ‘Donegal’, and
‘Ty-University. Wisconsin Black (WISC.BK; PI 153271), an older rone’ had average forage yields of 9.3 Mg ha21compared
forage-type soybean of Belgian origin, was also included with 7.6 Mg ha21 for grain soybean cultivars in Iowa,
(USDA-ARS, 1999). The maturity groups for soybean entries New York, and Virginia. These new forage soybean are shown in Table 1.
cultivars have different relative maturity and stem traits The 1996 experiment was planted on 28 May at Rosemount than grain cultivars and may respond differently to and 30 May at Waseca. The experimental design was a split-changes in row spacing and harvest date. Our objective split plot with three replicates. Whole-plot treatments were two harvest dates, subplot treatments were two row widths (25 was to determine the effect of the harvest date and row
and 75 cm), and sub-subplot treatments were seven soybean spacing on the forage yield and quality of forage soybean
entries. The plot size and seeding rate were similar to those in the upper Midwest.
used in 1995, except that the plots contained either four rows spaced 75 cm apart or eight rows spaced 25 cm apart. The
MATERIALS AND METHODS soybean entries included five forage types (Tyrone, Derry,
PA 5-2-1, Donegal, OR 5-12-16) and two standard grain types Separate studies were conducted in 1995 and 1996 at the
(Sturdy and IA 2007 R).
Rosemount Experiment Station, Rosemount (448439N, 938069 Each year, the soybean forage yield was measured by
har-W), MN and at the Southern Experiment Station, Waseca
vesting a 2- by 5- m area from the middle of each plot. A (448049N, 938319W), MN. The soil at Rosemount was a
Wau-randomly collected 10-plant subsample of soybean forage was kegan silt loam (fine-silty over sandy-skeletal, mixed mesic manually cut to a 2-cm height and was chopped for analysis Typic Hapludoll), and at Waseca, it was a Webster clay loam
of the plant moisture and forage quality. The whole-(fine-loamy, mixed mesic Typic Haplaquoll). The Soil pH,
plant moisture content was determined by drying a 500-g sam-extractable P, and exchangeable K were maintained at 6.5, 70
ple at 608C for 48 h. An additional 10-plant subsample was kg ha21, and 300 kg ha21, respectively, at Rosemount. At
staged for maturity (Fehr et al., 1971) and separated into Waseca, the soil pH, extractable P, and exchangeable K were
leaf, stem, and pod fractions before drying. The leaf fraction 6.5, 50 kg ha21, and 300 kg ha21, respectively. Weed control
included leaves and petioles, the stem fraction included stems, at both locations was achieved by a preemergence application
and the pod fraction included pods and seeds. of trifluralin [2,6-dinitro-N, N-dipropyl-4-(trifluoromethyl)
Soybean forage was harvested on 31 Aug. and 19 Sept. 1995 benzenamine] at 1 kg a.i. ha21. The previous crop at both
at Rosemount and on 8 and 22 Sept. 1995 at Waseca. All of locations was corn. the entries were harvested at the early harvest date at both
The 1995 experiment was planted on 5 May at Rosemount
locations. Only the seven forage types were harvested at the and 2 May at Waseca. The experimental design was a
split-late harvest date in 1995 because the early maturing grain plot with three replicates. Whole plots were two harvest dates
types and WISC.BK had significant leaf loss. In 1996, the and subplots were 10 soybean entries. All of the plots were
seven soybean entries were harvested on 3 and 19 September 3 m wide by 6 m long, with soybean planted at 90 kg ha21
at Rosemount and on 10 September and 1 October at Waseca. (475 000 seeds ha21). The plots contained 4 rows spaced 76
The early and late harvest dates were selected based on an cm apart. The soybean entries planted in 1995 included seven
average target maturity stages of R6 and R7 for the grain forage types: The varieties Tyrone, Derry, and Donegal
(De-soybean, respectively. Because of the diversity of maturity vine and Hatley, 1998; Devine et al., 1998a, 1998b) and the
among the entries, it was not possible to harvest all of the experimental lines OR 13-12-3, OR 14-11-2, OR 19-12-2, and
entries at a similar maturity.
In 1995, forage quality analysis was conducted on OR
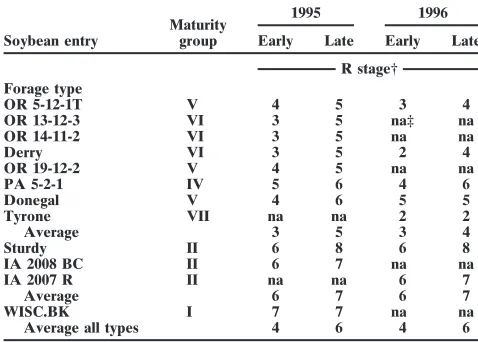
13-Table 1. Maturity of soybean entries at early and late harvests in 12-3, OR 14-11-2, PA 5-2-1, Sturdy, and WISC.BK at the early
1995 and 1996. Maturity was defined using R-stage criteria harvest and on OR 13-12-3, OR 14-11-2, and PA 5-2-1 at the
(Fehr et al., 1971). late harvest. In 1996, forage quality analysis was done on
1995 1996 Derry, PA 5-2-1, Tyrone, and Sturdy at both harvests.
Whole-Maturity plant and plant fraction samples were ground to pass a 1-mm
Soybean entry group Early Late Early Late
screen. Forage dry matter subsamples of whole-plant samples R stage† and plant components of selected entries were analyzed for
Forage type CP, acid-detergent fiber (ADF), and NDF via near-infrared
OR 5-12-1T V 4 5 3 4 reflectance spectroscopy (NIRS). Spectra for NIRS analysis
OR 13-12-3 VI 3 5 na‡ na
were collected with a NIRSystems1 (Silver Springs, MD)
OR 14-11-2 VI 3 5 na na
Derry VI 3 5 2 4 Model 6500 scanning monochrometer with a range of 400 to
OR 19-12-2 V 4 5 na na 2500 nm. A calibration set of samples was selected. Samples
PA 5-2-1 IV 5 6 4 6
in the calibration set were analyzed for NDF and ADF
ac-Donegal V 4 6 5 5
cording to the procedures of Goering and Van Soest (1970)
Tyrone VII na na 2 2
Average 3 5 3 4 and for Kjeldahl CP (Kjeldahl N36.25). Results from analysis
Sturdy II 6 8 6 8 of the calibration set were used to develop prediction
equa-IA 2008 BC II 6 7 na na
tions using the Infrasoft International (ISI, Port Matilda, PA)
IA 2007 R II na na 6 7
Average 6 7 6 7 NIRS 3 v. 4.0 software program Calibrate, with the modified
WISC.BK I 7 7 na na
Average all types 4 6 4 6
1Mention of a proprietary product does not constitute a
recommen-† R3, beginning pod; R4, full pod; R5, beginning seed; R6, full seed (greed
dation or warranty of the product by the University of Minnesota and seed); R7, beginning maturity.
Table 3. Forage yields of soybean entries at Rosemount and
Wa-partial least squares regression option (Shenk and Westerhaus,
seca, MN in 1995 and 1996.
1991). The standard errors of calibration for CP, ADF, and NDF were 8.0, 9.4, and 8.3 g kg21, respectively, and theR2
1995† 1996
values for all variables were.0.99.
Soybean entry Rosemount Waseca Rosemount Waseca
Mg ha21
Statistical Analysis
Forage type
OR 5-12-1T 7.1 9.1 10.7 10.6
Data on the yield; proportion of leaf, stem, and pod
compo-OR 13-12-3 6.7 9.6 na‡ na
nents; and forage quality of the leaf, stem, pod, and total
OR 14-11-2 7.7 9.0 na na
herbage were subjected to analyses of variance via the general Derry 6.8 9.6 10.0 9.8 linear models (GLM) procedure of SAS (SAS Inst., 1996). OR 19-12-2 6.7 8.0 na na
PA 5-2-1 6.5 8.4 10.3 9.1
Years were analyzed separately because different soybean
Donegal 6.4 9.2 10.0 8.8
entries and different experimental designs were used in 1995 Tyrone na na 10.7 9.6 and 1996. In 1995, data on the forage yield and the leaf, Average 6.8 9.0 10.3 9.6 stem, and pod proportion for the seven forage soybean were Grain type
analyzed as a split-plot design, with the harvest dates as whole Sturdy 7.4 7.2 10.4 8.5
IA 2008 BC 6.7 9.0 na na
plots and the entries as subplots. The homogeneity of error
IA 2007 R na na 10.7 9.5
variances was tested on the within-location analyses using
Average 7.1 8.1 10.6 9.0
Bartlett’s test (Steel and Torrie, 1980). The combined analysis
WISC.BK 5.5 5.9 na na
across two locations was done following the procedures of
Entries LSD0.05§ 1.4 1.3 0.6 0.8
Gomez and Gomez (1984). Data on the forage yield and the leaf,
Types LSD0.05¶ 0.4 0.8 0.6 0.5
stem, and pod proportion for 10 soybean entries in the early
† Data from early harvest only in 1995 due to lack of late harvest data harvest were analyzed in a split-plot design, with the entries as
for grain soybean and Wisconsin Black (WISC.BK). In 1996, data are treatments and combined across two locations. Forage quality averaged for early and late harvests.
data for five soybean entries at early harvest were analyzed in ‡ Data not available; entry not evaluated.
§ Least significant difference (a50.05) for comparing soybean entries a split-plot design, with the entries as treatments and combined
within location-years. across two locations. The randomized complete block analysis
¶ Least significant difference (a50.05) for comparing averages of soybean showed significant location 3 entry interactions for forage types within location-years.
quality, so three contrasts of entries were tested within the locations: grain type vs. forage type, grain type vs. WISC.BK,
tions, and there were only magnitude differences between the and forage type vs. WISC.BK.
harvests. Therefore, a grain type vs. forage type contrast was In 1996, data on the forage yield and the leaf, stem, and tested within locations following the split split-plot analyses. pod proportion from seven entries, including five tall forage
types and two grain types, were analyzed as a split split-plot design, with the harvest dates as whole plots, the row widths
RESULTS AND DISCUSSION
as subplots, and the soybean entries as sub-subplots combined
across two locations. A similar split split-plot design combined
Harvest Date and Soybean Entry Effects
across locations was used to analyze the forage quality dataThe dry matter yield of soybean forage increased from from Derry, PA 5-2-1, Tyrone, and Sturdy. There were
signifi-the early to late harvest date at both locations and for cant location3harvest date3entry interactions for the total
all soybean entries in 1995 and 1996. There were no herbage CP, ADF, and NDF; however, the entry rankings
remained the same in all four location3harvest date combina- location3harvest date or harvest date3entry
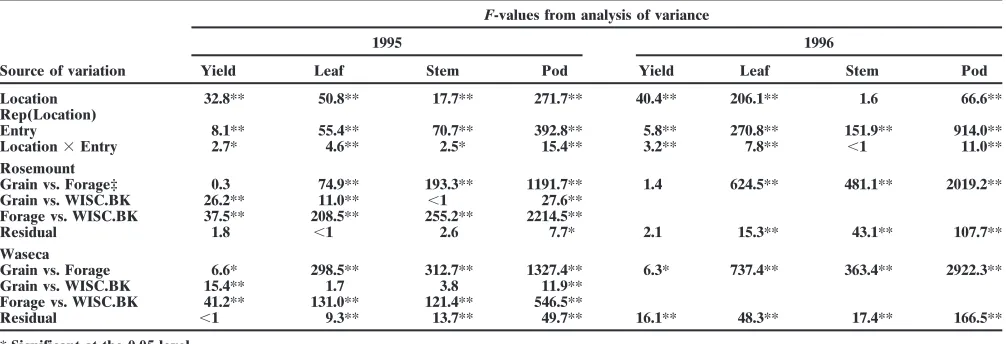
interac-Table 2. Analysis of variance for total herbage yield and proportions of leaf, stem, and pod material in grain, forage, and Wisconsin Black (WISC.BK) soybean in 1995 and 1996†.
F-values from analysis of variance
1995 1996
Source of variation Yield Leaf Stem Pod Yield Leaf Stem Pod
Location 32.8** 50.8** 17.7** 271.7** 40.4** 206.1** 1.6 66.6**
Rep(Location)
Entry 8.1** 55.4** 70.7** 392.8** 5.8** 270.8** 151.9** 914.0**
Location3Entry 2.7* 4.6** 2.5* 15.4** 3.2** 7.8** ,1 11.0**
Rosemount
Grain vs. Forage‡ 0.3 74.9** 193.3** 1191.7** 1.4 624.5** 481.1** 2019.2**
Grain vs. WISC.BK 26.2** 11.0** ,1 27.6**
Forage vs. WISC.BK 37.5** 208.5** 255.2** 2214.5**
Residual 1.8 ,1 2.6 7.7* 2.1 15.3** 43.1** 107.7**
Waseca
Grain vs. Forage 6.6* 298.5** 312.7** 1327.4** 6.3* 737.4** 363.4** 2922.3**
Grain vs. WISC.BK 15.4** 1.7 3.8 11.9**
Forage vs. WISC.BK 41.2** 131.0** 121.4** 546.5**
Residual ,1 9.3** 13.7** 49.7** 16.1** 48.3** 17.4** 166.5**
* Significant at the 0.05 level. ** Significant at the 0.01 level.
† 1995 analysis includes early harvest data only. In 1996, the analysis is for an average of early and late harvests.
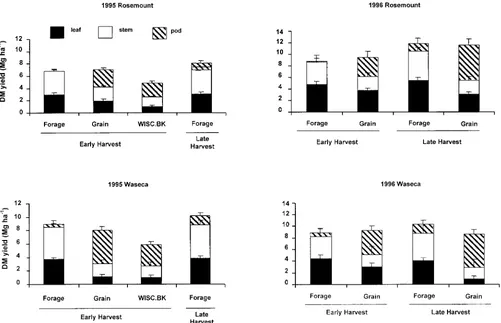
Fig. 1. Average total dry matter (DM) yield and proportion of leaves, stems, and pods of forage, grain, and Wisconsin Black (WISC.BK) soybean at early harvest and forage soybean at late harvest in 1995; and forage and grain soybean at early and late harvest in 1996. In 1995, data are the average for the forage soybean OR 5-12-1T, Derry, Donegal, OR 13-12-3, OR 14-11-2, OR 19-12-2, and PA 5-2-1; and for the grain soybean Sturdy and IA 2008 R. In 1996, the forage soybean were Tyrone, Derry, Donegal, OR 5-12-1T, and PA 5-2-1; and the grain soybean were Sturdy and IA 2007 R.
tions for the yield in 1995. The location3harvest date and forage types had similar average yields at Rose-mount in both years, but the forage types had average interaction in 1996 was due to magnitude differences,
and the harvest date 3 entry interaction was due to yields that were slightly higher at Waseca. These small differences in yield between forage and grain types con-magnitude differences plus one entry rank change; thus,
we will discuss the harvest date means for yield. In 1995, trast to the 23% yield advantage reported in Iowa (De-vine et al., 1998a) for the forage type, Derry, compared an average maturity increase for all soybean types from
R4 at early harvest to R6 at late harvest coincided with with a standard grain soybean, ‘Sherman’. A comparison of the average 1995 grain-type yields from the early a 20% yield increase—from 7.9 to 9.2 Mg ha21. Likewise,
in 1996, the yield increased by 20%—from 9.0 to 10.8 Mg harvest with the average forage-type yields from the late harvest showed greater yields from the forage types ha21from early to late harvest. This was accompanied by
increases in the average maturity—from R3 to R4 for at both locations (Fig. 1) even though the late-harvested forage types still lagged in maturity compared with the forage types and from R6 to R7 for grain types. An
enhanced forage yield with maturity is consistent with early-harvested grain types. The grain and forage soy-bean yields were similar at the early and late harvests results of Hintz et al. (1992) and Munoz et al. (1983),
who reported increases in soybean forage yield up to R7. at both locations in 1996 even though the forage types lagged an average of three R stages behind the grain The soybean entries differed in yield, but the
differ-ences were not consistent over years and locations types at both harvests. These results suggest that forage soybean would have superior dry matter yields to the within forage or grain types. The soybean type and
ma-turity group were confounded in this study because the grain types if harvested at a similar maturity stage. Our maximum forage yields (|9 and 10 Mg ha21 for grain
forage-type soybean entries were in maturity groups V,
VI, or VII, but the grain entries and WISC.BK were in and forage soybean, respectively) exceeded those re-ported by Hintz et al. (1992) for grain soybean in south-maturity groups I or II. Contrast analysis revealed that
there were yield differences between the soybean types ern Wisconsin. Our soybean forage yields were often greater than those reported for commonly used single-at Rosemount and Waseca in 1995 and single-at Waseca in 1996
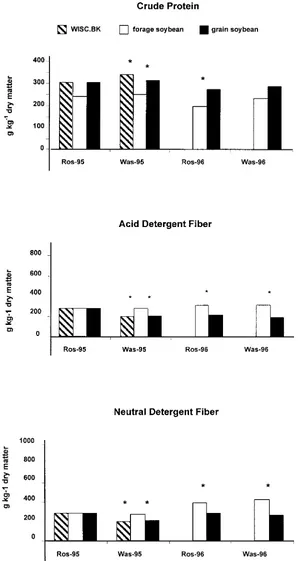
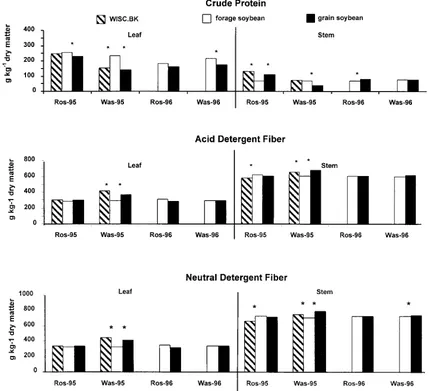
Fig. 2. Average crude protein (CP), acid-detergent fiber (ADF), and neutral-detergent fiber (NDF) concentrations of soybean leaves and stems at early harvest for forage, grain, and Wisconsin Black (WISC.BK) soybean at Rosemount (Ros) and Waseca (Was), MN. In 1995, data are average for the forage soybean OR 13-12-3, OR 14-11-2, and PA 5-2-1; and for the grain soybean Sturdy and Wisconsin Black (WISC.BK). In 1996, the forage soybean were Derry, PA 5-2-1, and Tyrone. The grain soybean was Sturdy.
Millsp. & Chase] and pearl millet [Pennisteum ameri- in 1995, the leaf proportion declined by about 12%, the stem proportion declined by 6%, and the pod
propor-canum(L.) Leeke] (Martin and Linn, 1992).
Maturity differences due to the harvest date and soy- tion increased nearly 300% between the early and late harvest even though the pod fraction was very small. bean type interacted to affect the proportion of leaves,
Fig. 3. Average crude protein (CP), acid-detergent fiber (ADF) and neutral-detergent fiber (NDF) concentrations in pods at early harvest for forage, grain, and Wisconsin Black (WISC.BK) soybean at Rosemount (Ros) and Waseca (Was), MN. In 1995, data are the average for the forage soybean OR 13-12-3, OR 14-11-2, and PA 5-2-1; and the grain soybean Sturdy and WISC.BK. In 1996, the forage soybean were Derry, PA 5-2-1, and Tyrone. The grain soybean was Sturdy. By harvest at Rosemount in 1995, and at both locations in 1996, the only forage soybean with pods was PA 5-2-1; thus, the values for the pod quality at these three site-years are the averages for PA 5-2-1.
types in 1995. For grain and forage types in 1996, the comparison of forage and grain soybean in 1996 showed that the pod contribution to the forage yield of forage leaf proportion declined by about 34%, the stem
propor-tion did not change, and the pod proporpropor-tion nearly dou- soybean was minimal at the early harvest and 10 g kg21 at the late harvest. The leaf contribution was 400 g kg21 bled between the early and late harvests. The leaf, stem,
and pod proportion of forage soybean differed from for forage types at the late harvest. The pod contribution for the grain soybean increased from 350 g kg21at the grain types and WISC.BK at all locations and for all
years. early harvest to 530 g kg21at the late harvest at
Rose-mount and from 450 to 660 g kg21at Waseca. Increases Within a harvest date, forage soybean had more leaf
and stem yield and less pod yield than grain soybean in the grain-type pod proportion were accompanied by decreases in the leaf proportion and an increase in matu-each year at both locations and more leaf and stem yield
and less pod yield than WISC.BK at the early harvest rity—from R6 to R7. Hintz and Albrecht (1994) re-ported a leaf, stem, and pod proportion of 168, 282, and in 1995 (Fig. 1). A comparison of soybean types for the
leaf, stem, and pod proportion was possible at the early 485 g kg21, respectively, for grain soybean at R7. Thus, the grain soybean and WISC.BK in this study had leaf, harvest in 1995. The dry matter yield of forage soybean
at an average maturity of R3 was composed of approxi- stem, and pod proportions that were similar to previous reports; but the less-mature forage soybean entries had mately equal proportions of leaf and stem material, with
very little yield from pods. The more mature (R6 and less pod and more leaves.
Maturity and possibly other differences between soy-R7) grain entries and WISC.BK contained 440 and 580 g
Table 4. Analysis of variance for total herbage crude protein (CP), acid-detergent fiber (ADF), and neutral-detergent fiber (NDF) for soybean in 1995 and 1996.†
F-values from analysis of variance
1995 1996
Source of variation CP ADF NDF CP ADF NDF
Location ,1 19** 34** 73** 5 ,1
Rep(Location)
Entry 489** 219** 163** 121** 311** 290**
Location3Entry 4* 3* 8** 2 2 3
Rosemount
Grain vs. Forage‡ 536** 546** 414** 87** 515** 489**
Grain vs. WISC.BK 5 14** 2
Tall vs. WISC.BK 415** 356** 347**
Residual 27** 35** 38** 6* 10** 2
Waseca
Grain vs. Forage 767** 283** 237** 322** 399** 369**
Grain vs. WISC.BK ,1 19** 21**
Tall vs. WISC.BK 719** 132** 97**
Residual 35** 4 ,1 15** ,1 2
* Significant at the 0.05 level. ** Significant at the 0.01 level.
† Early harvest data only in 1995. In 1996, the analysis was for an average of early and late harvests.
‡ Grain soybean entry was Sturdy in 1995 and 1996. Forage soybeans in 1995 were OR 13-12-3, OR 14-11-2, and PA-5-2-1. In 1996, forage entries were Tyrone, Derry, and PA 5-2-1. Wisconsin Black (WISC.BK) was only planted in 1995, not in 1996.
stems, and pods. As previously reported by Hintz et al. whether a forage soybean at R6 or R7 would have forage quality comparable to that of a grain soybean at R6 (1992) for grain soybean, the stems of all of the soybean
entries had a lower forage quality; that is, they had lower or R7. CP and a higher ADF and NDF than the leaves or pods.
Row Width Effects
In our study, the leaves of forage soybean usually had
higher CP than the leaves of grain soybean because Reducing the row width increased the soybean dry forage soybean had no significant seed production (Fig. matter yields at both locations. Soybean that was sown 2 and 3). During grain formation, N is translocated from in narrow (25 cm) rows produced an average dry matter the leaves to grain (Hanway and Weber, 1971). Grain yield of 10.3 Mg ha21 while soybean sown in wide (76 and WISC.BK soybean had pods that were higher in cm) rows produced an average dry matter yield of 9.5 quality than leaves, but for forage types with little seed Mg ha21 (LSD 5 0.3 Mg ha21). There was no row development, the pods often had a forage quality that width3entry interaction, which indicated that narrow was similar to leaves. The lower pod CP and higher pod rows increased yields similarly for both forage and grain ADF and NDF in forage than in grain soybean was soybean. Hintz et al. (1992) had reported a 1.2 Mg ha21 likely due to a greater proportion of high-quality seeds yield increase for grain soybean as the row spacing de-in the more mature grade-in types. By harvest at Rose- creased from 76 to 20 cm.
mount in 1995, and at both locations in 1996, the only The forage quality of the total herbage, leaves, and forage soybean with pod development was PA 5-2-1; pods was not affected by the row width, but the row thus, the values for the pod quality at these sites are width had a small effect on the stem ADF and NDF
averages for this entry. concentration. The stem ADF concentration was 596
Contrast analysis showed that forage soybean differed and 603 g kg21, respectively, for narrow and wide rows from grain and WISC.BK soybean for the CP, ADF, (LSD 5 7 g kg21). The stem NDF concentration was and NDF of the total herbage at both locations (Table 707 and 719 g kg21, respectively, for narrow and wide 4). Forage soybean had lower CP and higher ADF and
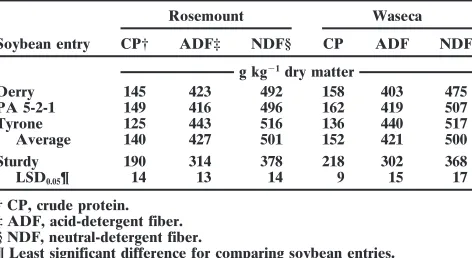
NDF in the total herbage than either grain or WISC.BK Table 5. Forage quality in total herbage of soybean entries at at both locations in 1995 (Table 5) and lower CP and Rosemount and Waseca, MN at early harvest in 1995.
higher ADF and NDF in the total herbage than grain Rosemount Waseca
soybean at both locations in 1996 (Table 6). This
differ-Soybean entry CP† ADF‡ NDF§ CP ADF NDF
ence in the total herbage forage quality was related to
g kg21dry matter
the maturity; therefore, it was related to the leaf, stem,
OR 13-12-3 143 486 565 132 469 541
and pod proportion of the forage as well as the seed OR 14-11-2 137 492 571 145 459 534
proportion of the pod fraction. Forage from mature PA 5-2-1 160 461 539 158 447 529
Average 147 480 558 145 458 535
grain and WISC.BK soybean with a large proportion of
Sturdy 230 375 467 233 325 386
high-quality pod material had the highest forage quality.
WISC.BK 220 395 475 230 367 440
Less-mature forage soybean with little pod and seed
LSD0.05¶ 10 13 13 9 22 27
had the lowest forage quality. The forage soybean PA
† CP, crude protein. 5-2-1 had the highest CP and the lowest ADF and NDF
‡ ADF, acid-detergent fiber. of the tall types in 1995, and it had similar quality as § NDF, neutral-detergent fiber.
Table 6. Forage quality in total herbage of soybean entries at REFERENCES Rosemount and Waseca, MN. Average of early and late
har-Arny, A.C. 1926. The influence of time of cutting on the quality of
vests in 1996.
crops. Agron. J. 18:684–703.
Rosemount Waseca Devine, T.E., and E.O. Hatley. 1998. Registration of ‘Donegal’ forage soybean. Crop Sci. 38:1719–1720.
Soybean entry CP† ADF‡ NDF§ CP ADF NDF
Devine, T.E., E.O. Hatley, and D.E. Starner. 1998a. Registration of g kg21dry matter
‘Derry’ forage soybean. Crop Sci. 38:1719.
Derry 145 423 492 158 403 475 Devine, T.E., E.O. Hatley, and D.E. Starner. 1998b. Registration of PA 5-2-1 149 416 496 162 419 507 ‘Tyrone’ forage soybean. Crop Sci. 38:1720.
Tyrone 125 443 516 136 440 517 Fehr, W.R., C.E. Caviness, D.T. Burmood, and J.S. Pennington. 1971. Average 140 427 501 152 421 500 Stage of development descriptions for soybeans,Glycine max(L.)
Sturdy 190 314 378 218 302 368 Merrill. Crop Sci. 11:929–931.
LSD0.05¶ 14 13 14 9 15 17 Goering, H.K., and P.J. Van Soest. 1970. Forage fiber analysis:
Appa-ratus, reagents, procedures, and some applications. USDA Agric. † CP, crude protein.
Handb. 379. U.S. Gov. Print. Office, Washington, DC. ‡ ADF, acid-detergent fiber.
Gomez, K.A., and A.A. Gomez. 1984. Statistical procedures for ag-§ NDF, neutral-detergent fiber.
¶ Least significant difference for comparing soybean entries. ricultural research. 2nd ed. John Wiley & Sons, New York. Hackleman, J.C. 1924. The future of the soybean as a forage crop.
Agron. J. 16:228–236.
Hanway, J.J., and C.R. Weber. 1971. N, P, and K percentages in rows (LSD59 g kg21). These forage quality differences
soybean (Glycine max (L.) Merrill) plant parts. Agron. J. 63: are not likely to have practical significance, especially
286–290.
because differences in the total herbage forage quality Herbert, S.J., D.H. Putnam, M.I. Poos-Floyd, A. Vargas, and J.F. were apparently determined mostly by the pod fraction. Creighton. 1984. Forage yield of intercropped corn and soybean Our results on the impact of row spacing on yield and in various planting patterns. Agron. J. 76:507–510.
Hintz, R.W., and K.A. Albrecht. 1994. Dry matter partitioning and quality are consistent with those of Hintz et al. (1992),
forage nutritive value of soybean plant components. Agron. J. except we saw no effect of the row spacing on the CP
86:59–62.
concentration, and our forage yield differences were Hintz, R.W., K.A. Albrecht, and E.S. Oplinger. 1992. Yield and quality
somewhat less. of soybean forage as affected by cultivar and management practices.
Agron. J. 84:795–798.
Martin, N.P., and J.G. Linn. 1992. Forage quality of alternative crops. Minnesota Forage Update. Vol. 17. No. 5. Minnesota Forage and
CONCLUSIONS
Grassland Counc., St. Paul.
Munoz, A.E., E.C. Holt, and R.W. Weaver. 1983. Yield and quality Previous research (e.g., Hintz et al., 1992) has shown
of soybean hay as influenced by stage of growth and plant density. that the greatest yield and highest quality of soybean
Agron. J. 75:147–149.
forage is reached at R6 to R7 when the pod proportion Naeve, S. 1999. Planting. p. 8–11.InJ.M. Bennett (ed.) The Minnesota of the total forage is high. This occurs because the grain Soybean Field Book. Univ. Minnesota Ext., St. Paul, MN. component is high in quality, and the plant has not had Ocumpaugh, W.R., A.G. Matches, and V.D. Luedders. 1981.
Sod-seeded soybeans for forage. Agron. J. 73:571–574. significant leaf loss. In Minnesota, tall forage soybean
Orf, J.H., J.W. Lambert, and B.W. Kennedy. 1991. Sturdy soybean. in maturity groups V, VI, and VII did not reach these
Crop Sci. 31:486.
R stages at harvest in late September before a killing SAS Institute. 1996. SAS System for Windows. Release 6.12. SAS frost. Although the forage yield was similar to adapted Inst., Cary, NC.
Shenk, J.S., and M.O. Westerhaus. 1991. Population structuring of maturity group II cultivars, the forage quality was less
near infrared spectra and modified partial least squares regression. because of a lack of grain production. A tall forage
Crop Sci. 31:1548–1555.
soybean cultivar that is adapted to upper Midwest lati- Steel, R.G.D., and J.H. Torrie. 1980. Principles and procedures of tude and climatic conditions and will reach the R6 stage statistics. McGraw Hill, New York.
USDA-ARS National Genetic Resources Program. 1999. Germplasm by harvest may have an improved dry matter yield and
Resources Information Network (GRIN). [Online database]. Avail-similar forage quality compared with existing tall forage
able at http://www.ars-grin.gov/cgi-bin/npgs/html/acchtml.pl?1136681 cultivars. Forage and grain soybean should be grown in (accessed 16 July 1999; verified 16 Dec. 1999).
25-cm rows rather than 76-cm rows to increase the dry Williams, T.A. 1897. The soy bean as a forage crop. USDA Farmers’ Bull. 58.