PERSISTENT OBJECT TRACKING WITH RANDOMIZED FORESTS
Tobias Klinger and Daniel Muhle
Leibniz Universitaet Hannover Institute of Photogrammetry and GeoInformation Nienburger Strasse 1, 30167 Hannover, Germany [email protected], [email protected]
http://www.ipi.uni-hannover.de/
Commission III/5
KEY WORDS:Learning, Detection, Decision Support, Tracking, Real-time, Video
ABSTRACT:
Our work addresses the problem of long-term visual people tracking in complex environments. Tracking a varying number of objects entails the problem of associating detected objects to tracked targets. To overcome the data association problem, we apply a Tracking-by-Detection strategy that uses Randomized Forests as a classifier together with a Kalman filter. Randomized Forests build a strong classifier for multi-class problems through aggregating simple decision trees. Due to their modular setup, Randomized Forests can be built incrementally, which makes them useful for unsupervised learning of object features in real-time. New training samples can be incorporated on the fly, while not drifting away from previously learnt features. To support further analysis of the automatically generated trajectories, we annotate them with quality metrics based on the association confidence. To build the metrics we analyse the confidence values that derive from the Randomized Forests and the similarity of detected and tracked objects. We evaluate the performance of the overall approach with respect to available reference data of people crossing the scene.
1 INTRODUCTION
In recent years pedestrian tracking has been used successfully in time-critical applications such as self-organising geosensor net-works, for driver assistance and human-machine-interaction. In such applications, where tracking results support autonomous op-eration of a system, e.g. in Jaenen et al. (2012), speed and the robustness of the data association strategy for linking detections to targets, is of crucial importance. Traditionally, data associa-tion is based on geometry and appearance based similarity cues. When a new object enters a scene, the observations are rare from the scratch but usually accumulate over time. Due to the varying appearance of the detected objects under egomotion or changing camera orientation, an adaptive representation of the target’s ap-pearance is advantageous.
We apply Tracking-by-Detection and focus on the association problem. The strategy for association is twofold. A motion model predicts the state of the target in the upcoming frame and gates the association. An appearance model in terms of a classifier is learnt for each target which calculates the probability of each detection being triggered by the target. Related work on pedes-trian tracking has presented promising results when using such instance specific classifiers. These usually require to be built in-crementally, to adapt new information and to eventually discard old one. We therefore employ a variant of Randomized Trees (Amit and Geman, 1997) that has been introduced towards online learning (Saffari et al., 2009). Ensembles of Randomized Trees, referred to as Random Forests by (Breiman, 2001) construct po-tentially strong classifiers by aggregating simple decision trees. Due to their modular setup they suit well for online applications. Splits can be introduced when new samples arrive, which allows for incremental learning and entire trees may be discarded, which supports adaptation. The aggregation of single trees allows par-allel processing of the Random Forest (Sharp, 2008), which sup-ports the real-time capability. Furthermore, Random Forests are inherently useful for multiclass problems, which allows classify-ing a varyclassify-ing number of object classes with a sclassify-ingle classifier.
2 RELATED WORK
SLAM (Ozuysal et al., 2010), and single-instance tracking (Saf-fari et al., 2009). The latter work suggests the use of Random Forests in an on-line learning framework. It has been shown that the classifier may be learnt incrementally with results compara-ble to offline training. Using Random Forests in opposition to boosting has various advantages. On one hand, they are able to learn multiple classes within each single instance of a tree, on the other they are more robust against label noise, i.e. single mis-associations vanish in the abundance of trees.
The remainder of the paper is divided in sections about the clas-sification strategy (Section 3) and the application to data associ-ation (Section 4). We present experimental results in Section 5 and conclude in 6.
3 CLASSIFICATION STRATEGY FOR SUPPORTING DATA ASSOCIATION
For data association we apply a classification strategy that mod-els a tracked person as an individual class. We apply a variant of Randomized Forests, which selects both variable index and split variables ramdomly, thus referred to as Extremely Random-ized Forest (ERF). In the following, we explain the principles of Randomized Forests and our strategy for using them as instance specific classifier.
3.1 Randomized Forests
Randomized Forests are ensembles of binary decision trees, each of which is grown upon a different subset of the given training data. Each node in a tree is appointed with a test function that consists of an index pointing to an element of the feature vector and a threshold which decides for the left or right propagation of a sample passed through the tree. The test function is chosen as the one that, according to a quality measurement, scores best among a randomly generated set of test functions with respect to the index. If also the threshold is chosen at random, the Random Forest is referred to as Extremely Random Forest (Geurts et al., 2006). For our work we employed the Online-Random Forests (ORF) of Saffari et al. (2009), where extremely randomised trees are used for online learning. Each leaf node in a tree stores the class conditional probability density of all samples that have reached that leaf either during offline-training or in the update-phase of online learning. A node decides to split, if a purity constraint is broken, given that an adequate number of samples has been seen so far and a maximum depth is not yet reached. For classification, a samplesis passed through each treetout of allTtrees in the forest and obtains the probabilitypt(k|s)of class k ∈ Y that is stored in the leaf node the sample reaches. The classification result over all of the trees in the forest amounts to the normalised sum of probabilities,
p(k|s) = 1
T T
X
t=1
pt(k|s) (1)
Class assignment is then finding the maximum of (1) among all available classes inY:
C(s) = arg max
k∈Yp(k|s) (2)
Adaptivity of the classifier to changing appearance of the targets is given by the ability of the ORF to discard entire trees. As crite-rion for discarding a tree, the Out-Of-Bag-Error (OOBEt) esti-mate can be assessed using the fact that some trees are not being trained on the entire training data due to the Poisson process of on-line bagging (bootstrap aggregating), see Saffari et al. (2009) and Oza and Russell (2001) for details.
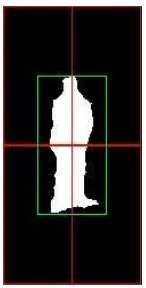
Figure 1: Regions based on a detection that are used for training, relative to a detection (white region indicates foreground region belonging to the detected object) in the image domain.
3.2 Generation of the Feature Vector
For every sample features are calculated from the hue, saturation and intensity (HSI) values of all foreground pixels inside the re-gion given by a detection. Since changes in the articulation of body parts reflect in the distribution of HSI values inside the de-tected region, we strive to compensate that effect by calculating mean values of HSI as features row-wise. We argue that the aver-aging is reasonable, since the variance of a person’s appearance along a horizontal line is negligible and articulation mainly af-fects the distribution of HSI values column-wise. The feature vector is resized to 100 entries per channel, i.e. to 300 elements per sample. The elements of the feature vector are mean centered and normalised to a standard deviation of one.
3.3 Training and Updating
The purpose of the classifier for data association is to gather knowledge about the appearance of a tracked object, in order to assess the similarity when applied to a detection. The classifier is hence designed to learn one specific class for each object being actively tracked, and one rejection class, which enables the ne-glection of an association. If a detection has been triggered by a target for which a class already exists, the response of the classi-fier when tested on that detection should be high for that class. If the detection stems from a target that has not been trained yet, the distribution of class responses should be flat. The feature vectors are calculated from regions inside the detection windows. If a new object class is introduced, an additional set of six samples is derived from the original position of the detection. Four samples are calculated by shifting the detection by one pixel column- and linewise, and two features are calculated from resizing the de-tected region by plus/minus one pixel. The additional samples make the classifier more robust against the localisation uncer-tainty of the detector and allow the Forest to apply bagging from a pool of different features. We also train a rejection class that al-lows the omission of an association if the rejection class obtains the maximum likelihood. The green rectangle in Figure 1 marks an original detection, as represented by the white foreground re-gion, which is used for extracting negative samples by shifting (red rectangles). The rejection class is trained on four adjacent regions that are defined in the neighbourhood of the detection, aligned as depicted by the configuration of the red rectangles in Figure 1.
2 3 4 5 6 7 8 9 10 11 12 13 0
0.05 0.1 0.15 0.2 0.25
# Samples
Classification Error
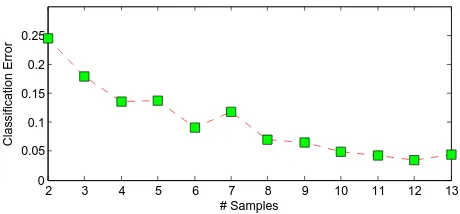
Figure 2: Average classification error as function of the number of training samples.
statistics in the leaves must be updated on the new, or without the missing class, respectively, which also alters the statistics consid-ered for splitting so far. However, this step does not affect the re-altime capability when processed parallely. For not drifting away from previously learnt knowledge, a series of recent samples for each object class is kept in memory. We observed convergence of the misclassification error over the number of samples used for training, as plotted in Figure 2. After the classifier has seen ten samples, the misclassification rate does not shrink consider-ably further. We hence set the number of samples to be stored in memory for each object class to ten. If the number of available samples exceeds this number, the oldest samples are discarded.
4 DATA ASSOCIATION
The association probabilities between targets and detections are assessed by evaluating the goodness of fit with respect to a motion-and appearance model. The motion is modelled by a linear Kalman Filter. The similarity of appearance is expressed by the response of the classifier that we introduced in the previous section.
4.1 Object Detection and Localisation
The sliding-window-based approach of Dalal and Triggs (2005) turned out to be the most adequate choice out of the state-of-the-art detectors, as shown in Dollar et al. (2011). For detection we use the HoG/SVM framework and classify Histograms of ori-ented Gradients with a Support Vector Machine as either pedes-trian or non-pedespedes-trian. Additionally we apply background sub-traction, which is not a nessessary procedure for our tracking ap-proach, but helps excluding very unlikely detections from track-ing. We use background modelling based on Mixtures of Gaus-sians (Stauffer and Grimson, 1999) for discovering misplaced de-tections, i.e. a detection is only accepted if it has a sufficiently large overlap with a foreground region. The detections are pro-jected onto a reference plane using a planar homography that can be calculated using known controlpoints visible in the scene. Since the bottom line of a detected region is prone to localisation uncertainties due to occlusions and articulations of legs, the top-most central point of the detection is used for projection under assumption of a default height of a German adult of 1.72m1. The state of the target is modeled by its location and velocity on the ground in 3D coordinates of the reference frame and its appear-ance as learnt by the classifier.
4.2 Detection-to-Track Assignment
Assignments of observed detections to trajectories are established in a probabilistic way. We follow Schindler et al. (2010) and com-bine probabilities that result from analysing motion and appear-ance. The target’s state is estimated using a Kalman Filter and the
1Surveyed by Statistisches Bundesamt 2009 (www.destatis.de)
distance between the prediction and the location of a detection is regarded for assessing the likelihood of correspondence. The output of the classifier is regarded as a measure of similarity with respect to the appearance. The motion model allows to exclude very unlikely detections from association under the assumption of constant velocity. The classifier supports the association espe-cially where targets dissolve from mutual occlusions.
Object MotionThe probability of a detectionoibeing triggered by the targetTwith respect to the target’s motionMTis assessed by evaluating the distance between the predicted target location
ˆ
xiand the one of the detectionxion the ground plane. For pre-diction we model the object’s motion using a linear Kalman Filter with constant velocity assumption. The probability of the ob-served position with respect to the motion model is formulated as
p(oi|MT) =e
−|(xi−xiˆ)| 2
2σ2 (3)
Object ClassificationThe probability of the detection being trig-gered by the targetT with respect to the classifier response on the samplesiof the detection is evaluated by applying the ORF as explained in section 3. Each detection is evaluated with the classifier and assigned with confidence values for each tracked object. The probability of a detection belonging to the tracked object given the sample of that detection is given by
p(oi|CT) =p(k=T|si) (4)
We model the probability of a detection for its assignment to a trajectory as the combined probability
p(oi|T) =p(oi|CT)·p(oi|MT) (5)
For each present target only the detection with the highest com-bined probability is chosen for updating, given that the comcom-bined probability exceeds a threshold that derives from the total number of classes in the Random Forest. After successful association, the sample derived from the associated detection is used for updating the ORF and to complement the set of samples according to the matched trajectory; the state of the tracking object is updated with the new measurementsxt, or with the predicted statexˆt, other-wise. In order to account for rising uncertainty in prediction with the time from the latest update, the standard deviationσin eq. 3 is set in dependency of the number of missing associations.
4.3 Initialisation and Termination
The calculation of the probabilities for the detection-to-track as-signment is carried out for each active trajectory and every cur-rent detection. Each detection that has not been associated to a present trajectory by the association strategy is used to initialise a new trajectory. For training of the instance specific classifier, a set of samples is generated from the detection as explained in section 3, followed by a re-training of the ORF with the samples stored so far. The motion is initialised based on the location of the detected object on the ground plane. Trajectories that have not been updated with a detection for more than a preset number of frames are terminated. We set the number of frames to wait for an update in our experiments to 10.
5 RESULTS
0
Figure 3: Classification results after sequential training. The classification confidence is plotted in the diagrams for the blue (left), red (middle) and yellow (right) framed tracking objects in the according colours below the image frames. The shown frames are captured one instance of time after initialisation (left) and 40 frames later (right).
In Figure 3 we show a sequence from a test data set in the entrance hall of our university. We began tracking when three people were available in the scene and observed the classification results of the ORF over time. The frames and the underlying statistics shown in Figure 3 are captured right after initialisation (frame 2) and 40 frames later. The bar diagrams show the response of the classifier for each of the tracked persons. It can be seen that the confidence of the classification result rises from initially around 50 percent to finally around 90 percent probability voted for the correct tar-get. Right after initialisation, the confidence is lower, because the classifier has not yet adapted well enough to the people’s ap-pearance. As expected, the classification becomes more distinct when more samples of the people have been taken into account. That lets the classifier adapt better to the current appearance of the people.
The trajectories gathered by the data association strategy are ana-lysed regarding the number of identity switches and re-initialisati-ons of targets. We applied tracking in a test sequence of 1600 im-ages captured in the entrance hall with a total of 23 people passing the scene. Since we do not tackle the detection and localisation task but only the association problem, metrics directly depending on the detection performance are disregarded here. People passed the test sequence with constant velocity but changed the direction of walking and most people moved along the viewing direction of the camera. The appearance of people hence changed while they passed the scene due to the changing illumination and orientation to the camera.
The result of using our approach is compared with reference data obtained from manual labeling. For assessing the performance, we count the identity switches as well as the number of times a tracking object is initialised as a new instance although it was already tracked. To demonstrate the benefit or our strategy we performed tracking on the given sequence thrice: using the mo-tion model only, using the classifier only and using the combined scheme. The results are shown in Table 1. When using only the motion model for association, 7 identity switches were
en-ID-Switches Re-initialisation
Motion 7 2
Classification 3 7
Combined 0 1
Table 1: Identity switch and re-initialisation counts.
countered, which occurred basically after mutual occlusions of people. Using only classification for the association yielded a count of 7 re-initialisations but lowered the number of identity switches. Using the combined scheme yielded an appropriate trade-off between the usage of the motion model and the classi-fier. The number of identity switches could be reduced to 0 in the tested sequence, the number of re-initialisations could be reduced to 1. The trajectories gathered by our approach are visualised in Figure 4. The one re-initialisation that happened during tracking was due to too many missing detections in sequence, which let the according person be dropped from tracking. Using the com-bination of classifier and motion model, most people could be tracked completely throughout the test sequence.
6 CONCLUSIONS
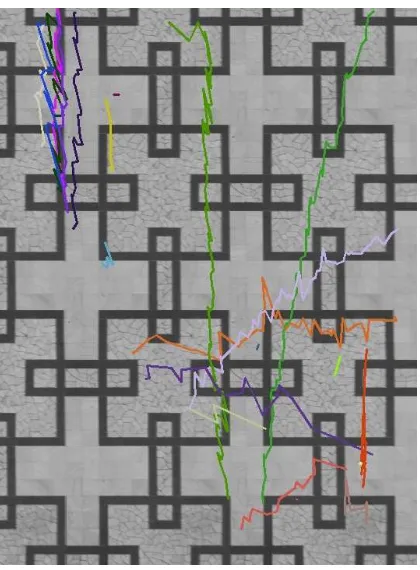
Figure 4: Trajectories mapped onto the rectified ground plane of the entrance hall of a university.
analysis with respect to applications as mentioned in the intro-duction. In future work we plan to perform more comprehensive tests in complex scenarios.
ACKNOWLEDGEMENTS
We gratefully acknowledge the financial support by the German Research Foundation (DFG) for the project QTrajectories under grant HE 1822/24-1.
References
Amit, Y. and Geman, D., 1997. Shape quantization and recog-nition with randomized trees. Neural computation 9(7), pp. 1545–1588.
Avidan, S., 2005. Ensemble tracking. In: Proceedings IEEE Con-ference on Computer Vision and Pattern Recognition., Vol. 2, pp. 494–501.
Breiman, L., 2001. Random forests. Machine learning 45(1), pp. 5–32.
Breitenstein, M., Reichlin, F., Leibe, B., Koller-Meier, E. and Van Gool, L., 2011. Online multi-person tracking-by-detection from a single, uncalibrated camera. IEEE Transactions on Pat-tern Analysis and Machine Intelligence 33(9), pp. 1820–1833.
Comaniciu, D., Ramesh, V. and Meer, P., 2003. Kernel-based object tracking. IEEE Transactions on Pattern Analysis and Machine Intelligence 25(5), pp. 564 – 577.
Dalal, N. and Triggs, B., 2005. Histograms of oriented gradients for human detection. In: Proceedings IEEE Conference on Computer Vision and Pattern Recognition., Vol. 1, pp. 886– 893.
Dollar, P., Wojek, C., Schiele, B. and Perona, P., 2011. Pedestrian detection: An evaluation of the state of the art. IEEE Trans-actions on Pattern Analysis and Machine Intelligence, 34 (4). pp. 743–761.
Geurts, P., Ernst, D. and Wehenkel, L., 2006. Extremely random-ized trees. Machine learning 63(1), pp. 3–42.
Grabner, H. and Bischof, H., 2006. On-line boosting and vi-sion. In: Proceedings IEEE Conference on Computer Vision and Pattern Recognition, Vol. 1, pp. 260–267.
Jaenen, U., Feuerhake, U., Klinger, T., Muhle, D., Sester, M., Haehner, J. and Heipke, C., 2012. Qtrajectories: Improving the quality of object tracking using self-organizing camera net-works. In: International Annals of Photogrammetry and Re-mote Sensing (Accepted for Publication).
Lepetit, V. and Fua, P., 2006. Keypoint recognition using random-ized trees. IEEE Transactions on Pattern Analysis and Machine Intelligence. 28(9), pp. 1465 –1479.
McKenna, S., Raja, Y. and Gong, S., 1999. Tracking colour ob-jects using adaptive mixture models. Image and vision com-puting 17(3-4), pp. 225–231.
Oza, N. and Russell, S., 2001. Online bagging and boosting. In: In Artificial Intelligence and Statistics 2001.
Ozuysal, M., Calonder, M., Lepetit, V. and Fua, P., 2010. Fast keypoint recognition using random ferns. IEEE Transactions on Pattern Analysis and Machine Intelligence. 32(3), pp. 448– 461.
Saffari, A., Leistner, C., Santner, J., Godec, M. and Bischof, H., 2009. On-line random forests. In: 3rd IEEE ICCV Workshop on On-line Computer Vision.
Schindler, K., Ess, A., Leibe, B. and Van Gool, L., 2010. Au-tomatic detection and tracking of pedestrians from a moving stereo rig. ISPRS Journal of Photogrammetry and Remote Sensing 65(6), pp. 523–537.
Sharp, T., 2008. Implementing decision trees and forests on a gpu. ECCV pp. 595–608.