DEVELOPMENT OF FLOOD INUNDATION LIBRARIES USING HISTORICAL
SATELLITE DATA AND DEM FOR PART OF GODAVARI BASIN: AN APPROACH
TOWARDS BETTER FLOOD MANAGEMENT
C. M. BHATT*, G.S. RAO and B. Patro [email protected]
Disaster Management Support Group,
Remote Sensing Applications Area, National Remote Sensing Centre
(NRSC), Indian Space Research Organization, Balanagar, Hyderabad, India
–
500037
Commission VI, WG VI/4
KEY WORDS: Flood, Inundation, Historical, Satellite, Godavari
ABSTRACT:
Conventional method of identifying areas to be inundated for issuing flood alert require inputs like discharge data, fine resolution digital elevation model (DEM), software for modelling and technically trained manpower to interpret the results meaningfully. Due to poor availability of these inputs, including good network of historical hydrological observations and limitation of time, quick flood early warning becomes a difficult task. Presently, based on the daily river water level and forecasted water level for major river systems in India, flood alerts are provided which are non-spatial in nature and does not help in understanding the inundation (spatial dimension) which may be caused at various water levels. In the present paper a concept for developing a series of flood-inundation map libraries two approaches are adopted one by correlating inundation extent derived from historical satellite data analysis with the corresponding water level recorded by the gauge station and the other simulation of inundation using digital elevation model (DEM's) is demonstrated for a part of Godavari Basin. The approach explained can be one of quick and cost-effective method for building a library of flood inundation extents, which can be utilized during flood disaster for alerting population and taking the relief and rescue operations. This layer can be visualized from a spatial dimension together with other spatial information like administrative boundaries, transport network, land use and land cover, digital elevation data and satellite images for better understanding and visualization of areas to be inundated spatially on free web based earth visualization portals like ISRO's Bhuvan portal (http://bhuvan.nrsc.gov.in). This can help decision makers in taking quick appropriate measures for warning, planning relief and rescue operations for the population to get affected under that river stage.
1. INTRODUCTION
One of the most effective ways to enhance flood preparedness and response is to model flood events. For developing flood inundation scenarios hydrological modelling is one of the best method. However, most of the flood inundation models are based on the advanced algorithmic and multiple data requirements that area some-times difficult to apply in developing countries (Hagen et.al., 2010). In least developed countries (LDCs) and in some developing countries input data for advanced flood modelling are not available. The scarcity of hydrological observations from good network of gauge stations, unavailability of fine resolution digital elevation model (DEM) data (Sanyal and Lu, 2005; Sanyal and Liu, 2006), land use and land cover information, software's for inundation modelling and technically trained manpower to run the model and interpret the results meaningfully flood early warning becomes a difficult task in developing countries. Hagen and Lu (2011) have highlighted the urgent need for flood hazard maps for developing countries, which can help in mitigation planning and provided aid during flood disaster crisis. Developing countries are in need of rudimentary flood hazard maps (Rabindra et al., 2008) which can help agencies to coordinate their efforts in response to flooding events (Hagen and Teufert, 2009). For a more comprehensive approach for disaster
response Bales and Wagner (2009) have suggested to develop a library of inundation extents for a range of river stages that covers an expected range of events from low flow to above-record levels. Kastens (2008) owing to the inherent limitations of optical remotely sensed imagery and the lack of any additional timely information used FLDPLN model, for production of flood inundation libraries that could be accessed during flood events to produce real-time flood maps with only actual or predicted flood stage as the input variable. In the present study two quick and cost-effective approaches for developing a series of readily available flood-inundation map libraries is demonstrated based on the analysis of historical satellite images, river water level and digital elevation model (DEM) which can be utilized during flood disaster for alerting population and taking the relief and rescue operations. Developing a library of modelled flood extents for communities over a range of potential flood levels can offer a resource that is easily accessed and, when combined with addition geospatial data, can provide valuable information that can be used to guide critical, time dependent decision making.
2. STUDY AREA
For the present study Sabari River, a tributary of Godavari River passing through Khammam district of Telangana (erstwhile Andhra Pradesh) is selected (Figure-1a&b). Sabari River is one of the main tributaries of Godavari River. It The International Archives of the Photogrammetry, Remote Sensing and Spatial Information Sciences, Volume XL-8, 2014
ISPRS Technical Commission VIII Symposium, 09 – 12 December 2014, Hyderabad, India
This contribution has been peer-reviewed.
originates from the western slopes of Eastern Ghats in Odisha state from Sinkaram hill ranges at 1370m above mean sea level (msl). The Sabari river enters into Telangana state near Kalleru village of Khammam district and flows for about 35 km before merging with the Godavari River near Kunavaram. Sabari River is one of the main tributaries of Godavari River which experiences severe flooding during monsoon season. The elevation within the study area varies between 13 and 764m, the higher elevation representing the hills located on both sides of Sabari River. The point where Sabari River enters Telangana has a value of 36m and the point of merging with Godavari River the elevation drops down to 20m. Central Water Commission (CWC) has two gauge discharge sites established along the river at Konta upstream and Kunavaram downstream side. Figure-1 (a-d) shows the location map of the selected study area, its environs and elevation.
Figure 1(a&b) Location map of the selected study area, (c) AWiFS image showing the environs of the selected stretch along Sabari River and (d) elevation map of the area based on
SRTM DEM.
3. DATA USED
Historical satellite data (source NRSC, ISRO) acquired during floods of 2000, 2005, 2006 and 2010 years and corresponding hydrological (river water level) data (source CWC) is used for extraction of inundation extent, correlating the extent with water level. Shuttle Radar Topographic Mission (SRTM) DEM is used for simulating the inundation extent and generation of scenarios of inundation at various water levels. Satellite images have also been used to validate and also for validating the simulated water extent obtained from DEM for various water levels. For hydrological processing of DEM, generation of flow direction and flow accumulation, TAU (Terrain analysis using Digital Elevation Models) DEM is used. TAU DEM is developed by Utah University and is freely available tool (hydrology.usu.edu) that provides a suite of tools for extraction of information useful for hydrologic modelling and analysis from DEMs. FLDPLN model developed by University of Kansas is used for simulation of flood inundation scenarios. Image processing operations are carried out in ERDAS
software, whereas GIS analysis is carried out in ARC GIS software.
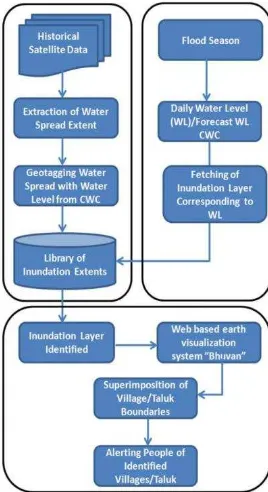
4. METHODOLOGY
In the present study two quick and cost-effective approaches to develop a series of readily available flood-inundation map libraries is demonstrated based on the analysis of historical satellite data, river water level and digital elevation model (DEM). First approach is based on the analysis of historical satellite data to extract the spatial extent of inundation. The inundation extents thus generated are then geotagged with the corresponding water levels observed on the day of satellite passes (Figure-2). Historical satellite images analysis can be very useful for building a library consisting of inundation maps that have been created in advance of a flood for predetermined stream stage, by which decision-makers can quickly access the map corresponding to the forecasted or real-time stage data. In the second approach using the FLDPLN model a nested library of inundation extents is generated as a function of floodwater depth relative to nearby stream surface elevation based on hydrologic flow principles derived from DEM. The simulated spatial inundation extents are then validated with the inundation derived from the processing of historical satellite data acquired during flood season.
For extraction of inundated area, synthetic aperture radar (SAR) images were pre-processed which involves the generation of beta naught (dB) image and then computation of sigma naught (dB) and incidence angle (degrees) images. SAR images were
filtered to suppress speckle using median filter. The speckle -suppressed images were then geometrically corrected with
master reference images to a defined projection system for
positional accuracies. Variable incidence angle threshold technique is used for the extraction of inundation layer. The
final inundation layer extracted was converted to one bit format.
Flood inundation layers derived from satellite data analysis were then geotagged with the corresponding water level recorded by the gauge station on a particular date.
Figure 2 Concept for development of library of inundation extents.
The DEM needs to be conditioned to derive basic hydrological inputs like flow direction and flow accumulation which are The International Archives of the Photogrammetry, Remote Sensing and Spatial Information Sciences, Volume XL-8, 2014
ISPRS Technical Commission VIII Symposium, 09 – 12 December 2014, Hyderabad, India
This contribution has been peer-reviewed.
required for running FLDPLN Model. Hydrological conditioning of DEM involves of removing all the depressions
in the DEM using the “Fill Sink” procedure. After removing the
sinks flow direction is determined using DEM as input surface direction of flow out of each cell showing eight valid output directions relating to the eight adjacent cells into which flow could travel. Flow accumulation raster is derived from the flow direction raster. The depressionless DEM, flow direction and flow accumulation layers are then used for running the three tools of FLDPLN model i.e. Stream Segmentation Tool, FLDPLN Model Tool and DTF Map Maker Tool. The output generated from the running of this model is the spatial flood inundation extent layers for a user specified depth. These inundation layers are then validated by superimposing on the flood inundation layer derived from satellite images corresponding to a specified flood depth. With the above explained process we can generate a series of inundation layers for various river stage scenarios.
5. RESULTS AND DISCUSSIONS
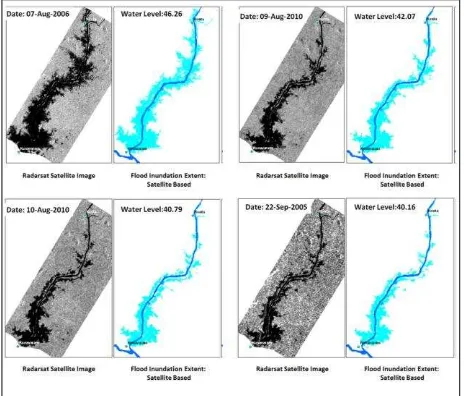
In the present study three historical satellite images acquired during floods, where water level data was available were analysed for extraction of flood inundation. The inundation layer extracted was then geotagged with the corresponding water level observed at gauge station on that particular date. Figure-3 shows the spatial extent of inundation observed along Sabari River on 07-Aug-2006 when water level is 46.26 m, 09-Aug-2010 when water level is 42.07m, 10-09-Aug-2010 when water level is 40.79 and 22-Sep-2005 when water level is 40.16m. Using this approach a series of inundation extents can be used to develop a library representing various water levels. However, using this approach we need to have long term historical satellite data and corresponding various water levels to represent the flood inundation situations expected at moderate and high flood levels.
Figure 3 Changes in spatial inundation extent at different water levels at Konta gauge station located along Sabri River.
To represent situations from the moderate flood situation to high flood level FLDPLN model has been used to simulate inundation scenarios at various water levels. Using FLDPLN model also the spatial extent of inundation observed along Sabari River on 07-Aug-2006 when water level is 46.26 m,
09-Aug-2010 when water level is 42.07m, 10-09-Aug-2010 when water level is 40.79 and 22-Sep-2005 when water level is 40.16m are simulated. There is a good match in the spatial extent and pattern of inundation simulated from model and observed from satellite data (Figure-4). The inundation area obtained from simulated method matches more than 84 percent.
Figure 4 Comparison between observed (cyan colour) and simulated (sky blue colour) inundation extent at different water
levels at Konta gauge station located along Sabri River.
After the model is calibrated and good results are obtained for the input data taken, flood inundation is simulated for various water levels and thereafter a generalized range of water levels is taken to represent all inundation scenarios falling within a range (Figure-5).
Figure 5 Flood inundation library simulated for various scenarios from moderate to high flood situation.
With this library in addition to the extent of inundation, villages to be affected by the inundation also can be assessed and given in advance the likely inundation and villages to be affected for the observed or forecasted water level. Figure-6 shows the villages that can be inundated at various water levels ranging between 36.5m-46.5m. About 14 villages are likely to be affected when water level is in 36.5-37.5m and about 66 villages when water level is in between 45.5-46.5.
During flood season, based on the forecasted water level, the library can be accessed to fetch the spatial inundation layer corresponding to the forecasted stage and anticipate in advance, likely spatial inundation pattern and submergence of villages and hence in alerting the habitation at risk. This method can be helpful in anticipating the areas to be affected in situations where satellite images cannot be effectively utilized due to cloud cover and also for providing information about the areas being partially covered in satellite data.
The International Archives of the Photogrammetry, Remote Sensing and Spatial Information Sciences, Volume XL-8, 2014 ISPRS Technical Commission VIII Symposium, 09 – 12 December 2014, Hyderabad, India
This contribution has been peer-reviewed.
6. CONCLUSIONS
The concept of development of a library hosting a series of inundation layers representing inundation at different water levels, created by geotagging of water spread area observed from historical satellite data analysis with corresponding water level observed for a gauge station, can be used as a quick and cost-effective method for alerting the habitation at risk during
flood season. This method can be helpful in anticipating the areas to be affected in situations where satellite images are available, but due to cloud cover cannot be effectively utilized and also when the area of interest is partially covered in satellite data. Though simulation of inundation extents through hydrological modelling remains the best means, but keeping into consideration most of the Himalayan Rivers discharge data
being classified, non-availability of fine resolution DEM and real-time hydrological data, this approach can be of help especially for decision-makers in times of crisis and making disaster management plans for flood season.
7. ACKNOWLEDGEMENTS
The authors gratefully acknowledge the support and cooperation given by Director, National Remote Sensing Centre (NRSC), Hyderabad; Deputy Director, Remote Sensing Applications Area, NRSC, Hyderabad; and Group Director, Disaster Management Support Group for carrying out the study. We also gratefully acknowledge the support and cooperation provided by the colleagues of DMSD, NRSC in carrying out the study. The authors are thankful to the Flood Forecasting Monitoring Directorate, Central Water Commission, New Delhi, for providing the water level data.
References
Bales, J. D. & C. R. Wagner (2009) Sources of uncertainty in flood inundation maps. Journal of Flood Risk Management, 2, 139-147.
Hagen, E., Shroder, J.F., Lu, X.X. and Teufert, J.F. 2010. Reverse engineered flood hazard mapping in Afghanistan: A parsimonious flood map model for developing countries.
Quaternary International 226, 82-91.
doi:10.1016/j.quaint.2009.11.021
Hagen, E. and Lu, X.X. 2011. Let us create flood hazard maps for developing countries. Natural Hazards 58 (3), 841-843. doi:10.1007/s11069-011-9750-7
Kastens, Jude Heathcliff. 2008. Some New Developments on Two Separate Topics: Statistical Cross Validation and Floodplain Mapping. PhD dissertation, University of Kansas. Ann Arbor: ProQuest/UMI. (Publication No. AAT 3316068.)
Hagen, E., and Teufert, J. 2009. Flooding in Afghanistan: A Crisis. In: Jones, J.A.A., Trahel, T.G., Christina, H. (Eds.), NATO Science for Peace and Security Series C:Environmental Security. Proceedings of the NATO Advanced Research Workshop on Natural Disasters and Water Security: Risk Assessment, Emergency Response and Environmental Management.
Rabindra, O., Shigenobu, T., Tooshikazu, T., 2008. Flood hazard mapping in developing countries: problems and
prospects. Disaster Prevention and Management 17 (1), 104-113.
Sanyal J, Lu XX. 2005. Remote sensing and GIS-based flood vulnerability assessment of human settlements case study of Gangetic West Bengal, India. Hydrol Process. 19:3699-3716.
Sanyal J, Lu XX. 2006. GIS-based flood hazard mapping at different administrative scales: a case study in GangeticWestBengal,India.J.TropGeogr.27:207-220.
The International Archives of the Photogrammetry, Remote Sensing and Spatial Information Sciences, Volume XL-8, 2014 ISPRS Technical Commission VIII Symposium, 09 – 12 December 2014, Hyderabad, India
This contribution has been peer-reviewed.