AN EXPERIMENTAL CASE STUDY TO ESTIMATE PRE-HARVEST WHEAT
ACREAGE/PRODUCTION IN HILLY AND PLAIN REGION OF UTTARAKHAND
STATE: CHALLENGES AND SOLUTIONS OF PROBLEMS BY USING SATELLITE
DATA
Divya Uniyal1, M.M. Kimothi2, Nita Bhagya2, Rajak D.Ram2, N.K.Patel2 and V.K.Dhaundiyal1 1
Uttarakhand Space Application Center, Dehradun 2
Space Application Center, Ahmedabad
E-mail: [email protected]
KEY WORDS:
Acreage, Production, LISS-III, LISS-IV, NDVI, Geo-referencing, Hierarchical Decision rules
ABSTRACT:
Wheat is an economically important Rabi crop for the state, which is grown on around 26% of total available agriculture area in the state. There is a variation in productivity of wheat crop in hilly and tarai region. The agricultural productivity is less in hilly region in comparison of tarai region due to terrace cultivation, traditional system of agriculture, small land holdings, variation in physiography, top soil erosion, lack of proper irrigation system etc.
Pre-harvest acreage/yield/production estimation of major crops is being done with the help of conventional crop cutting method, which is biased, inaccurate and time consuming. Remote Sensing data with multi-temporal and multi-spectral capabilities has shown new dimension in crop discrimination analysis and acreage/yield/production estimation in recent years.
In view of this, Uttarakhand Space Applications Centre (USAC), Dehradun with the collaboration of Space Applications Centre (SAC), ISRO, Ahmedabad and Uttarakhand State Agriculture Department, have developed different techniques for the discrimination of crops and estimation of pre-harvest wheat acreage/yield/production. In the 1st phase, five districts (Dehradun, Almora, Udham Singh Nagar, Pauri Garhwal and Haridwar) with distinct physiography i.e. hilly and plain regions, have been selected for testing and verification of techniques using IRS (Indian Remote Sensing Satellites), LISS-III, LISS-IV satellite data of Rabi season for the year 2008-09 and whole 13 districts of the Uttarakhand state from 2009-14 along with ground data were used for detailed analysis. Five methods have been developed i.e. NDVI (Normalized Differential Vegetation Index), Supervised classification, Spatial modeling, Masking out method and Programming on visual basics methods using multitemporal satellite data of Rabi season along with the collateral and ground data. These methods were used for wheat discriminations and pre-harvest acreage estimations and subsequently results were compared with Bureau of Estimation Statistics (BES). Out of these five different methods, wheat area that was estimated by spatial modeling and programming on visual basics has been found quite near to Bureau of Estimation Statistics (BES). But for hilly region, maximum fields were going in shadow region, so it was difficult to estimate accurate result, so frequency distribution curve method has been used and frequency range has been decided to discriminate wheat pixels from other pixels in hilly region, digitized those regions and result shows good result. For yield estimation, an algorithm has been developed by using soil characteristics i.e. texture, depth, drainage, temperature, rainfall and historical yield data. To get the production estimation, estimated yield multiplied by acreage of crop per hectare. Result shows deviation for acreage estimation from BES is around 3.28 %, 2.46%, 3.45%, 1.56%, 1.2% and 1.6% (estimation not declared till now by state Agriculture dept. For the year 2013-14) estimation and deviation for production estimation is around 4.98 %, 3.66% 3.21% , 3.1% NA and 2.9% for the consecutive above mentioned years i.e. 2008-09, 2009-10, 2010-11, 2011-12, 2012-13 and 2013-14. The estimated data has been provided to State Agriculture department for their use. To forecast production before harvest facilitate the formulation of workable marketing strategies leading to better export/import of crop in the state, which will help to lead better economic condition of the state. Yield estimation would help agriculture department in assessment of productivity of land for specific crop. Pre-harvest wheat acreage/production estimation, is useful to facilitate the reliable and timely estimates and enable the administrators and planners to take strategic decisions on import-export policy matters and trade negotiations.
1. INTRODUCTION
Wheat is an economically important Rabi crop for the Uttarakhand state, which is grown on around 26% of total available agriculture area in the state. There is a variation in productivity of wheat crop in hilly and tarai region. The agricultural productivity is less in hilly region as comparison of tarai region due to terrace cultivation, traditional system of agriculture, small land holdings, variation in physiography, top soil erosion, lack of proper irrigation system etc.
A timely forecast of any crop helps the government in farming policies regarding its storage, distribution, export-import and procurement of price. Various methods ranging from conventional to Remote Sensing methods are used for crop production forecasting. Crop production forecasts consist of two components acreage and yield which are forecast separately. In this study an attempt has been made to estimate acreage of wheat crop for Uttarakhand state using LISS-III data.
Estimates for wheat crop is provided by Agriculture statistics department, Government of India a project for making production forecasts for wheat crop was taken by Department of Space(DOS) as project FASAL (Forecasting Agricultural Output using Space,
The International Archives of the Photogrammetry, Remote Sensing and Spatial Information Sciences, Volume XL-8, 2014 ISPRS Technical Commission VIII Symposium, 09 – 12 December 2014, Hyderabad, India
This contribution has been peer-reviewed.
Agrometorological and Land based observations) USAC with the collaboration of SAC (Ahmedabad). IRS LISS-III data of January and February was used for acreage estimation. MXL classifier was used to discriminate wheat from other crops. Lack of satellite data due to cloud cover and mixing of other Rabi crops affected the accuracy of estimation of Wheat crop. In this study an attempt has been made to estimate acreage of Wheat crop using LISS-III data.
The technique uses hierarchical decision rules to classify the crop of interest. Initial zero fills, cloud, non agriculture (water, sand, urban areas, etc.) and forest features were marked out. Then the crop of interest was discriminated from competing crops prevalent in that area.
Remote sensing technology has potential in estimating crop acreage at district, regional and national level. Many crop acreage estimation studies have been carried out using remotely sensed data. As mentioned above Uttarakhand is a hilly state so to estimating accurate crop acreage some techniques must be developed. The study shows that use of different techniques to estimate pre-harvest wheat acreage in hilly areas using IRS LISS III data.
2. OBJECTIVES AND STUDY AREA
The main objectives of the study are to: To Estimate pre-harvest wheat acreage.
Develop different techniques for the acreage estimation of wheat crop in Uttarakhand state.
To Estimate pre-harvest wheat production.
Uttarakhand is located at 30 15 N latitude and 79 15 E longitude, is a hilly state. Wheat is an economically important Rabi crop for the state, which is grown on around 26% of total available agriculture area in the state. All 13 districts of Uttarakhand state were selected for wheat acreage/production estimation. It is sown from last week of October to second week of December. The crop reaches flowering stage around mid-February and harvesting commences from April to first week of May.
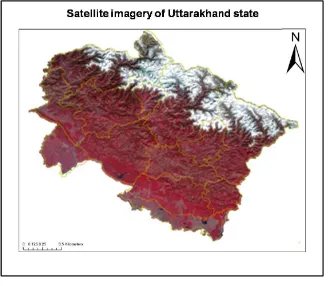
Figure 1: Satellite imagery of Uttarakhand state
3. DATA USED
3.1 Satellite data
IRS-P6-Resourcesat-2: LISS-III data.
3.2 Collateral data
Wheat Acreage statistics from Agriculture department Historical district level wheat statistics from 2005 to 2008
for districts for all 13
Shape file of the boundary of districts of Uttarakhand state from SOI has been used. formulated for remote sensing based crop acreage estimation are as follows:
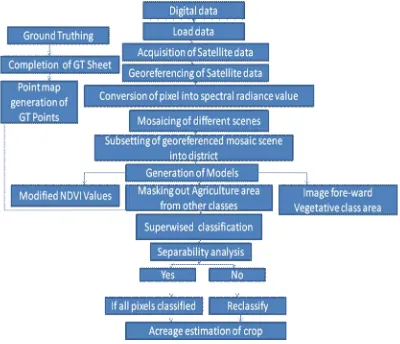
4.1 Acquisition of satellite data
4.2 Data processing
Geo-referencing of Data IRS P6 LISS-III
Mosaicing of different geo-referenced scenes
Data subset (District wise Collection of Ground truth information
Collection of Ground truth information
Ground based information will be collected in the given format:
S. No. District
Table 1: Ground truth sheet
4.3 Analysis of satellite data (For Acreage estimation)
Modified NDVI image generation from geo-referenced satellite data:
The International Archives of the Photogrammetry, Remote Sensing and Spatial Information Sciences, Volume XL-8, 2014 ISPRS Technical Commission VIII Symposium, 09 – 12 December 2014, Hyderabad, India
This contribution has been peer-reviewed.
Where NDVI range scaled between 0 to 200.
Masking out agriculture area from other classes using spatial modelling.
Image forward only Agriculture area from recoded image using spatial modelling.
Supervised classification of above forwarded image with the help of above mentioned ground truth
4.4 This methodology is appropriate for plain area but in hilly area some of the wheat pixels were going into shadow portion so it is difficult to classify those pixels so a new method has been adopted –Breakpoint editor in ERDAS IMAGINE 9.3 is used to highlight those pixels which are going to shadow portion in satellite image so digitized this area and add to the wheat classified area.
Figure 2: Methodology used to acreage estimation
4.5 For yield estimation: For yield estimation, a mathematical equation has been drawn, in which Rainfall, temperature; soil characteristics (Depth, Drainage and Texture) and aspect factors have been considered. The equation which has been used is as follows:
Productivity= Last year productivity + Productivity value correction
Productivity value Correction =a*Temperature+ b*Rainfall+ c*Soil texture+ d*soil depth+ e*soil drainage+ + f*aspect, Productivity value Correction =a*Temperature+ b*Rainfall+ g*value,
Where a, b, c, d, e, and f are the constants. For different years, different physical parameters such as Temperature and Rainfall are there so the values of constants a, b, c, d, e and f have been calculated for this year. The values c, d, e, f will be same but the values of a and b will be changed because these features are dynamic in nature.
By using this equation Maximum and Minimum yield have been estimated. Production estimation Production has been estimated on the basis of the following formula which gives relationship between production, acreage and productivity:
Production of crop =Estimated yield*Acreage of crop
5. RESULTS
5.1 Geo-referencing of satellite data
Image-to-image registration was done with an accuracy level of less than half a pixel.
5.2 Ground-truth Details
In Uttarakhand the ground truth period was January or February when Wheat is in flowering stage.
5.3 The result of the study is shown below:
Variation in estimated records through satellite data & BES data
Year Acreage (ha) in % Production (m-t) in %
2008-09 3.28 4.98
2009-10 2.46 3.68
2010-2011 3.45 3.21
2011-2012 1.56 3.1
2012-2013 1.2 N.A.
2013-2014 1.6 2.9
Table 2: Comparison of Wheat acreage/production estimation from satellite data and data from Agriculture dept. for entire Uttarakhand state during last 6 years
The International Archives of the Photogrammetry, Remote Sensing and Spatial Information Sciences, Volume XL-8, 2014 ISPRS Technical Commission VIII Symposium, 09 – 12 December 2014, Hyderabad, India
This contribution has been peer-reviewed.
Figure 3: Classified image overlaid on satellite imagery of Uttarakhand state
For hilly area, the results which are coming from above mentioned methodology, is quite similar to acreage estimation of wheat crop from Agriculture department.
6. CONCLUSION:
Through remote sensing, GIS and land based observation, the acreage and production estimation of Hilly and plains can be estimated. This data has been handover to state Agriculture dept. for their further use, this data is of great importance to planners and policy makers for efficient and timely agricultural development and making important decisions with respect to procurement, storage, public distribution, export, import and other related issues.
7. REFERENCES
Ajai 1992. Cotton Acreage Estimation and Condition Assessment. In Natural Resources Management- a new perspective, NNRMS Bangalore p267.
Bhgia, N.,Oza M.P.,Patel J.H., Dadhwal V.K., 1996. An approach for all India wheat production forecasting using remote sensing data. Scientific note: RSAM/SAC/CAPE-II/SN/53/96 April 1996,19p.
Bhagia,N., Oza, M.P., Rajak, D.R., Singh, R.P., Sehgal, V.K., Ravi, N.,Srivastava, H.S.Patel, J.H., Ray, S.S. and Dabhwal, V.K., 1997.An attempt to make national wheat production forecast using multidate WiFS data for 1996-97 season. Bull.National Natural Resources Management System, NNRMS(B)-21,54-58.
Bhagia, N.,Rajak, D.R.,Oza, M.P.,Jaishankar R. and Dadhwal V.K.;2002.All India wheat production forecasting using multi-date WiFS and meteorological data for 2001-2002 season. Scientific Note: RSAM/SAC/FASAL-TD/SN/14/MAY2002.
M.H.Kalubarme, Alka Sharma and R.K.Sood .Wheat production forecast in hilly Terrains of Himanchal Pradesh. ISG Newsletter.
M.M.Kimothi, M.H.Kaluborme, Sujaya Dutta, Rajendra Thapa, and R.K Sood,.(1997).Remote sensing of horticultural plantations in Kumarsain Tehsil (Shimla district).ISRS Journal, Vol.25,No.1.
Nita Bhagia, M.R.Bhuyan, M.P.Oza, N.K.Patel, J.S.Parihar, Khalid Mehmood, Vijay Singh, Mahest Chodvadiya and Navneet patel, G.D.Bairagi, Sanjay Apturkar, D.C.Loshali: Cotton area estimation using multi-temporal AWiFS data-A Feasibility study
Oza, M.P.,Bhagia, N.L., Rajak,D.R. and Dadhwal, V.K.2002. All India wheat inventory using multi date IRS WiFS and weather data, the international Archives of the Photogrammetry, Remote Sensing and Spatial information Sciences, Vol.34, Part XXX.
Oza M.P., Bhagia, N.L.Rajak, D.R. and Dadhwal, V.K.,2002.All India wheat inventory using multi-date IRS WiFS and weather data, The international Archives of the photogrammetry, Remote sensing and spatial Information Sciences,Vol.34,Part XXX.
S.C.Bhatt (Editor) (1997). Nothern Zone Gyan PublishingThe Encyclopaedic district Gazetteers of India. Northern Zone Gyan Publishing House. New Delhi- 110002.
Wang,R.Y.(1986) An approach to tree- classifier design based on hierarchical clustering. International Journal of Remote Sensing; Vol.7:75-88
The International Archives of the Photogrammetry, Remote Sensing and Spatial Information Sciences, Volume XL-8, 2014 ISPRS Technical Commission VIII Symposium, 09 – 12 December 2014, Hyderabad, India
This contribution has been peer-reviewed.