Satellite estimates of surface radiative fluxes for the extended
San Pedro Basin: sensitivity to aerosols
R.T. Pinker
a,∗, I. Laszlo
a, D. Goodrich
b, G. Pandithurai
aaDepartment of Meteorology, University of Maryland, College Park, MD 20742, USA
bUSDA-Agricultural Research Service, Southwest Watershed Research Center, 2000 E. Allen Road, Tucson, AZ 85719, USA
Abstract
Surface downwelling and upwelling radiative fluxes are important inputs into hydrologic models that evaluate water budgets, and into land surface data assimilation schemes which are driven with radiative fluxes. For large-scale needs, only remote sensing methods can provide such information. The accuracy of the derived fluxes depends on the inference schemes and on the quality of auxiliary input parameters. At present, information on surface short-wave (SW) radiative fluxes over the United States is produced in real time by the National Oceanic and Atmospheric Administration (NOAA)/National Environmental Satellite Data and Information Service (NESDIS) at 0.5◦resolution, at hourly time intervals, using independently derived
auxiliary inputs. Information on aerosol properties and their temporal variability is not available, and at best, is only estimated. During 1997 information on aerosol optical properties was collected at the USDA-Agricultural Research Service Walnut Gulch Experimental Watershed, Arizona, in preparation for future validation efforts in support of new satellite observations (e.g., ADEOS-II). This data set was used to test the sensitivity of a radiation inference scheme to aerosols, in particular, on the determination of clear sky fluxes and the surface albedo. Data from the Arizona meteorological network (AZMET) have been utilized to evaluate the satellite estimates for 1997. It was found that the current satellite estimates are within 70 W m−2of
the ground observations on an hourly time scale and within 24 W m−2on a daily time scale. In the latter case this is less than
10% of the mean. Use of actual observations of aerosols, as compared to climatological values, reduces the bias substantially, while less significant changes in the r.m.s. were found. © 2000 Elsevier Science B.V. All rights reserved.
Keywords: Radiative fluxes; Aerosols; Remote sensing
1. Background
1.1. Site and history
The semi-arid land-surface-atmosphere (SALSA) program seeks to evaluate the consequences of natural and human-induced changes in semi-arid environ-ments (Renard et al., 1993; Goodrich and Simanton, 1995; Goodrich et al., 2000). Current SALSA research is focused on the Upper San Pedro Basin (USPB) which spans the border area between northern Sonora,
∗Corresponding author.
Mexico and southeastern Arizona, United States. This region exhibits significant land-use differences, and therefore, is well suited for investigating impacts of anthropogenic change on feedbacks into the regional hydrology and climate (Goodrich et al., 1998). The watershed also experiences significant seasonal to in-terannual climate variability, much of which is due to the influence of the Mexican monsoon and established linkage to the El Niño-southern oscillation (Cayan et al., 1998). The basin is embedded in the larger Arizona/Sonora semi-arid region which has been the focus of numerous environmental studies, and there-fore, has a rich source of information for validating
remote sensing methods that estimate surface parame-ters. More details on the ecological importance of this basin, as well as on the SALSA program and relevant geographical information, are presented in Goodrich et al. (2000); also see the SALSA home-page at http://www.tucson.ars.ag.gov/salsa/salsahome.html. Information on remote sensing activities in this region is presented in Moran et al. (1998). The adaptation of the diagnostic, near real time mode of the regional atmospheric modeling system (RAMS) mesoscale model (Pielke et al., 1992) for the San Pedro Basin, is discussed in Toth et al. (1998). In addition, issues re-lated to estimating area averages of turbulent surface fluxes are discussed in Chehbouni et al. (2000).
Surface downwelling and upwelling radiative fluxes play an important role as inputs into hydrologic mod-els aimed at evaluating water budgets. Therefore, it is important to determine how well such fluxes can be derived from satellite observations. First es-timates of short-wave (SW) surface radiative fluxes (global irradiance) by satellite methods for this region were attempted during the Monsoon’90 experiment (Kustas et al., 1991; Kustas and Goodrich, 1994) and have been reported on in Pinker et al. (1994). Subse-quently, the capabilities to derive such fluxes have been expanded to cover the entire United States in support of the Global Energy and Water Cycle Experiment (GEWEX) (WCRP-67, 1992a,b) Continental-Scale International Project (GCIP) (Leese, 1994, 1997) aimed at the determination of the water budgets in the Mississippi river basin. Due to the importance of the diurnal cycle, observations from the geostationary satellite GOES have been found to be most useful for obtaining long-term and systematic information on radiative fluxes. Since 1996, real time estimates of SW radiative fluxes, both at the surface and at the top of the atmosphere (TOA) have been produced by the National Oceanic and Atmospheric Admin-istration (NOAA)/National Environmental Satellite Data and Information Service (NESDIS). The infer-ence scheme was developed at the Department of Meteorology, University of Maryland (UMD) (Pinker et al., 1995, 2000). NOAA/NESDIS developed the interface between the satellite data and the infer-ence models, and is running the model in real-time on an hourly basis, using observations from the vis-ible (0.52–0.72mm) channel of the GOES Imager (Tarpley et al., 1996). Atmospheric input parameters
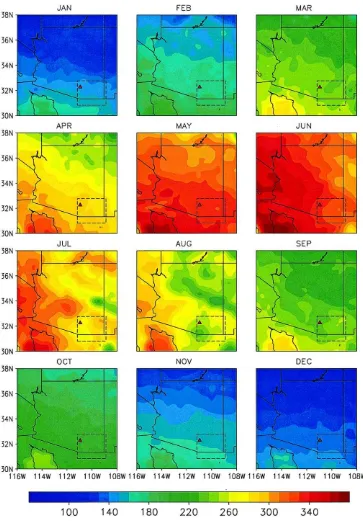
produced by the NOAA/National Centers for En-vironmental Prediction (NCEP), as available from the Eta model analyzed output fields (Rogers et al., 1996) are also used. Both model input and output parameters are archived at UMD where the satellite estimates of the radiative fluxes are evaluated against ground truth. The inferred SW radiative fluxes in-clude downwelling and upwelling global and diffuse quantities, as well as spectral components (e.g., the photosynthetically active radiation (PAR)). In Fig. 1, an example of surface SW fluxes (global irradiance) for each month, averaged for 1996 and 1997, for the Arizona/N. Sonora region is illustrated. Outlined is the region of the San Pedro Basin, as used in the RAMS model runs (Toth et al., 1998) and the location of Tucson (32◦57′N, 110◦57′W). As evident from Fig. 1, the spatial distribution of global surface SW fluxes has a zonal structure in the winter months of November–February; southern latitudes are gradually receiving more radiation. For the other months of the year, the spatial distribution exhibits a longitudinal structure with a strong west–east gradient. The min-imum value (∼60 W m−2) is found in January at the
northeast corner of the area shown in Fig. 1, while the maximum (∼380 W m−2) occurs in May and June
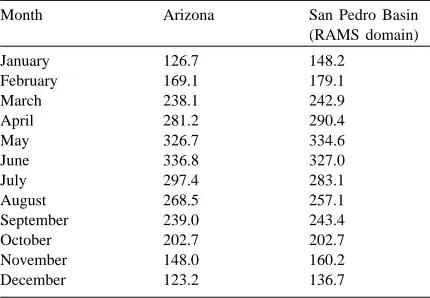
at the southwest corner, over the northern tip of the Gulf of California. The monthly mean integrated val-ues for the state of Arizona, as well as for the San Pedro Basin, are presented in Table 1. Averaged for the year, the San Pedro Basin receives about 5 W m−2
Table 1
Monthly-mean global irradiance (W m−2) averaged for the state
of Arizona and for the San Pedro Basin (monthly averages were obtained by averaging data of two years)
Month Arizona San Pedro Basin
Fig. 1. Two-year monthly mean global irradiance at the surface over Arizona, United States and N. Sonora, Mexico, as derived from the NOAA GCIP/SRB model, in W m−2. The averages were taken for 1996 and 1997, using hourly derived satellite based fluxes. The domain
more global irradiance than the extended Arizona re-gion. Although this difference in the yearly amount of global irradiance is not statistically significant at the 0.05 level, the monthly difference can be as high as 20 W m−2 (January). It is interesting to note that
the excess radiation in the yearly average for the San Pedro Basin is not contributed by higher values during the summer months. During the months of June–August the global irradiance for the San Pedro Basin is 10–15 W m−2less than that for the extended
Arizona region.
1.2. Linkage to related activities
The USPB has been established as the North Ameri-can semi-arid site for assessing the impacts of climatic variation and for calibrating and validating algorithms and process-based models to be implemented with NASA EOS observations. For example, the basin was selected by the advanced spaceborne thermal emis-sion and reflection radiometer (ASTER) instrument team as a semi-arid validation site as well as NASA Global Land Cover Test Site. It was also selected as the primary focus site for the EOS interdisciplinary science hydrology team at the University of Ari-zona and Centre d’Etudes Spatiales de la Biosphere (CESBIO), France. Two Sonora research groups have been involved in research in the USPB: Instituto del Medio Ambiente y Desarrollo Sustentable del Es-tado de Sonora (IMADES), and Instituto Tecnológico de Sonora (ITSON). Numerous proposals have been funded for research as well as for remotely sensed data acquisition in the basin, which range from ERS-2, SPOT4, ADEOS-II, and for a mesoscale meteoro-logical modeling initiative. Modeling activity focuses on exploring the potential of coupling parameters derived by methods of remote sensing to mesoscale atmospheric models, to aid in diagnosing the spatial distribution of surface fluxes over the entire San Pedro Basin at a 4×4 km2grid spacing (Toth, 1997).
2. Radiative fluxes used in this study
2.1. Remotely sensed data
The estimated surface SW radiative fluxes (global irradiance) used in this study are produced by NOAA/
NESDIS, using the UMD methodology (Pinker and Laszlo, 1992; Pinker et al., 2000). The algorithm is driven by observations made from the GOES-8 Im-ager, at hourly time intervals and at 0.5◦spatial reso-lution over the domain of 25–50◦N, 70–125◦W. Each 0.5◦grid cell is covered with 72 pixels of about 4 km resolution, which are used to determine whether it is clear or cloudy over the target. The satellite estimates of global irradiance have been previously evaluated on hourly, daily and monthly time scales against obser-vations made at about 50 stations during the year of 1996 (Pinker et al., 2000). For the interpretation of the satellite observations, use is made of the pre-launch calibration of GOES-8, as discussed in Weinreb et al. (1997). In the present study, validation over Arizona was expanded to include data from 1997, when aerosol optical depths were also observed. The satellite esti-mates used in this study are distributed via the World Wide Web and an anonymous ftp site, as described at: http://www.meto.umd.edu/∼srb/gcip.
The full archive maintained at the UMD contains additional parameters, that as yet, are not distributed. Specifically, the following types of information are archived:
• satellite based information, used to drive the model;
• auxiliary data used to drive the model;
• Eta model output products relevant for hydrologic
modeling;
• independently derived satellite products.
It is planned to expand the number of para-meters currently distributed via the World Wide Web to include, e.g., cloud amounts.
2.2. Validation data
2.2.1. Radiative fluxes
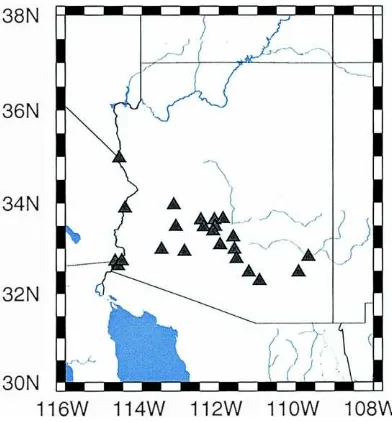
Fig. 2. Location of the AZMET ground observing stations, where measurements of global irradiance are being made.
center of the satellite grid. The Arizona stations are clustered between the latitudes of 32.25–33.75◦N and longitudes of 109–115◦W. Most stations observe only downwelling SW radiation (global irradiance) at dif-ferent sampling frequencies which are subsequently integrated at hourly time intervals. Results from
Fig. 3. Comparison of hourly mean (a) and daily mean (b) all-sky surface global irradiance as obtained from the NOAA/NESDIS GCIP product, with the AZMET observations, in W m−2. To represent the hourly values, only data of one month were used (June 1997). In
(b) data of three months were combined (January, April, and July, 1997). (bias: satellite-estimated flux minus ground-observed flux, in W m−2; r.m.s.: root mean square error in W m−2; r: correlation coefficient; n: number of data points).
evaluation of the NOAA/NESDIS product against ob-servations made at the AZMET stations, are illustrated in Fig. 3. Due to the large amount of hourly data for 21 stations, only one month of hourly comparisons are included in Fig. 3a. The daily values in Fig. 3b are based on three months of data. As evident, on an hourly time scale the r.m.s. is about 70 W m−2, while
on the daily time scale it is only about 24 W m−2. On
the average, the satellite-estimated radiative fluxes are smaller than those observed on the ground; on an hourly time scale, the “satellite-ground” bias is
−19 W m−2; on a daily time scale it is−10 W m−2.
2.2.2. Aerosol observations at Walnut Gulch
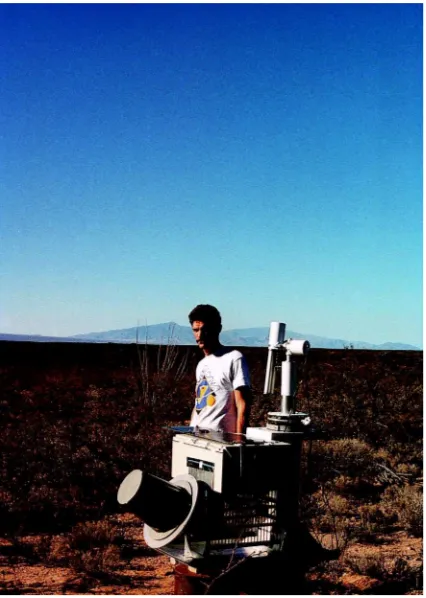
Fig. 4. The CIMEL sunphotometer for measuring aerosol optical depth, at the USDA-ARS Walnut Gulch Experimental Watershed, Tombstone, AZ.
NASA’s earth observing system (EOS) program. The data are transmitted via the GOES satellite to Goddard Space Flight Center, where they are centrally archived and pre-processed (Holben et al., 1998). We have sub-jected the data to additional quality control and the monthly mean values of aerosol optical depth used in this study are presented in Table 2. The Walnut Gulch Watershed was selected for the aerosol measurements to avoid urban influences, and because personnel was available at the site. Surface radiation measurements from the closest AZMET station (Tucson, AZ) were used. It should be noted that the Tucson AZMET station is located approximately 110 km northwest of Walnut Gulch, is at a lower elevation (710 m ver-sus 1370 m at Walnut Gulch), and is within a urban area. More details on the measurements and data analysis in Arizona are provided in Pandithurai et al. (1999).
Table 2
Monthly-mean spectral aerosol optical depths observed with the CIMEL Sky radiometer over Tombstone, Arizona during 1997 (no measurements are available for April;λis the wavelength)
Month λ(mm)
0.340 0.380 0.440 0.500 0.670 0.870 1.020
January 0.054 0.048 0.039 0.029 0.017 0.017 0.017 February 0.058 0.055 0.045 0.035 0.023 0.024 0.021 March 0.073 0.075 0.055 0.042 0.028 0.029 0.023 May 0.109 0.106 0.081 0.067 0.050 0.047 0.041 June 0.102 0.102 0.070 0.057 0.039 0.035 0.027 July 0.173 0.166 0.119 0.099 0.068 0.058 0.051 August 0.189 0.182 0.125 0.102 0.066 0.051 0.043 September 0.208 0.195 0.143 0.116 0.072 0.049 0.039 October 0.071 0.077 0.045 0.036 0.025 0.020 0.016 November 0.056 0.065 0.037 0.030 0.022 0.018 0.015 December 0.068 0.065 0.045 0.034 0.022 0.014 0.013
3. Aerosol sensitivity experiments
3.1. Issues
used to produce the surface fluxes presented in Fig. 1, and should be considered only as temporary, un-til better information on aerosols becomes available. Yet, this approach has proven to be better than other available options (Laszlo and Pinker, 1990). Because the evaluation of satellite retrieval techniques requires longer time series for statistical significance, there was no opportunity in past studies, to evaluate the aerosol retrieval procedure. In what follows, we will describe the experiments conducted in this study.
3.2. Aerosol experiments
We have performed an experiment to evaluate the sensitivity of surface SW radiative flux parameters to aerosol information. An off-line version of the GCIP/SRB model was run for the entire year of 1997. All the satellite input parameters, as well as the atmo-spheric and surface parameters were the same as used by NOAA/NESDIS in the real time runs for 1997 and as archived at the UMD. The only difference was that the climatological aerosol optical depth values used to initialize the retrieval process were replaced by the monthly mean observed values, as presented in Table 2. We will describe such impacts on the clear sky fluxes (cloudless global irradiance), all sky fluxes (global irradiance) and surface albedo. In this exper-iment we were exploring how different assumptions about the amount of aerosols used for initialization in a particular retrieval scheme, will affect the derived surface irradiance and albedo for a given geograph-ical region (an inverse problem). Sensitivity of the surface irradiance to aerosol as a forward problem has already been extensively studied (e.g., Coakley and Cess, 1983; Pinker and Ewing, 1985). It has also been shown (e.g., Laszlo and Pinker, 1989) that in the forward problem, both the TOA albedo and the sur-face irradiance vary non-linearly with aerosol optical depth. They change rapidly for small values of the optical depth and level-off at large values, namely, the TOA albedo and the surface irradiance are more sensitive to errors in the aerosol optical depth at small values of optical depth. This conclusion is also valid in the inverse problem case as long as the aerosol optical depth used for initialization is not much dif-ferent from the actual value. A relevant question is how much is the error in the derived irradiance, if the optical depth used for initialization is far off from the
actual value. Indeed, if the error in the initial optical depth is large, the error in the irradiance will also be large, regardless of the value of the optical depth.
4. Results
4.1. Surface fluxes
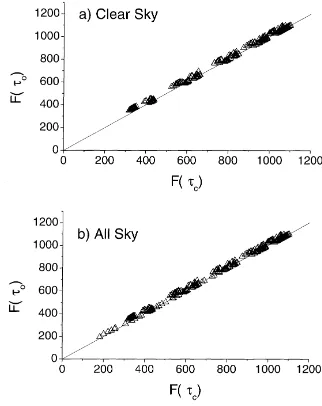
In Fig. 5a, a comparison between instantaneous clear-sky radiative fluxes as derived from GOES-8 observations over a satellite grid closest to Tucson is presented for the month of June 1997. One set of inferred values was obtained from the control run, using aerosol climatology (optical depth, τc), while
the other set was obtained with off-line run, using monthly mean observed values of aerosol optical depth (τo). The mean of the instantaneous fluxes
from the “control” run was 789.0 W m−2, while the
observed aerosol climatology yielded a 14.0 W m−2
higher value (803.0 W m−2). Since the assumed
av-erage aerosol optical depth climatology for June was 0.230, while the measured value was 0.057, the effect
Fig. 5. Comparison of instantaneous clear-sky (a) and all-sky (b) surface global irradiances (W m−2) retrieved using the two
should indeed be to increase the downward fluxes at the surface. June 1997 was a predominantly clear month, therefore, the results for the all-sky cases (Fig. 5b) are similar. The mean instantaneous fluxes from the control run and from the experimental run were 750.1 and 763.5 W m−2, respectively. Using the
Student’s t-test on paired data, for both clear and cloudy skies, has shown that the above means are significantly different at the 0.05 level.
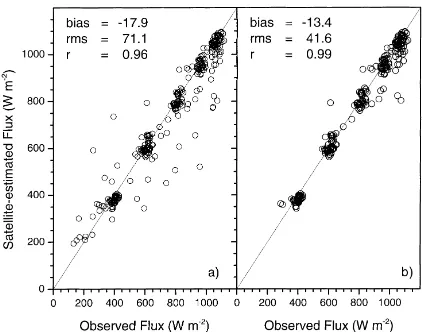
A comparison of hourly mean estimated global irradiance with ground truth as obtained from the control run, is presented in Fig. 6a for all sky and in Fig. 6b clear sky cases independently. In Fig. 7, the comparison was repeated using results from the experimental run. For clear sky there is a clustering of data because the solar zenith angle is changing only by a small amount at a particular instant from one day to another (the same clustering is observed in Fig. 5a). For all-sky conditions, the gaps between the clear-sky clusters are filled with values observed for different levels of cloudiness. The correlation be-tween satellite derived fluxes and those measured at the ground is very high for both cloudy and cloudless conditions (0.96–0.99) which is due to the dominance of the external solar forcing from one hour to another. The largest scatter occurs in the gaps between the
Fig. 6. Comparison of hourly mean all-sky (a) and clear-sky (b) surface global irradiance derived from the NOAA/NESDIS GCIP product with ground observations, for June 1997, Tucson, AZ. Aerosol optical depth was initialized with climatological values in the retrieval (the diagonal is the line of perfect agreement; r.m.s.: root mean square error in W m−2; bias: satellite-estimated flux
minus measured flux in W m−2; r: correlation coefficient).
Fig. 7. The same as Fig. 6, but observed values of aerosol optical depth were used for initialization in the retrieval of the surface global irradiance.
clear-sky clusters, pointing to existing uncertainties in the retrieval of global irradiance for cloudy condi-tions. The use of observed values of aerosol optical depth reduced the bias for both all sky and clear sky cases by about 12–13 W m−2, and improves the r.m.s.
by about 4–7 W m−2. The smaller r.m.s. errors suggest
that the reduction in bias is not purely because of bet-ter cancellation of errors. Just as it has been found for the satellite-estimated instantaneous global irradiance, Student’s t test on paired data showed that the hourly mean fluxes estimated from the two initializations are significantly different at the 0.05 level. The proba-bility of obtaining a t-value larger than that obtained (−15.4 for all sky, −14.7 for clear sky) by chance alone when the two means are not different is negli-gible (3×10−40for all sky, 4
×10−39for clear sky).
4.2. Surface albedo
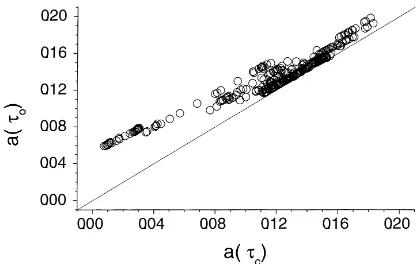
Fig. 8. Diurnal variation of surface albedo in the Tucson, AZ GCIP grid, observed during a period of 10 days of June 1997 which were predominantly clear, as determined from the satellite observations. Left panel: using climatological aerosols; middle panel: using observed aerosols; right panel: difference between the two.
evaluations show that these two values are quite close to each other. In Fig. 8, 10 predominantly clear days in June were selected to study the diurnal variation of the surface albedo over Tucson, Arizona and to evaluate the effect of aerosol initialization. In the left panel climatological aerosol values were used; in the middle panel, the observed values were used; and the right panel represents the difference. As evident, the albedos are somewhat higher when aerosol observa-tions are used. This is consistent with the fact that the observed aerosol optical depth was found to be lower than the assumed climatological value. There-fore, the decreased aerosol contribution to the satellite observed TOA albedo had to be compensated by an increase of surface albedo. In Fig. 8, only values from 10 a.m. to 4 p.m. were plotted. The observations at lower sun elevation angles show spurious values, as has been extensively observed from ground obser-vations (Rosenberg et al., 1983). In Fig. 9, a scatter diagram of the two albedos described in Fig. 8 is presented, using all the instantaneous fluxes under all-sky conditions in June and July of 1997. On an average, the surface albedo increased by about 0.02 (17%) when the measured aerosol optical thickness was used for initialization (the mean values obtained from the two initializations are 0.118 and 0.134, re-spectively). Lower values of the surface albedo are affected more because their contribution to the TOA
albedo is small relative to the reflection by aerosols in the atmosphere. When the dominant atmospheric factors contributing to the TOA albedo are changed, the surface albedos need to further compensate for more of the observed TOA albedo changes.
5. Discussion
Radiative fluxes at the earth’s surface determine the surface energy budget, and therefore, the rate of evapotranspiration (Dickinson, 1986; Avissar and
Verstraete, 1990; Henderson-Sellers, 1993; Sellers et al., 1986; Wood et al., 1997). In semi-arid re-gions, dominated by clear sky conditions, the effect of aerosols on surface fluxes is more significant than in mostly cloudy areas. Therefore, it is important to assess these effects in a quantitative manner. Such an attempt was undertaken in this study. It was found that when the radiative flux retrieval from satellite observations is initialized with observed aerosol cli-matology the flux estimates compared better with ground observations. We have also investigated how the selection of the initial aerosol value will affect the retrieval of surface albedo. It was found that using measured values to initialize the aerosol optical depth in the retrieval of surface global irradiance, the sur-face albedo increased by about 0.02 on an average. No surface albedo measurements were available for com-parison, and moreover, a single point measurement of surface albedo is generally not representative of the much larger region observed by the satellite. There is, however, some evidence that the mean surface albedo of the region in question should be somewhat larger than the value retrieved with climatological initialization (0.12). The seasonal land albedo map of Matthews (1985) suggests values ranging from 0.12 to 0.28, depending on the exact location within the grid. In addition to better aerosol information, there is a need for improved calibration of satellite sensors. It is believed that some degradation of satellite instru-ments might have occurred. Preliminary estimates of such degradation are as high as 15%. Experiments were performed to evaluate the possible impact of such degradation on the derived surface fluxes (Meng et al., 1999). The off-line version of the inference model was run for three months by adjusting the calibration by 15%, namely, by increasing the ob-served radiance values. The results from this experi-ment were evaluated against ground observations as obtained at the atmospheric radiation measurement (ARM) program sites in Oklahoma and at the coop-erative atmosphere-surface exchange study (CASES) experiment conducted in Kansas. SW radiative fluxes for a three month period (1 May–31 July 1997) were used for the ARM/CART/SAP, and observations for the period 1–23 May 1997 were used for CASES. It was found that on an hourly time scale, for clear-sky conditions, the r.m.s. was in the range of 11–7%, if satellite sensor degradation was assumed. For all-sky
condition, the r.m.s. range was between 20 and 11%. For all-sky conditions, the range of the r.m.s. was between 10 and 9% on a daily time scale; while on a monthly time scale, it was between 8 and 4%. Ad-justments for estimated satellite sensor degradation substantially reduced the bias at all time scales, for both clear- and all-sky conditions, to about 1% (Meng et al., 1999).
6. Summary
aerosol climatology improved radiative flux retrieval from satellite observations and subsequent computa-tion of flux estimates. In addicomputa-tion, it was found that using measured values to initialize the aerosol optical depth in the retrieval of surface global irradiance, the surface albedo increased by about 0.02 on an average. Comparison of satellite estimates of radiative flux were made with data from the AZMET for 1997 to evaluate the procedures described. It was found that the current satellite estimates are within 70 W m−2of
the ground observations on an hourly time scale and within 24 W m−2 on a daily time scale. In the latter
case this is less than 10% of the mean. Use of actual observations of aerosols, as compared to climatolog-ical values, reduces the bias substantially, while less significant changes in the r.m.s. were found. In sum-mary, this study demonstrated that on a local scale, characterizations of aerosols, based even on a limited observational periods is preferred to estimates based on large-scale climatologies.
Acknowledgements
The work at the University of Maryland was sup-ported under grant NA57WC0340 from the NOAA Office of Global Programs, to the Cooperative In-stitute for Climate Studies, University of Maryland, grant NAG11832 from NASA, and grant G0036 from NASDA. The senior author also gratefully acknowl-edges support from NASA Interdisciplinary Science Project No. OSS A-A/88 while visiting the Univer-sity of Arizona. Support from the NSF-STC SAHRA (sustainability of semi-arid hydrology and riparian areas) under agreement No. EAR-9876800 is also gratefully acknowledged. Thanks are due to Q.-H. Li for computational assistance, to the AERONET group at Goddard Space Flight Center, Greenbelt, MD, for assistance with the aerosol data processing, F. Miskolczi, for the CIMEL set-up in Arizona, and the USDA-ARS group at Walnut Gulch, for the daily supervision of the CIMEL operation.
References
Avissar, R., Verstraete, M.M., 1990. The representation of conti-nental surface process in atmospheric models. Rev. Geophys. 28, 35–52.
Brown, P., 1989. Accessing the Arizona meteorological network by computer. The University of Arizona, College of Agriculture, Tucson, AZ 85721.
Cayan, D.R., Dettinger, M.D., Diaz, H.F., Graham, N.E., 1998. Decadal variability of precipitation over western North America. J. clim. 11, 3148–3166.
Chehbouni, A., Kerr, Y.H., Watts, C., Hartogensis, O., Goodrich, D.C., Scott, R.L., Schieldge, J., Lee, K., Shuttleworth, W.J., Dedieu, G., DeBruin, H., 2000. Estimation of area-average sensible heat flux using a large aperture scintillometer during the semi-arid-land-surface-atmosphere (SALSA) experiment. Water Resour. Res. 35 (8), 2505–2511.
Coakley Jr., J.A., Cess, R.D., 1983. The effect of tropospheric aerosols on the earth’s radiation budget: a parameterization for climate models. J. Atmos. Sci. 40, 116–138.
Curran, R., 1999. Global Aerosol Climatology Project Science Team Meets, 1999. GEWEX News 9, 10.
Curran, R., Mishchenko, M., Tegen, I., Geogdzhayev, I., 1998. Global Aerosol Climatology Project (GACP). Structure, Early Products and Plans GEWEX News 8, 3–4.
Dickinson, R., 1986. Global climate and its connection to the biosphere. In: Rosenzweig, C., Dickinson, R. (Eds.), Climate– vegetation Interactions, Proceedings of the Workshop held at NASA/Goddard Space Flight Center, Greenbelt, MD, January 27–29, 1986, pp. 5–8.
Goodrich, D.C., Simanton, J.R., 1995. Water research and management in semi-arid environments. J. Soil Water Conserv. 50 (5), 416–419.
Goodrich, D.C., Chehbouni, A., Goff, B., et al., 1998. An overview of the 1997 activities of the semi-arid land-surface-atmosphere (SALSA) program. In: Proc. 1998 Amer. Met. Soc., Special Symp. on Hydrology, Phoenix, AZ, January 11–16, pp. 1–7. Goodrich, D.C., Chehbouni, A., Goff, B., et al., 2000. The
semi-arid land-surface-atmosphere (SALSA) program: special issue preface paper. Agric. For. Meteorol. 105, 3–19. Henderson-Sellers, A., 1993. The project for intercomparison of
land-surface parameterization schemes. Bull. Am. Meteorol. Soc. 74, 1335–1350.
Hicks, B.B., DeLuisi, J.J., Matt, D., 1996. The NOAA integrated surface irradiance study (ISIS): a new surface radiation monitoring network. Bull. Am. Meteorol. Soc. 77, 2857–2864. Holben, B.N., Eck, T.F., Slutsker, I., Tanre, D., Buis, J.P., Seltzer, A., Vermote, E., Reagan, J.A., Kaufman, Y.J., Nakajima, T., Lavenu, F., Jankowiak, I., Smirnov, A., 1998. AERONET — a federated instrument network and data archive for aerosol characterization. Remote Sensing Environ. 66, 1–16. Hollinger, S.E., Reinke, B.C., Peppler, R.A., 1994. Illinois climate
network: site description, instrumentation, and data mana-gement. Illinois State Water Survey Circular 178. WARM Network Publication, Vol. 1, 63 pp.
King, M.D., Kaufman, Y.J., Tanré, D., Nakajima, T., 1999. Remote sensing of tropospheric aerosols from space: past, present and future. Bull. Am. Meterol. Soc. 80 (11), 2229–2259. Kustas, W.P., Goodrich, D.C., 1994. Preface to special section on
MONSOON’90. Water Resour. Res. 30 (5), 1211–1225. Kustas, W.P., et al., 1991. An interdisciplinary field study of the
over semi-arid rangelands: description and some preliminary results. Bull. Am. Meteorol. Soc. 72, 1683–1706.
Laszlo, I., Pinker, R.T., 1989. On the use of climatological infor-mation in physical models for surface insolation from space, IRS’88. In: Lenoble, J., Geleyn, J.F. (Eds.), Current Problems in Atmospheric Radiation. Deepak Publishing, Hampton, VA, pp. 302–305.
Laszlo, I., Pinker, R.T., 1990. Global aerosol optical depth estimates from satellites. In: Proceedings of the International Geoscience and Remote Sensing Symposium, IGARSS’90, Washington, DC, May 20–24, pp. 1019–1022.
Leese, J.A., 1994. Implementation Plan for the GEWEX Con-tinental Scale International Project (GCIP), 1994. Strategy Plan for Data Management, Vol. 3. International GEWEX Project Office Publication Series No. 9, 49 pp.
Leese, J.A., 1997. Major Activities Plan for 1998, 1999 and Outlook for 2000 for the GEWEX Continental Scale Inter-national Project (GCIP). IGPO Publication Series No. 26, 1997. Matthews, E., 1985. Atlas of archived vegetation, land-use and seasonal albedo data sets. NASA Technical Memorandum 86199, February 1985.
Meng, C.-J., Pinker, R.T., Tarpley, J.D., Laszlo, I., 2000. Use of ARM and CASES radiation measurements for evaluating GOES-8 satellite estimates of surface radiative fluxes. J. Geophys. Res., submitted for publication.
Moran, M.S., Williams, D.A., Goodrich, D.C., et al., 1998. Overview of remote sensing of semi-arid ecosystem function in the upper San Pedro river basin, Arizona. In: Proc. 1998 Amer. Met. Soc., Special Symp. on Hydrology, Phoenix, AZ, January 11–16, pp. 49–54.
Pandithurai, G., Pinker, R.T., Holben, B., 1999. Annual variation of aerosol optical properties in a semi-arid region as observed within the Aeronet framework. In: Proceedings of the 10th Conference on Atmospheric Radiation, Madison, Wisconsin, 26 June–2 July, 1999.
Pielke, R.A., Cotton, W.R., Walko, R.L., Tremback, C.J., Nicholls, M.E., Moran, M.D., Wesley, D.A., Lee, T.J., Copeland, J.H., 1992. A comprehensive meteorological modeling system — RAMS. Meteorol. Atmos. Phys. 49, 69–91.
Pinker, R.T., Ewing, J.A., 1985. Modeling surface solar radiation: model formulation and validation. J. Clim. Appl. Meteorol. 24, 389–401.
Pinker, R.T., Laszlo, I., 1992. Modeling surface solar irradiance for satellite applications on global scale. J. Appl. Meteorol. 31, 194–211.
Pinker, R.T., Kustas, W.P., Laszlo, I., Moran, M.S., Huete, A.R., 1994. Basin-scale solar irradiance estimates in semiarid regions using GOES 7. Water Resour. Res. 30 (5), 1375–1386. Pinker, R.T., Laszlo, I., Whitlock, C.H., Charlock, T.P., 1995.
Rad-iative flux opens new window on climate research. EOS, 76 (15), April 11, 1995.
Pinker, R.T., Tarpley, J.D., Laszlo, I., Mitchell, K., 2000. Surface radiation budgets in support of the GEWEX continental scale
international project (GCIP). J. Geophys. Res., submitted for publication.
Renard, K.G., Lane, L.J., Simanton, J.R., Emmerich, W.E., Stone, J.J., Weltz, M.A., Goodrich, D.C., Yakowitz, D.S., 1993. Agricultural impacts in an arid environment: Walnut Gulch. Hydrol. Sci. Technol. 9, 145–190.
Rogers, E., Black, T.L., Deavan, D.G., DiMego, G.J., 1996. Changes to the operational “early” Eta analysis/forecast system at the National Centers for Environmental Prediction. Weath. Forecast. 11, 391–413.
Rosenberg, N.J., Blad, B.L., Verma, S.B., 1983. Microclimate, the Biological Environment. Wiley/Interscience, New York, 495 pp. Russell, P.B., Hobbs, P.V., Stowe, L.L., 1999. Aerosol properties and radiative effects in the United States East Coast haze plume: an overview of the tropospheric aerosol radiative forcing observational experiment. J. Atmos. Sci. 43, 505–531. Sellers, P.J., Mintz, Y., Sud, Y.C., Dalcher, A., 1986. A simple
biosphere model (SiB) for use within general circulation models, 1986. J. Atmos. Sci. 43, 505–531.
Takamura, T., Sasano, Y., Hayasaka, T., 1994. Tropospheric optical properties from Lidar, Sun photometer, and optical particle counter measurements. Appl. Opt. 33 (30), 7132–7140. Tarpley, J.D., Pinker, R.T., Laszlo, I., 1996. Experimental GOES
shortwave radiation budget for GCIP. In: Proceedings of the Second International Scientific Conference on the Global Energy and Water Cycle, Washington, DC, June 17–21, 1996.
Toth, J.J., 1997. Coupling Landsat data with a mesoscale model to estimate evapotranspiration. In: Proc. 1997 Amer. Met. Soc., 13th Conference on Hydrology, Long Beach, CA, February 2–7, pp. 375–377.
Toth, J.J., Goodrich, D.C., Moran, M.S., Scott, R., et al., 1998. An overview of spatially distributed surface fluxes of heat and moisture across the semi-arid San Pedro Basin. In: Proc. 1998 Amer. Met. Soc., Special Symp. on Hydrology, Phoenix, AZ, January 11–16, p. 12.
WCP-55, 1983. World climate research report of the experts meeting on aerosols and their climatic effects. In: Deepak, A., Gerber, H.E. (Eds.), Williamsburg, Virginia, March 28–30, 1983, 107 pp.
WCRP-67, 1992a. GEWEX continental scale international project. WMO/TD-No. 461. Weinreb, M.P., Calibration of GOES-I imager and sounder. AGU Spring 1994 Meeting, Baltimore, MD, May 23–27, A22B-8, p. 83.
WCRP-67, 1992b. GEWEX continental scale international project. WMO/TD-No. 461, 1996.
Weinreb, M.P., Jamieson, M., Fulton, N., Chen, Y., Johnson, J.X., Bremer, J., Smith, C., Baucom, J., 1997. Operational calibration of geostationary operational environmental satellite-8 and 9 imagers and sounders. Appl. Optics 36, 6895–6904.