AN AUTOMATIC METHOD FOR GEOMETRIC SEGMENTATION OF MASONRY
ARCH BRIDGES FOR STRUCTURAL ENGINEERING PURPOSES
B. Riveiro a, *, M. DeJong b, B. Conde a
a
Dept. of Materials Engineering, Applied Mechanics & Construction, University of Vigo, 36208 Vigo, Spain - (belenriveiro, bconde)@uvigo.es
b
Dept. of Engineering, University of Cambridge, CB2 1PZ. Cambridge, United Kingdom - [email protected]
Commission V, WG V/4
KEY WORDS: LiDAR; point clouds; automatic processing; masonry arch bridges; image processing.
ABSTRACT:
Despite the tremendous advantages of the laser scanning technology for the geometric characterization of built constructions, there are important limitations preventing more widespread implementation in the structural engineering domain. Even though the technology provides extensive and accurate information to perform structural assessment and health monitoring, many people are resistant to the technology due to the processing times involved. Thus, new methods that can automatically process LiDAR data and subsequently provide an automatic and organized interpretation are required.
This paper presents a new method for fully automated point cloud segmentation of masonry arch bridges. The method efficiently creates segmented, spatially related and organized point clouds, which each contain the relevant geometric data for a particular component (pier, arch, spandrel wall, etc.) of the structure. The segmentation procedure comprises a heuristic approach for the separation of different vertical walls, and later image processing tools adapted to voxel structures allows the efficient segmentation of the main structural elements of the bridge. The proposed methodology provides the essential processed data required for structural assessment of masonry arch bridges based on geometric anomalies. The method is validated using a representative sample of masonry arch bridges in Spain.
1. INTRODUCTION
Geomatic technologies gained popularity in the last years related to the tasks involving geometric characterization. The main advantage of these technologies is the non-destructive nature together with the transversal applications of the technologies to many different fields. Thus, these technologies represent a very attractive and powerful tool for the study of historic constructions. Among other technologies, Laser Scanning gained popularity in civil engineering in the last years due to its diverse applicability, that goes from the creation of geometric 3D models that can be used for the creation of accurate updated drawings, serve as the geometric basis for subsequent structural analysis or contribute to the objective quantification of structural damages.
According to (Orbán, 2007) more than 200,000 masonry arch bridges, representing approximately 60% of the total bridge stock, are in service. Even more than 70% date from XIX century, approximately 12% are older than 150 years (dating from Mediaeval or even from the Roman period). This fact makes that modern society realize that apart from their value as elements of the transport network, they also have an incalculable value as heritage elements.
After several centuries in service, masonry arch bridges have been in many cases subjected to a significant increase in the loading for which they were designed. The effect of different loading (static, dynamic, cyclic) together with accumulative effects, provokes gradual changes of geometry along time. It is well known that the geometry of this typology of bridge is a key factor in terms of they load carrying capacity (Heyman, 1969; Livesley, 1978; Gilvert, 2007). The change of use, incorrect conservation policies and the increase of the loadings along
their life has probably provoked changes in geometry, and so, changes in the shape of the arches may be comprising the stability and load capacity. Most of the problems of these bridges are detectable through geometric anomalies, however the signs of structural problems are commonly manifested by subtle geometric changes so very accurate and detailed geometric characterization is required to provide a proper diagnosis.
Automation is nowadays one of the main challenges of the technology, and thus, many authors have proposed semi-automatic or semi-automatic methods to contribute to the application of that powerful source of data to different fields of engineering: Laefer et al. (2010) use TLS as a method to collect data that can be used later for the automatic crack detection in building façades. Olsen et al (2010) propose damage assessment based on laser scanning to perform damage detection and volumetric change analysis. Truong-Hong et al. (2013) propose a method to automatically process point clouds and derive an CAD models suitable for subsequent structural computations. For the particular case of masonry structures methods have been proposed for the individual modelling of stones (Riveiro et al, 2015; McInerney et al, 2012). As mentioned above, in the case of masonry arch bridges it is very important the geometric anomalies that permits perform inverse analysis and, thus, to speculate how the different elements of the bridge have been deformed along time.
In this paper, a new method for fully automated point cloud segmentation of masonry arch bridges is proposed. The segmentation procedure comprises a heuristic approach for the separation of different vertical walls, and later image processing tools adapted to voxel structures allows the efficient segmentation of the main structural elements of the bridge,
which provide the essential data required for structural health monitoring based on geometric anomalies. Moreover, this paper aims to show a method to easily handle large point clouds and provide civil engineers with processed data for further structural operations without neither requiring training in laser scanning technology nor high performance computers for such data processing. Our detailed methodology is explained in Section 2, and the results obtained for a set of masonry arch bridges in Spain are presented in Section 3. Finally, conclusion and suggestions for future research are given in Section 4.
2. METHODOLOGY
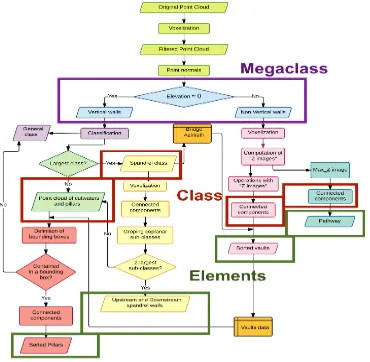
The proposed method focused on using the geometric data of 3D point clouds collected by laser scanning systems having into account the topological constrains of masonry arch bridges. Since the proposed method aims to be a tool for construction and structural engineers it starts with a registered point cloud of the bridges because it is the most primitive product delivered by the surveyors. The partition of the global point cloud in its composing elements is made combining an heuristic method for the vertical walls segmentation together with image processing tools adapted to the 3D space for the non vertical walls of the bridge. Later, topological constrains contributed to define the order and name of elements in order to store the independent point clouds coherently with the databases for masonry arch bridges. Figure 1 shows the general workflow of the methodology developed whose steps are described further in the next subsections.
2.1 Point cloud reduction and computation of normals The point cloud of a large construction such as a masonry arch bridge may be composed of several millions of points that, in case of not filtered after point clouds alignment, might contain redundant or noisy data. Also, the level of detail offered by laser scanners in such a large structure sometimes exceeds the requirements for the geometrical inventory and/or inspection of the composing elements.
On the other hand, the approach developed in this work is based on finding a pattern for segmentation of point cloud, without demanding large computing resources. For that aim, the method start with a 3D filtering of the original point cloud based on image processing approaches in the 3D space, taking advantage of the information provided by the laser scanning data. Working with a downsampled point cloud permits to perform all the segmentation operations in a fast manner without high computing resources. However, in case the full resolution of the original point cloud is needed for the further application of data, the method uses the results of segmentation obtained as a pattern to partition the original point cloud.
After having the downsampled point cloud the normal of points are computed using Principal Components Analysis, whose method does not only permitted to compute the normal direction of each point, but also provided information about the dimensionality of data based on the eigenvalues of the covariance matrix (as presented by Gressin et al., 2013). With
!
Figure 1. UML diagram of the proposed method for the segmentation of masonry arch bridges point clouds.
the aim of minimize noisy effects during the subsequent segmentation operations, after evaluating dimensionality of points, only those classified as 2D features, were selected for subsequent segmentation.
For our segmentation, the elevation angle and the azimuth of each point is a valuable information for the classification of points, so the normal vector obtained by using PCA is converted to a spherical coordinate system.
The immediate strategy consists of classifying points based on their elevation angle. For the case of masonry arch bridges, spandrel walls are vertical walls that provide valuable topologic information of the bridge, and consequently, this must be one of the first classes to characterize in the point cloud under processing. The classification based on elevation is performed in order to distinguish main groups of elements: vertical walls (comprising spandrel walls, pillars, cutwaters, abutments, etc.) and non-vertical walls (arches, pathway, cutwater hats, etc.). To compute the optimal threshold that separate vertical from non-vertical points, the histogram of elevation angles clearly shows how vertical points have an elevation close to zero.
2.2 Segmentation of vertical walls
Once points have been separated into vertical and non-vertical classes, customized methods can applied to these different classes in order to segment them into the different features they may comprise. Since spandrel walls contain relevant information of the bridge, such as being the most populated class of vertical walls, it contains information of the azimuth of the bridge. At the same time it represent the “bounding box” of the key structural elements of the bridge, these are, vaults and pillars.
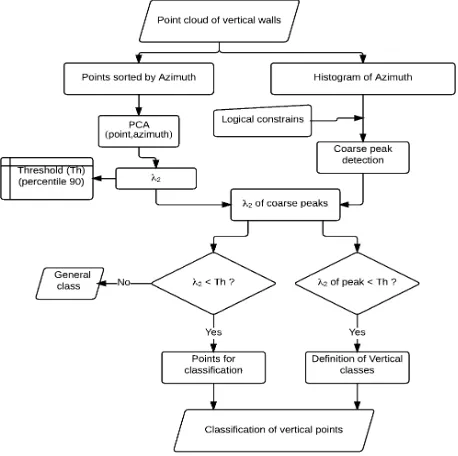
2.2.1 Heuristic method to compute vertical classes: Similarly to the segmentation based on elevation, the azimuth can be used as relevant variable to differentiate the different vertical planes composing the bridge. The histogram of azimuth for the vertical points may present several peaks, and not logical reference can be set for the azimuth of the bridge (unless this information is provided a priori).
Figure 2. UML diagram of the heuristic process for the segmentation of points that belong to vertical walls.
In the histogram several peaks are denoting the presence of vertical walls with different orientation. The most populated class is expected to represent spandrel walls, however, it is important not only detect peaks but also the whole interval of azimuths for each class. For that purpose the strategy consisted of performing a coarse peak detection on the histogram plot. Ideally, this peak detection would notice the peaks corresponding to the main vertical classes, but also some other noisy peaks can be computed. For the peak detection logical constrains were imposed such as a minimum distance between peaks. This condition ensures that the spandrel walls would be clearly separated from the other classes such as pillars or cutwaters, which generally have a difference in azimuth angle larger than 30º (almost perpendicular in the case of pillar walls). The process for segmentation is presented in figure 2, and it is based on the plots presented in figure 3.
Figure 3. Process for the segmentation of vertical walls: 3a)Histogram of azimuth angle, and coarse peak detection; 3b) Peaks detected superimposed to the plot of points points sorted by azimuth; 3c) detection of real peaks and partition of classes
as a function of λ2.
As it can be seen in the in the plots of figure 3, there exists a relationship between the peaks in the histogram (figure 3a) and the flat areas of the points sorted by azimuth (figure 3b). In the example, there are two peaks that correspond to a sloped area denoting the false peaks.
A PCA analysis was applied for the two variables used for the plot of figure 3b using the covariance method to evaluate the second eigenvector (λ2), which provides a measure of the homogeneity of the azimuth for a given neighbourhood of every single point. As can be seen in figure 3c, those flat areas in which we could expect real peaks, show a value close to zero. However, those other sloped parts of the plot shown in figure
3b, confirm that false peaks show a clearly higher value of λ2, and they are removed applying a threshold based on this parameter. To avoid the user intervention, this threshold was computed as the λ2 of the percentile 90 of the entire set of points (since very few points are in the sloped regions of plot 3b). By applying this threshold to both, the peaks and the points of vertical walls under evaluation, it was possible to set the classes for azimuth defined both by the azimuth of each peach (mark of class) and the corresponding interval of azimuths (computed from the previous partition of the plot).
From the previous classification, spandrel walls are segmented as the most populated class, and the other classes are saved as a general class that contain points of pillars and cutwaters, that would be segmented further in the next phases of the methodology. Before the previously segmented “spandrel class” can be divided into upstream and downstream spandrel, it must be checked if there is a continuous surface for each wall or, in case they appear partitioned (e.g. when a cutwater separate the points in two portions). In that last case, the resulting partitioned point clouds of the “spandrelwall class” have to be evaluated for coplanarity (section 2.2.3).
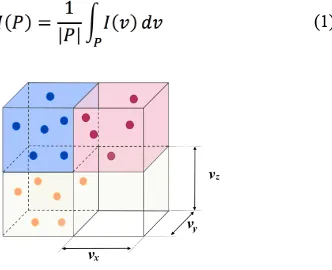
2.2.2 Voxelization: The strategy to compute whether the sets of points define continuous surfaces or not consisted of converting the 3D point cloud to a voxel-based space. The voxelization basically consisted of dividing the 3D space in a regular 3D grid, where the size of each voxel can be defined as the volume defined by the voxel size in each direction of the 3D space: vx, vy and vz. The boundary of the voxelized point cloud is calculated from the maximum and minimum coordinates of the point cloud in the three dimensions. For the works related in this paper, a voxel size of 10cm was defined by the user. As a consequence, a raster grid of m rows, n columns and p
elevations is created. In continuation, the next step is defining the intensity attribute for each element in the raster structure that can be computed of any of the data available for each point. The intensity attribute of a volume V of the point cloud can be modelled as the random field {I(v): v ∈V ⊂ R3}. The set of points of the point cloud covering the element volume can be considered as the collection of independent observations at locations v = {v1, v2, … , vn} on the random field, and is denoted by the data vector I(v) = {I(v1), I(v2), …, I(vn)}. Consequently, the voxelized representation of the point cloud consists of latticing the continuous domain V and computing a value of intensity I for each voxel. For a given voxel defined by the region P and the corresponding volume |P|, it is possible to estimate the intensity of the voxel averaging the random field in
P (equation 1):
(1)
Figure 4. Voxel structure where the intensity of each element is computed from the colour of points contained in each element.
The value of the I(P) is computed by using the observed data (point cloud sample) contained in the region of the voxel. Consequently, the spatial resolution of the results of the classification proposed here will be constrained by the window size for I prediction: the voxel size. Figure 4 illustrates the process of voxelization of a point cloud, where the Intensity value of each voxel is computed from the colour of the point cloud contained in the voxel volume.
2.2.3 Clustering: The clustering strategy consisted of using a connected components algorithm (Samet and Tamminen, 1988; Dillencourt et al., 1992). For the application of this algorithm, a binary 3D image was created marking those voxels that contain, at least, one point. The connected components algorithm was applied to this image using a connectivity of 26 voxels, and then, only those classes containing a significant number of connected elements were considered for the further segmentation steps. This threshold also contributed to the removal of noise (isolated points). Those points contained in the previous selected voxels were labelled according their connectivity, so the point cloud was again segmented in a larger number of classes. These classes may belong to one of the spandrel walls, or may belong to cutwaters, or even noisy classes. Finally, in order to group those classes that may belong to the same spandrel wall, the algorithm checks if the clusters of points are coplanar or not. A coarse azimuth was computed using all the points classified as potential spandrel walls using a PCA. From this step, points were labelled as upstream wall, downstream wall, and other classes were merged together with the class of the pillars and cutwaters. Azimuth is now recomputed from the two classes finally labelled as spandrel walls.
2.3 Segmentation of non-vertical walls
The point cloud classified as “non-vertical points” in section 2.1. was used to perform the segmentation of vaults and pathway. To achieve the segmentation, the strategy consisted of performing a voxelization of the point cloud an thus, creating different 3D images from which the different structural elements could be extracted by applying logical operations.
2.3.1 Voxelization and image operations: Similarly as explained in section 2.2.2. voxelization was performed to the point cloud of non-vertical walls. As it can be seen in Figure 5, the voxel image show how those voxels corresponding to vaults are clearly connected and separated of voxels of pathway or parapets. Also, those voxels containing noisy points appear in the image in small groups of connected voxels.
Figure 5. Voxel image of non vertical walls.
In order to separate vaults from the other points, two binary images were created from a voxelized image computed from the
“z coordinates” of points: the first one corresponds to the image elements was performed operating with the previous images. This is, the arches (C) can be obtained as: C=B-(A∩B).
For image C, a threshold based on connected components is applied to remove noisy points and to cluster each vault individually. For each vault point cloud, some geometrical parameter are calculated for the subsequent labelling of elements, and further segmentation of pillars. Those parameters are: centre of mass of each point cloud , and the spatial limits for each vault xi max, xi min, yi max, yi min, zi max, zi min, being i the number of vaults.
Having information of the longitudinal direction of the bridge (from the Azimuth calculated in section 2.2.3., the point clouds corresponding to arches are labelled numerically from left to right looking at the bridge from upstream.
2.3.3 Clustering pathway: Before saving the points of the Subsequently, a voxelization followed of thresholding baed on connected components was performed for each class to remove the noisy points before they are saved as pathway and parapets classes, respectively.
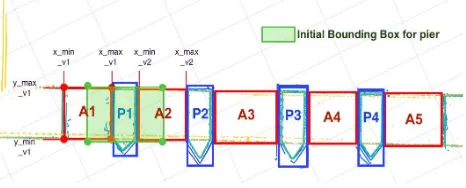
2.3.4 Clustering Piers: Finally, for the case of slender arch bridges where pillars are visible, these elements have to be also segmented. This segmentation is accomplished using the point cloud remaining from the vertical walls not classified as spandrel walls. Using logical reasoning, one realizes that piers are always vertical elements in the interface between two consecutive arches. According to this, by using the coordinates extracted from the previous segmentation of vaults, it was consecutive vaults and the upstream and downstream spandrel walls.
Figure 6. Bounding boxes of structural elements to find pier points.
This allowed partitioning the point cloud in shorter point clouds corresponding to piers. Finally, to remove noisy points and maintain only those significant points of the pillar walls, voxelization followed of thresholding using connected
components was applied in a similar manner than for the other structural elements. Finally, the point cloud of each pillar was point clouds of five masonry arch bridges in Spain, selected as representative of common bridge typologies. They account for the following variations: different numbers of arches, presence or not of cutwaters, presence or not of piers, and some cases where the point cloud was deficient (occlusions and low density of points).
3.2 Validation of algorithms
All the point clouds were collected using a pulse-based TLS laser scanner manufactured by Riegl, model LMS Z-390i. The methodology for data acquisition was explained in Solla et al. (2013). The alignment of scans in a common coordinate system for each bridge was performed in the software Riscan Pro® produced by Riegl. For each case study, the points of the bridge were coarsely segmented from the surrounding points (embankments, access road, vegetation, etc. in the software Riscan Pro. In continuation, an octree filtering with a minimum element size of 2.5cm was applied to the point cloud before it was exported to the Ascii format containing the 3D spatial coordinates of each point (X, Y, Z). Table 1 summarizes the characteristics of the survey data for each masonry bridge used for the evaluation of the proposed procedure.
Bridge Length
Table 1. Summary of the laser scanning survey of the bridges used to validate the algorithm.
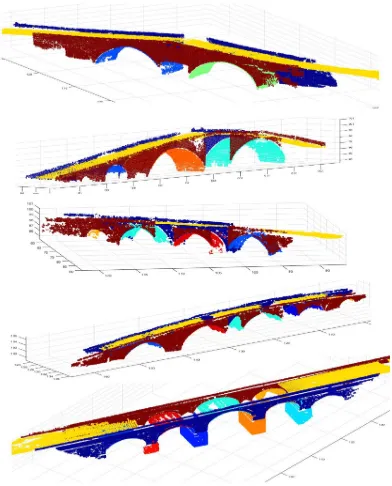
For all of the bridges the segmentation of spandrel walls, arches, pathway and cutwaters was performed. For Segura Bridge, piers were also segmented. Figure 7 presents the results of segmentation where different colours refer to different point clouds. Cutwaters were removed from the point clouds shown in Figure 7 to ease the visualization of the structural elements of the bridge.
The principal cause of errors during the classification was the low quality of some point clouds. Low quality refers both to occlusions and to low point densities, both of which can negatively affect the performance of the algorithms. Low point densities cause the following main issues:
- Low density point clouds may cause some elements to be missed from the segmentation. As expected, low density points can be classified as noisy due to large separation distances. - The low density of points can significantly affect the operation of clustering using connected components. First, low point densities cause empty voxels, which may cause an insufficient number of connected components. To overcome this problem, the user can change two parameters: the voxel size can be
increased or the connectivity constraints can be reduced (i.e. reduce the number of connected elements); and second, the threshold applied to the connected element clusters, which is a function of the largest cluster of connected components. If one vault has a much larger number of elements than another, the smaller vault might be lost.
A common problem related to occlusions in masonry arch bridges occurs in river bridges where access to the underside of vaults is difficult. For these cases, occlusions often occur at the apex of the arches, and sometimes also in the spandrel walls because of the cutwater shadows.
Figure 7. Results of segmentation of Spanish masonry arch bridges, from top to bottom: Allariz, Carracedo, Traba,
Cernadela and Segura.
4. CONCLUSIONS
A novel method for the automatic segmentation of historic masonry arch bridges was developed and tested. Based on the topological properties of points, automatic geometric segmentation of bridges was achieved. The process involves initial segmentation of vertical walls and non-vertical walls, following by different approaches for each of these initial megaclasses. For the estimation of the number of vertical walls (classified by azimuth angle) a heuristic model is proposed based on logical constraints. Voxelization and connected components algorithms are then used for both vertical and non-vertical walls to partition the point clouds into sub-classes corresponding to the different structural elements.
The algorithm was evaluated using data from a set of five representative historic masonry arch bridges located in Spain. The results of segmentation were coherent for all of the bridges. Some minor problems related to the quality of the point cloud were reported: occlusions and areas of low point density can cause elements to be missed or classified as noisy. The good results found during validation indicate that the method could provide a new step towards the management of large datasets composed of millions of 3D Points. More specifically, it could enable computationally efficient extraction of data from important features of a particular bridge, allowing direct
inspection or assessment, or further processing of a much smaller subset of data for a specific purpose. This is an important step towards more widespread exploitation of laser scanning technology in the civil engineering domain.
REFERENCES
Dillencourt, M. B., Samet, H. & Tamminen, M., 1992. A general approach to connected-component labeling for arbitrary image representations. Journal of the ACM (JACM), 39(2), pp. 253-280.
Gilbert, M., 2007. Limit analysis applied to masonry arch bridges: state-of-the-art and recent developments. In: 5th International Conference on Arch Bridges (ARCH’07), Madeira, Portugal, 2007, pp. 13-28.
Gressin, A., Mallet, C., Demantké, J., & David, N., 2013. Towards 3D lidar point cloud registration improvement using optimal neighborhood knowledge. ISPRS Journal of Photogrammetry and Remote Sensing, 79, pp. 240-251.
Heyman J., 1969. The safety of masonry arches. International Journal of Mechanical Science, 11, pp. 363–85.
Laefer, D. F., Gannon, J., & Deely, E., 2010. Reliability of crack detection methods for baseline condition assessments.
Journal of Infrastructure Systems, 16(2), pp. 129-137.
Livesley RK. 1978. Limit analysis of structures formed from rigid blocks. International Journal for Numerical Methods in Engineering, 12, pp. 1853–71.
McInerney J., Trzcinski I. & DeJong, M. J., 2012. Discrete element modelling of masonry using laser scanning data. In 8th International Conference on Structural Analysis of Historical Constructions, Wroclaw, Poland.
Olsen, M. J., Kuester, F., Chang, B. J., & Hutchinson, T. C., 2009. Terrestrial laser scanning-based structural damage assessment. Journal of Computing in Civil Engineering, 24(3), pp. 264-272.
Orbán, Z., 2007. UIC project on assessment, inspection and maintenance of masonry arch railway bridges. In Bień, J., Elfgren, L., and Olofsson, J. (Eds). Sustainable Bridges– Assessment for Future Traffic Demands and Longer Lives. Dolnośląskie Wydawnictwo Edukacyjne, Wrocław, Poland.
Riveiro, B., Lourenço, P. B., Oliveira, D. V., González-Jorge, H., & Arias, P., 2016. Automatic Morphologic Analysis of Quasi-Periodic Masonry Walls from LiDAR. Computer-Aided Civil and Infrastructure Engineering, 31, pp. 305–319.
Samet, H., & Tamminen, M., 1988. Efficient component labeling of images of arbitrary dimension represented by linear bintrees. Pattern Analysis and Machine Intelligence, IEEE Transactions on, 10(4), pp. 579-586.
Solla, M., Riveiro, B., Lorenzo, H., & Armesto, J., 2013. Ancient stone bridge surveying by ground-penetrating radar and numerical modeling methods. Journal of Bridge Engineering, 19(1), pp. 110-119.
Truong-Hong, L., Laefer, D. F., Hinks, T., & Carr, H., 2013. Combining an angle criterion with voxelization and the flying voxel method in reconstructing building models from LiDAR data. Computer-Aided Civil and Infrastructure Engineering, 28(2), pp. 112-129.