A KERNEL METHOD BASED ON TOPIC MODEL FOR VERY HIGH SPATIAL
RESOLUTION (VHSR) REMOTE SENSING IMAGE CLASSIFICATION
Linmei WUa , Li SHENa, b, *, Zhipeng LIa
a Faculty of Geosciences and Environmental Engineering, Southwest Jiaotong University, Chengdu 610031, PR China - [email protected], [email protected], [email protected]
b State-province Joint Engineering Laboratory of Spatial Information Technology for High-Speed Railway Safety, Southwest Jiaotong University, Chengdu 610031, PR China - [email protected]
Commission VII, WG VII/4
KEY WORDS: VHSR remote sensing image, Classification, Support vector machine (SVM), Composite kernel, Latent Dirichlet allocation (LDA), Structure, Spatial, Spectral.
ABSTRACT:
A kernel-based method for very high spatial resolution remote sensing image classification is proposed in this article. The new kernel method is based on spectral-spatial information and structure information as well, which is acquired from topic model, Latent Dirichlet Allocation model. The final kernel function is defined asK , u K1 spec u K2 spat u K3 stru
, in whichKspec,Kspat,Kstru are radial basis
function (RBF) andu1 u2 u3 1. In the experiment, comparison with three other kernel methods, including the spectral-based, the spectral- and spatial-based and the spectral- and structure-based method, is provided for a panchromatic QuickBird image of a suburban area with a size of 900×900 pixels and spatial resolution of 0.6m. The result shows that the overall accuracy of the spectral- and structure-based kernel method is 80%, which is higher than the spectral-based kernel method, as well as the spectral- and spatial-based which accuracy respectively is 67% and 74%. What’s more, the accuracy of the proposed composite kernel method that jointly uses the spectral, spatial, and structure information is highest among the four methods which is increased to 83%. On the other hand, the result of the experiment also verifies the validity of the expression of structure information about the remote sensing image.
1. INTRODUCTION
With statistical learning methods, the extraction of information from remote sensing images can be easy and quick. Support vector machine (SVM) is one of the kernel based machine learning algorithm, which has excellent performance in image classification in terms of accuracy and robustness (Camps et al, 2006). And it is conventional to use spectral information of sample as the input data to learning classifier (Chen et al, 2008). Due to recent advances in remote sensor technology, the spatial resolution of the image is getting higher and higher. And the kernel-based method which only uses the spectral information would cause much “pepper and salt” effect in the results (Yi et al, 2011).
To solve this problem, the spatial information among pixels is joint used with composite kernel (Camps et al, 2006). Camps et al defined neighbourhood of a pixel with those pixels that belong to a square centered on it. And then the spatial information of pixel is modeled with the mean or standard deviation of grayscale values of those pixels in its neighbourhood. Furthermore, textural information which is characterized by a wavelet-based multi-scale strategy is applied to model spatial information (Mercier et al, 2006). Fauvel et al took the validity of neighbourhood into account. And he proposed a new method that models the spatial information with the median of grayscale values of those pixels in its morphological neighbourhood which is defined adaptively (Fauvel et al, 2012).
All these composite kernel-based method mentioned above are lack of structure information. So, in this article, a new kernel-based method which concentrates on spectral information, spatial
* Corresponding author
information, as well as structure information is proposed. Therefore, the first goal of our work is to find out a way to model structure information of remote sensing image. To solve this problem, we introduced the topic model to our work.
Topic model which is proposed firstly in text analysis domain, is initially developed for statistical text modeling to topic discovery in large document collection (Lienou et al, 2010). Except for text analysis, the topic model has been successfully used for nature image annotation and category. With it in remote sensing image classification, mapping low-level features to high-level semantics is available, and estimating the gap between them as well (Xu et al, 2013). Probabilistic latent semantic analysis (pLSA) and latent Dirichlet allocation (LDA) are conventional topic models. In LDA model, all topics is generated from words, and each document is in form of the mixture of latent topics. To some extent, the mixture of latent topics describes the component of the document. And, it is available to define the structure information of the document as the mixture of latent topics. Therefore, the proposed method pay attention on how to joint use spectral information, spatial information, as well as structure information which is modelled with LDA model, for very high spatial resolution remote sensing image classification. For LDA model in the proposed method, an analogue of words and documents is built as grayscale values and segments. And the topics is defined as geo-object classes.
support vector machine is introduced. The experiment result will be shown in Section IV. Finally, we will conclude in Section V.
2. TOPIC MODEL
Topic model is developed initially in text analysis domain for category and annotation. Probabilistic latent semantic analysis (pLSA) and latent Dirichlet allocation (LDA) are generally used. And those topic models have successfully applied in nature image domain, and remote sensing image domain as well. As LDA model is applied in the proposed method, we will firstly introduce the principle of it briefly. And then, we will focus on how it works in remote sensing image domain. Finally, how to use it to model structure information of the image will be presented in detail.
2.1 Latent Dirichlet Allocation (LDA) Model
Comparing with probabilistic latent semantic analysis (pLSA), LDA model treats the topic mixture parameters as variables which follow a Dirichlet distribution. In LDA model, a corpus of document is needed. And each document is identified with statistics of the words based on bag of words (BOW) assumption. Figure 1 shows the generation process of LDA model.
Figure 1. The generation process of LDA model
As shown in Figure 1, and are hyperparameters of Dirichlet distributions. Dirichlet( ) , Dirichlet( ) . The dimension of vector depends on the number of topics and vector is based on the size of vocabulary. For the word w , the probability to generate it is p w t( | , ) , in which
( )
t Multinomial . According to the generation process of LDA model, the joint probability among hyperparametersand
, word w and topictcan be given as follows: model for text analysis, the key point is to calculate the posteriori probability ( | )p t w , which can be written as: probability in the molecular of the right part in formula (2), can be expressed as follows:
( , | , ) ( | ) ( | , )
p t w p t p w t (3) As the hyperparameters and are related with all the variables , , ,t w , it is difficult to infer the conditional probability in formula (3). But it is easy to simulate it with Gibbs sampler running a Markov chain (Heinrich, 2008). And the
Num denotes the number of words which topic label is
t in the document d . And w t
Num denotes the number of word
w which topic label ist. t andw is the element of T
N
-dimentional and W
N -dimensitional Dirichlet random various vector and , in which T
N denote the number of topics and W
N is the size of vocabulary.
2.2 Structure Information
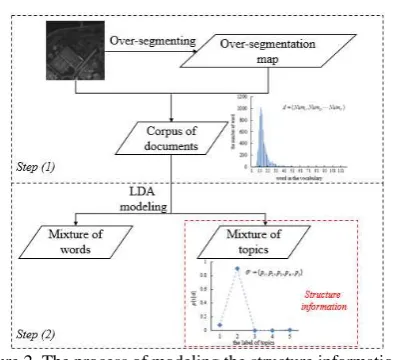
When LDA model is applied in remote sensing classification, the first problem is how to define an analogue of the topics, documents, as well as words in the remote sensing image domain. In the proposed method, we follow the definition of the analogues in (Tang et al, 2013) and (Shen et al, 2014), that the grayscale values are treated as words, segments are to documents, and the geo-object classes are to topics. Therefore, using LDA model to model structure information can be determined by accomplishing the follow steps:
(1) Organizing the image into a corpus of documents
As we define the segment of image into document, firstly, it is necessary to over-segment the initial remote sensing image. And segments of the over-segmentation map will constitute the corpus of document , 1,2, , D
i
d i N , in which D
N denotes to the number of documents (segments of the over-segmentation map). And then, the document (segment) should be described as the grayscale values of the remote sensing image.
(2) Modeling the structure information based on LDA model
Firstly in this step, parameters, i.e.,, and T
N , should be set. And the mixture of topics (geo-object class) of each document (segment) should be initialized, so that the Gibbs sampler running a Markov chain can be applied. And then those parameters and
i
d will be the input data for LDA model. Finally, the model will
output , according to formula (4) and formula (5). The document (segment) is in form of mixture of topics (geo-object classes), and the topic (geo-object class) is in form of mixture of words (grayscale values). As informed in Section I, the mixture of topics describes the component of the document, so that it can be the structure information of the document.
Figure 2. The process of modeling the structure information of the remote sensing image.
3. STRCTURE-SPATIAL-SPECTRAL SUPPORT VECTOR MACHINE
This section is dedicated in the support vector machine (SVM) based on spectral, spatial, as well as structure information. To building SVM classifier, first of all, it is need to define a kernel function between the features and the class label of samples. For
Ndimensional features:
Here, Rtunes the variance of the Gaussian kernel function and d d1, 2are both Ndimensional features in form of a vector. Thanks to the linearity property of the kernel function, it is possible to build a new kernel function that joint uses different features for the kernel classifier. The linearity property is to say: if K1 andK2are both kernel functions, andu u1, 20, then
1 1 2 2
u K u K is also a kernel function (Fauvel et al, 2012). With this principle into remote sensing image classification, the composite kernel function can be given as follows:
1 1 2 2 article, it is desired to obtain a kernel function which is based on spectral, spatial and structure information. Therefore, the composite kernel function is defined as:
1 2 3 features, spatial features, and structure features, respectively. For our experiment, u10.6 , u20.2 , u30.2 and
1 2 3
which will be determined by the program during
the studying from the samples. In the proposed method, spectral information is the grayscale values of the digital image. Especially, it is 1-dimensional vector for the panchromatic image. And the definition of spatial information is followed as (Fauvel
et al, 2012) that using average of grayscale values of all pixels which are in the neighbourhood. In our article, the neighbourhood is defined with the segment. It means that the
segment which the pixel belongs to is act as the neighbourhood of this pixel. And the structure information also is regional feature that denotes the component of the document (segment), which is modelled by LDA model. Figure 3 shows the process of the proposed method.
Figure 3. The process of the proposed method.
4. EXPERIMENTAL RESULTS
In this section, the details of experiment is demonstrated. Firstly, we will introduce the data we use, and then it is the experiment result will be present. Finally, we will give an accuracy assessment of the result based on overall accuracy (OA) and kappa coefficient. Furthermore, discussion about the parameter sensibility of the proposed method will be shown in the next section.
4.1 Experiment Data
The panchromatic image can provide more rich details of the earth's surface. So, a panchromatic QuickBird image is used in our experiment. The image we use is acquired on April 22, 2006, with a size of 900 900 pixels and 0.6m spatial resolution, as shown in Figure 4(a). And the cover area is located in Tong Zhou district of Beijing, China, in which the major geo-object classes include water bodies, buildings, fields, roads, shadows and trees. The ground truth map is shown in Figure 4(b).
(a) QuickBird image (b) Ground Truth map Figure 4. The panchromatic QuickBird image (a) and the
ground truth map (b).
4.2 Experiment and result
In this part, comparison of the proposed method and other kernel methods, i.e. original spectral-based kernel and spectral-spatial-based kernel. For the SVM, we should tune three parameters: penalty term C , width of the Gaussian kernel and weightuifor the composite kernel. In our experiment, the previous two parameters are chosen by the SVM program according to the characteristic of the sample from { 2, 1,0,1,2} . The last parameter uiis defined as table 1 shown.
spec
u uspat ustru
K_Spec 1 0 0
K_Spec+K_Spat 0.5 0.5 0
K_Spec+K_Stru 0.5 0 0.5
K_Spec+K_Spat+K_Stru 0.6 0.2 0.2
As shown in Figure 5, (a) is the result to the original kernel method, (b) comes from the spectral-spatial-based kernel method, (c) is the classification map of spectral-structure-based kernel approach, and (d) is the classification map using the proposed composite kernel method.
(a) K_Spec (b) K_Spec+K_Spat
(c) K_Spec+K_Stru (d) K_Spec+K_Spat+K_Stru Figure 5 Comparison of the proposed composite kernel
approach with other kernel-based methods
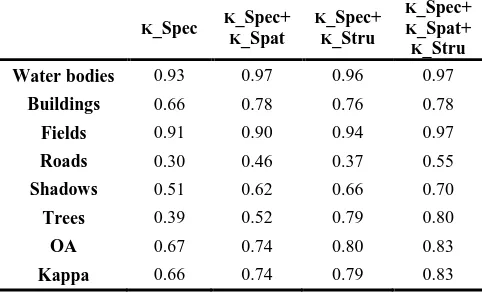
In our experiment, overall accuracy and Kappa coefficient are used to estimate the accuracy of the proposed method. And the accuracy of experiment is reported in table2.
Table 2. The accuracy of different geo-object classes using different methods in our experiments, and overall accuracy and kappa coefficient as well.
K_Spec K_Spec+
K_Spat
K_Spec+
K_Stru
K_Spec+
K_Spat+
K_Stru Water bodies 0.93 0.97 0.96 0.97
Buildings 0.66 0.78 0.76 0.78 Fields 0.91 0.90 0.94 0.97
Roads 0.30 0.46 0.37 0.55
Shadows 0.51 0.62 0.66 0.70
Trees 0.39 0.52 0.79 0.80
OA 0.67 0.74 0.80 0.83
Kappa 0.66 0.74 0.79 0.83
4.3 Assessment
From the experiment results as shown in figure 5, we can find out that all composite kernel methods perform better than the original kernel approach which is based on the spectral information of image alone. However, spectral-structure kernel method has a better performance than spectral-spatial kernel method, especially for the fields and trees, i.e. the classification accuracy
of trees, as shown in table 2, is increased from 0.52 to 0.79. For this, we consider two factors: i) the scales of trees and fields always are large, and ii) the grayscale values of them are very changeable, and it is difficult to use average or other statistical values to describe the component information of them. Therefore, the structure information, which is obtained from the LDA model with the form of a mixture of the topics, benefits to classify those complex and mixed geo-object classes.
But, the roads can be better identified using spectral-spatial kernel than spectral-structure kernel. The factor about it is thought that the roads generally are long and narrow. And the range of grayscale values is much smaller. So it is available to describe the internal information using a statistical value alone, such as average, median, and so on. `
Those factors mentioned above make the two composite kernel-based methods have its own benefits. And to overcome the shortcomings, it is necessary to composite all the information to remote sensing image classification. Therefore, the proposed composite kernel method, which is based on spectral, spatial, as well as structure information, can get a best performance in terms of classification accuracy, as shown in table 2.
5. CONCLUSION
In this article, firstly, we analyse the process of how to introduce the LDA model into remote sensing image classification to find out a new approach to model the structure information of the image. And then we propose a new composite kernel-based method which joint uses the spectral, spatial, and structure information for the remote sensing image classification. Finally, we conduct comparison experiments with several different methods. And from the experiment results, we can conclude that: i) the way of modeling structure information based on LDA model is reasonability and the structure information using this method is benefit to image classification, especially for those complex and mixed geo-object classes, i.e. fields and trees. ii) the spectral-structure kernel method can draw a better classification accuracy than spectral-spatial kernel even though it is not much good at identifying small and narrow geo-object, such as roads. iii) the proposed composite kernel-based method which is based on spectral ,spatial, and structure information as well, can get a best performance than other composite kernel-based method With the characteristic of the structure information based on LDA into consideration, we will focus on how to use it into object recognition, especially for debris flow and collapsed building, in the future research.
ACKNOWLEDGEMENTS
This work was supported by the National Natural Science Foundation of China (No.41401374), the National Basic Research Program of China (No. 2012CB719901), and the Program for Changjiang Scholars and Innovative Research Team in University (No.IRT13092).
REFERENCES
Camps-Valls G, Gomez-Chova L, Munoz-Mari J, et al. Composite kernels for hyperspectral image classification. IEEE Geoscience & Remote Sensing Letters, 2006, 3(1):93-97.
Fauvel M, Chanussot J, Benediktsson J A. A spatial–spectral kernel-based approach for the classification of remote-sensing images. Pattern Recognition, 2012, 45(1):381-392.
Heinrich G. Parameter estimation for text analysis. Technical Note Version 2.4, vsonix. Technical Report, 2008.
Lienou M, Maitre H, Datcu M. Semantic Annotation of Satellite Images Using Latent Dirichlet Allocation. IEEE Geoscience & Remote Sensing Letters, 2010, 7(1):28-32.
Manthira Moorthi, S., et al. "Kernel based learning approach for satellite image classification using support vector machine."
IEEE Recent Advances in Intelligent Computational Systems (RAICS), 2011:107-110.
Mercier G, Girard-Ardhuin F. Partially Supervised Oil-Slick Detection by SAR Imagery Using Kernel Expansion. IEEE
Transactions on Geoscience & Remote Sensing, 2006,
44(10):2839-2846.
Shen, L., Tang, H., Chen, Y., et al. A semisupervised latent dirichlet allocation model for object-based classification of VHR panchromatic satellite images. IEEE Geoscience and Satellite Letters, 2014, 11(4):863-837.
Tang, H, Shen, L., Qi, Y., et al. A multiscale latent dirichlet allocation model for object-oriented clustering of VHR panchromatic satellite images. IEEE Transactions on Geoscience and Satellite, 2013, 51(3):1680-1692.
Xu K, Yang W, Liu G, et al. Unsupervised Satellite Image Classification Using Markov Field Topic Model. IEEE Geoscience & Remote Sensing Letters, 2013, 10(1):130-134.