PEDESTRIAN DETECTION BY LASER SCANNING AND DEPTH IMAGERY
A. Barsia,∗, T. Lovasa
, B. Molnara, A. Somogyia, Zs. Igazvolgyib
aBudapest University of Technology and Economics (BME), Dept. of Photogrammetry and Geoinformatics, Hungary – (barsi.arpad, lovas.tamas, molnar.bence, somogyi.arpad)@epito.bme.hu
b
BME, Dept. of Highway and Railway Engineering, Hungary – [email protected]
Commission III, WG III/3
KEY WORDS:profile scanning, depth imagery, 3D modelling, pedestrian detection
ABSTRACT:
Pedestrian flow is much less regulated and controlled compared to vehicle traffic. Estimating flow parameters would support many safety, security or commercial applications. Current paper discusses a method that enables acquiring information on pedestrian move-ments without disturbing and changing their motion. Profile laser scanner and depth camera have been applied to capture the geometry of the moving people as time series. Procedures have been developed to derive complex flow parameters, such as count, volume, walking direction and velocity from laser scanned point clouds. Since no images are captured from the faces of pedestrians, no pri-vacy issues raised. The paper includes accuracy analysis of the estimated parameters based on video footage as reference. Due to the dense point clouds, detailed geometry analysis has been conducted to obtain the height and shoulder width of pedestrians and to detect whether luggage has been carried or not. The derived parameters support safety (e.g. detecting critical pedestrian density in mass events), security (e.g. detecting prohibited baggage in endangered areas) and commercial applications (e.g. counting pedestrians at all entrances/exits of a shopping mall).
1. INTRODUCTION
There is strong demand from transportation planning to track and describe the motion of pedestrians, however, it is still a big chal-lenge. Pedestrians are walking both indoor and outdoor; this indi-cates quite big variety for monitoring methods to be able to detect them.
The literature of traffic monitoring speaks about 10 different meth-ods for pedestrians, from personnel counting to mechanical equip-ment. They mention also remote sensing and video image record-ing, too (Cessford and Muhar, 2003). (Havasi et al., 2007) and (Leibe et al., 2005) presented pedestrian detection from static images, while (Sabzmeydani and Mori, 2007) and (Barsi et al., 2016) worked with videos. (Fuerstenberg and Lages, 2003) and (Gidel et al., 2010) have implemented a system tested in passen-ger car using laser methods. (Lovas and Barsi, 2015) applied pro-file laser scanner, (Benedek, 2014) has used rotating multi-beam laser scanner to detect pedestrians. (Gate and Nashashibi, 2008) have improved the pedestrian classification accuracy by recursive estimation. (Kisfaludi, 2004) used security camera images to de-tect pedestrian passing. (Bauer and Kitazawa, 2010), (Shao et al., 2007) have described the pedestrian motion and applied it in the detection.
Our paper presents the profile laser scanning and the depth im-age capture technologies (Section 2), then the methodology is detailed (Section 3.1 and 3.2) followed by the results (Section 4) and conclusion (Section 5).
2. DATA CAPTURE
The pedestrian detection was planned and investigated in the main building of the Budapest University of Technology and Economics. The aim was to achieve data when there is enough traffic in the
∗Corresponding author
corridors, so the morning hours before lectures were chosen for the measurement. The instruments were fixed on the guardrail in about 4.5 m distance of the floor.
The pedestrian movements were captured by two different laser scanners. The first one was a Sick LMS100 indoor profile scan-ner, which has a measurement range of 20 m, scan angle of 270◦
with 0.5◦angular resolution. The factory given highest scan
fre-quency is 50 Hz, which is equivalent to the time resolution of 20 ms. Two data sets were captured in March 2015. The first was 467 s long, had 4281 records (stored profiles), taken∼52 MB. The average measurement frequency was 9.1 Hz (repetition rate is roughly 109.3 ms). This data set was excellently suitable to develop the required algorithms. The second data set was∼155
MB, contained 12918 records, collected in 406 s. The frequency and repetition rate was 31.7 Hz and 31.5 ms, respectively. Both data sets were converted into Matlab data file, to be integrated in the whole processing chain.
The second device was a flash Lidar sensor, the Kinect depth camera from Microsoft. This device projects an IR pattern onto the object and the reflected signal is captured by an IR camera yielding to a 3D measurement system. Each pixel of the captured image represents a virtual 3D point. Kinect includes an RGB camera as well to extend 3D sensing capability. Depth and RGB images are captured synchronously and both includes 640×480
pixels but have different FOV (depth camera: 58.5×46.6◦, RGB
camera: 62×48.6◦). The capturing frequency is 30 fps (See Fig.
1); it results a very high amount of data so the transmission speed is a limitation (USB 2.0) and real time processing/storing has its own limit. (Molnar et al., 2012) Data capturing was managed by RGBDemo software.
The measurement was performed with different settings. The first was a low resolution scanning of 72 s, logging of 1681 frames in 4.9 GB. The second measurement was 30 s long, taken 4.1 GB for 473 frames. Unfortunately, the scanner had some hardware prob-The International Archives of the Photogrammetry, Remote Sensing and Spatial Information Sciences, Volume XLI-B3, 2016
XXIII ISPRS Congress, 12–19 July 2016, Prague, Czech Republic
This contribution has been peer-reviewed.
lems, which came out only after the data capture: there were a systematic scintillation between the neighboring frames, so only 1030 frames were kept. The scanning frequency was about 29.7 Hz, meaning a repetition rate of 35.1 ms. The original data set has been stored in a folder structure having subfolders for each frame. This storage approach made the processing somewhat complicated (in comparison to the Sick single data file style).
Figure 1. Frequency diagram of the Kinect sensor
3. PEDESTRIAN DETECTION METHOD
3.1 Detection for profile scanning
The raw data obtained by the profile scanning are polar coordi-nates: it measures distance values at given scan angles. The LMS scanner has a field of view starting from -45◦to +225◦in its
lo-cal coordinate system. At a half degree angular resolution there are 541 directions, where the distances have been measured. The very first processing step is therefore the transformation into or-thogonal system considering the initial scanner position and ori-entation. Thexandycoordinates can be taken as temporal vari-ables; by evaluating all profiles, one can derive a time series for both coordinate vectors (Fig. 2). The pedestrians are moving ob-jects: the approaching ones have increasing height, then a jump to the ground level, while the passing pedestrians have quick height jump to their highest values followed by progressive decrease to the ground level (upper part of Fig. 2).
Figure 2. Time series for orthogonal coordinates of the profile scanner: the pedestrians direction (upper diagram) and their pres-ence (lower diagram)
There is a rapid analysis using all profile points: the clearance of the corridor can be visualized (Fig. 3). Such diagrams help to limit the working space or make available to get information about the use of the corridor. The latter corresponds to the pedes-trians habits, where they walk intensively. In this sense such clearance diagrams can be the base for walking heat maps in a given cross section.
Figure 3. Clearance diagram for the corridor. (The scanner is marked by red cross)
After cutting out the most interesting part of the profile, a refer-ence point set was extracted, where no pedestrian presrefer-ence could be noticed. This empty profile as a reference ensures the cal-culation of height differences caused by the appearing pedestri-ans. Defining a height threshold at 1200 mm, we can filter out some noises from the measurement, but are able to segment the dataset for pedestrians. This height limit was set empirically; lower threshold values result too much data fragments (e.g. both legs for a pedestrian), while too high threshold ignores smaller pedestrians.
The thresholding step ends with a binary temporal image. Af-ter some further smoothening steps, a connected-component la-belling technique was performed considering eight-connected pixel neighborhood (N8). This phase enables to label all blobs in the binary image, which are the crossing pedestrians and to count all those blobs. The independently labelled blobs (the pedestri-ans) can have geometric and temporal features, such as maximum height, maximum width, average width, or entry and exit time stamps. The features derived this way can have also standard de-viation values, or can be used for statistical analysis.
3.2 Detection for depth camera
The Kinect processing chain starts also with obtaining the refer-ence. Because the depth camera produces imagery data periodi-cally, no prior coordinate computation is needed. We only con-verted the measurement range from meter level into millimeter level (to homogenize all our measurements). As we noticed for-merly, the Kinect sensor measurements are oscillating (pulsing), we selected 21 empty frames for creating the reference instead of a single one. The reference frames were then averaged and slightly smoothened by median filter.
The main part of the processing phase was the computation of the height differences to the reference frame. Since the measure-ments were also noisy, some further filtering steps were required. Similar to the profile scan processing, a suitable height thresh-old was applied, resulting a binary image. This image can be fine-tuned by median filter and image morphology operators, like The International Archives of the Photogrammetry, Remote Sensing and Spatial Information Sciences, Volume XLI-B3, 2016
XXIII ISPRS Congress, 12–19 July 2016, Prague, Czech Republic
This contribution has been peer-reviewed.
opening.
After this procedure we validated our technology considering the optical images captured simultaneously with the depth images. It turned out that the beginning of the data set has been contami-nated by a periodic error: an alternating frame storage was alized. To eliminate these wrong measurements, we simply re-moved those frames from the registered data set.
The validation was executed, as it can be seen in Fig. 4.
Figure 4. The Kinect depth image validation with the binarizing steps and the visualization of the optical image
4. RESULTS
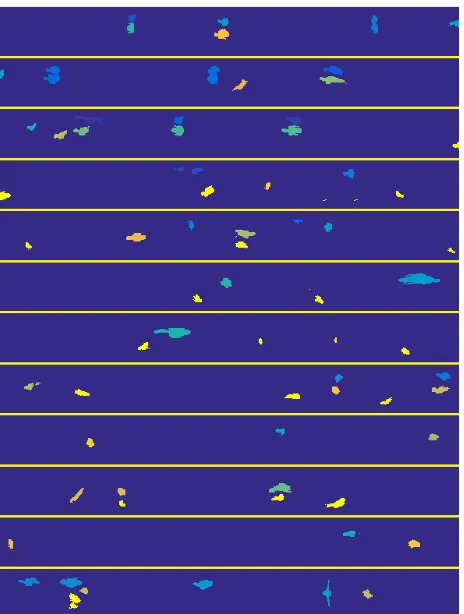
As it was presented in the previous sections, both profile scanning and depth camera measurements have time-dependency. The Sick methodology enables to create a binary image containing blobs having pixels with heights above a threshold value. All blobs can be labelled individually, but the visualization is the base of its interpretation. Figures 5 and 6 show the two data sets after the described segmentation, split into 1000 observation parts.
The samples contain 89 and 232 pedestrians; some of them were fast (e.g. short blobs in the middle of Fig. 5), some were very slow (like blobs in the 6thand 7throw). Neighboring pedestrians are in the same column; it is quite typical for student crowd leav-ing a lecture room (see Fig. 6). The profile scanner has sufficient temporal and geometric resolution, proven by one of the authors walking with outspread arms the last row in Fig. 5.
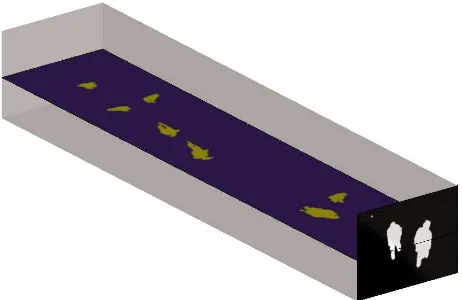
The Kinect procedure is more innovative. Because it collects a depth image, the presented processing derives a two dimensional matrix with height differences from the selected reference. The history of these difference frames can be compiled into a 3D data cube, where two geometric and one temporal coordinates, as ex-tensions are to be managed (Fig. 7).
The data cube can have cross sections parallel to each coordinate planes. The three possible planes are as follows: the first vertical section is the difference frame itself (like the black and white front view in Fig. 7). The horizontal section means a history at a specific row in the difference frame. In Fig. 7 it was drawn at 300, meaning a geometric position in the depth image, where the pedestrians have crossed the line. The section plane contains the pedestrian blobs; we observed 8 pedestrians in 72 s, in the processed 1030 frames. The last section is also vertical: it has
Figure 5. Time series of sparse traffic of the corridor profile scan-ning with all pedestrian blobs
Figure 6. Time series of dense traffic of the corridor profile scan-ning with all pedestrian blobs
a similar meaning, like the horizontal history, but it observes a vertical cross section. In some practical application this can be useful.
5. CONCLUSION
Automatic counting of pedestrians can be achieved by the pre-sented algorithms for profile laser scanner and depth camera. The developed methods have high reliability, which was proven man-ually by evaluating the recorded profiles and video footage. The parameters of the pedestrians (e.g. height, width) and their move-ments (e.g. velocity, trajectories) can be derived simultaneously, then these measures can be evaluated statistically. The aggre-gated information about pedestrian presence is excellent base for maintenance and design purposes. Because pedestrians choose the optimal way and speed, the monitoring is also suitable for studying their walking habits. Surveying and analyzing crowded areas, then the collaboration with engineers, architects and other The International Archives of the Photogrammetry, Remote Sensing and Spatial Information Sciences, Volume XLI-B3, 2016
XXIII ISPRS Congress, 12–19 July 2016, Prague, Czech Republic
This contribution has been peer-reviewed.
Figure 7. 2D+1D data cube for visualizing Kinect height differ-ence history
experts open new perspectives for reaching better infrastructure, security and traffic service level.
REFERENCES
Barsi, A., Lovas, T., Igazvolgyi, Z. and Radoczy, K., 2016. Auto-matic pedestrian trajectory detection to support planning. IGTF 2016 / ASPRS Annual Meeting, Fort Worth, Texas, USA, p. 6.
Bauer, D. and Kitazawa, K., 2010. Using laser scanner data to calibrate certain aspects of microscopic pedestrian motion mod-els. Pedestrian and Evacuation Dynamics 2008 pp. 83–94.
Benedek, C., 2014. 3d people surveillance on range data se-quences of a rotating lidar. Pattern Recognition Letters 50, pp. 149–158.
Cessford, G. and Muhar, A., 2003. Monitoring options for visitor numbers in national parks and natural areas. Journal for Nature Conservation 11(4), pp. 240–250.
Fuerstenberg, K. C. and Lages, U., 2003. Pedestrian detection and classification by laserscanners. In: In Procs. IEEE Intelligent Vehicles Symposium 2002, pp. 31–35.
Gate, G. and Nashashibi, F., 2008. Using targets appearance to improve pedestrian classification with a laser scanner. IEEE In-telligent Vehicles Symposium 2008 pp. 571–576.
Gidel, S., Checchin, P., Blanc, C., Chateau, T. and Trassoudaine, L., 2010. Pedestrian detection and tracking in an urban envi-ronment using a multilayer laser scanner. IEEE Transactions on Intelligent Transportation Systems 11(3), pp. 579–588.
Havasi, L., Szlavik, Z. and Sziranyi, T., 2007. Detection of gait characteristics for scene registration in video surveillance system. IEEE Transactions on Image Processing 16(2), pp. 503–510.
Kisfaludi, B., 2004. Determining forest road traffic by camera surveillance. Erdeszettudomanyi Kozlemenyek 4(1), pp. 135– 145.
Leibe, B., Seemann, E. and Schiele, B., 2005. Pedestrian de-tection in crowded scenes. In: Proceedings of the 2005 IEEE Computer Society Conference on Computer Vision and Pattern Recognition (CVPR’05) - Volume 1 - Volume 01, CVPR ’05, IEEE Computer Society, Washington, DC, USA, pp. 878–885.
Lovas, T. and Barsi, A., 2015. Pedestrian detection by profile laser scanning. IEEE 2015 Models and Technologies for Intelli-gent Transportation Systems (MT-ITS) pp. 408–412.
Molnar, B., Toth, C. and Grejner-Brzezinska, D., 2012. Sphere fitting on ms kinect point cloud. MAPPS/ASPRS 2012 Specialty Conference, Tampa, p. 7.
Sabzmeydani, P. and Mori, G., 2007. Detecting pedestrians by learning shapelet features. Computer Vision and Pattern Recog-nition pp. 1–8.
Shao, X., Zhao, H., Nakamura, K., Katabira, K., Shibasaki, R. and Nakagawa, Y., 2007. Detection and tracking of mul-tiple pedestrians by using laser range scanners. IEEE/RSJ In-ternational Conference on Intelligent Robots and Systems 2007 pp. 2174–2179.
The International Archives of the Photogrammetry, Remote Sensing and Spatial Information Sciences, Volume XLI-B3, 2016 XXIII ISPRS Congress, 12–19 July 2016, Prague, Czech Republic
This contribution has been peer-reviewed.