AUTOMATIC THICKNESS AND VOLUME ESTIMATION OF SPRAYED CONCRETE
ON ANCHORED RETAINING WALLS FROM TERRESTRIAL LIDAR DATA
J. Martínez-Sánchez a, b, I. Puente c,*, H. González Jorge- a, B. Riveiro d, P. Arias a
aDept. of Natural Resources and Environmental Engineering, University of Vigo, Maxwell s/n, 36310, Vigo, Spain -
(joaquin.martinez, higiniog, parias)@uvigo.es
b Ingeniería Insitu, building CITEXVI, Local 23, R/ Fonte das Abelleiras s/n, 36310, Vigo, Spain –
c Defense University Center at the Spanish Naval Academy, University of Vigo, Plaza de España s/n, 36920, Marín, Spain -
d Dept. of Materials Engineering, Applied Mechanics & Construction, University of Vigo, Torrecedeira 86, 36208 Vigo, Spain –
Commission V, WG V/3
KEY WORDS: LiDAR, point cloud, retaining wall, rock bolts, shotcrete, feature extraction, volume calculation
ABSTRACT:
When ground conditions are weak, particularly in free formed tunnel linings or retaining walls, sprayed concrete can be applied on the exposed surfaces immediately after excavation for shotcreting rock outcrops. In these situations, shotcrete is normally applied conjointly with rock bolts and mesh, thereby supporting the loose material that causes many of the small ground falls. On the other hand, contractors want to determine the thickness and volume of sprayed concrete for both technical and economic reasons: to guarantee their structural strength but also, to not deliver excess material that they will not be paid for. In this paper, we first introduce a terrestrial LiDAR-based method for the automatic detection of rock bolts, as typically used in anchored retaining walls. These ground support elements are segmented based on their geometry and they will serve as control points for the co-registration of two successive scans, before and after shotcreting. Then we compare both point clouds to estimate the sprayed concrete thickness and the expending volume on the wall. This novel methodology is demonstrated on repeated scan data from a retaining wall in the city of Vigo (Spain), resulting in a rock bolts detection rate of 91%, that permits to obtain a detailed information of the thickness and calculate a total volume of 3597 litres of concrete. These results have verified the effectiveness of the developed approach by increasing productivity and improving previous empirical proposals for real time thickness estimation.
* Corresponding author
1. INTRODUCTION
Engineers working in the Architecture, Engineering and Construction (AEC) field quite often need to design and build structures that are situated in densely populated urban areas. This involves a high risk, because if an accident happens, the damage can be large. Previously, geologists must evaluate the physical and mechanical properties of the construction site and its surrounding rock mass stability. In excavations of intermediate and great depth, safety will be probably compromised if fractures, discontinuities, disintegration, weathering or loosening exist.
In those situations, rock bolts are used for stabilizing rock excavations and prevent rockfalls (Cai et al., 2015; Srivastava and Singh, 2015). They improve properties of the jointed rocks, frequently combined with wire mesh and sprayed concrete. The latter is a cement-based product that is pneumatically sprayed at a high velocity on the exposed surfaces after excavation to provide ground support.
Spraying concrete is without doubt one of the most demanding activities in construction (EFNARC, 1996). Some researchers (Ginouse and Jolin, 2014, 2015) have been studying the rebound and consolidation mechanisms controlling the shotcrete placement process. Others have been focused on
analyzing a number of factors that influence the adhesion or bond strength of the shotcrete to the underlying substrate material (Kuchta, 2002; Malmgren et al., 2005). However, very few empirical approaches have been proposed to compute the shotcrete layer thickness, and they tend to use parametric or statistical models to study the distribution of sprayed concrete on the wall (Rodríguez et al., 2009).
So in this study, we propose an automatic, non-destructive, LiDAR-based method to accurately estimate the thickness and volume of sprayed concrete on anchored walls from data points acquired by a three-dimensional TLS.
This paper is organized as follows. Section 2 presents the framework of our proposed methodology on rock bolts localization and detection, which also discusses how to estimate the sprayed concrete thickness and volume on the retaining wall. The experimental results and their analysis are provided in Section 3. Finally, Section 4summarizes the main points of our study and looks into the future works.
2. METHODOLOGY
Our approach consists of three parts: location of rock bolts, co-registration of independent data sets before and after shotcreting and reverse thickness and volume estimation. The algorithm overview summarizes the following steps, as shown in Figure 1.
Figure 1. Algorithm overview for thickness and volume estimation of sprayed concrete.
2.1 Rock bolts localization
Artificial intelligence includes the ability of computers to learn how to classify and recognize patterns in data for interpreting formal and abstract problems that are difficult to solve for humans. On the contrary, ordinary tasks like recognizing faces or spoken words are difficult to solve for machines. As an imitation of human brain, artificial neural networks (ANN) were applied to these tasks.
Conventionally, this approach implies combining many simple features using a growing number of hidden layers or deep networks. Autoencoders are a kind of ANN that are trained to obtain at their output an approximate copy of the input. Therefore, an autoencoder consists of an encoder followed by a decoder. If the number of hidden layers in the encoder is lower than the dimension of the input, the encoder learns the salient features of the data (Goodfellow et al., 2016).
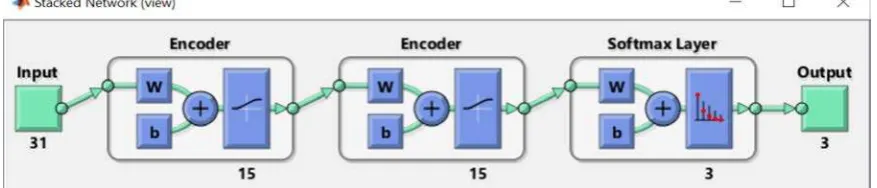
In this work, a deep network that consists of two autoencoders and an output layer was trained to detect rock bolts that are tightened in a slope. Figure 2 shows a diagram of the network. Both encoders contain 15 hidden layers and, while encoder 1 is trained to learn the characteristics of the input data, the second encoder is trained with the features obtained in encoder 1. These second features are used as inputs for the final layer that maps them to the target classes.
The detector is designed to be directly applied to the points obtained from a laser scanner with little or none pre-processing. Therefore, it was assumed that each azimuth line of the scanning is stored successively in the point cloud.
A neighbourhood of a point was used as the input to the network. The spherical coordinates of the points were used as well as their intensity values. The azimuth angle was discarded and the vicinity consists of 21 values for radius coordinate and 5 values for elevation and intensity values X=[r-10 r-9...r0...r9 r10
el-2 el-1 el el+1 el+2 I-2 I-1 I0 I+1 I+2]. This design results in a final dimensionality of 31 coordinates for the input.
For the output of the network, three classes were defined: bolt, bolt neighbourhood and general. The first two labels were assigned respectively to the vertical points on the bolt and the points on the bolt plate and those affected by the shadows caused by the orientation of the bolt with respect to the TLS position. Figure 3 shows an example of a rock bolt after the scanning.
2.2 Registration of data sets
Point cloud registration is a demanding task that is usually divided in two successive procedures: an initial coarse registration followed by a fine registration. This rigid body transformation supports a reference between a source (initial) and a model (posterior) point cloud.
The registration procedure regularly includes a down-sample step which in this work is represented by the rock bolt detection described earlier.
The fixed points obtained, are roughly aligned by means of a geometric transformation including a variant of the Random Sample Consensus (RANSAC). Results of coarse registration may not be identical because of the random behaviour of this step. On the other hand, identification of inliers is an essential feature of coarse registration, especially when, as in our case, the data contains an appreciable number of classification false positives.
Figure 3. Example of rock bolt point cloud
The rigid registration procedure begins with a matching between initial and posterior point clouds using a kd-Tree. These matched point clouds are afterwards inspected for outlier detection and removal. The alignment error is dependent on the number of inliers in the transformation and the distance between them. In our case, this step is crucial, because there are false positives of the classification that must be avoided in calculations. Further iteration of matching and checking passages end when the alignment error is below a tolerance value that stops the algorithm.
2.3 Sprayed concrete thickness and volume estimation
This section describes the procedure followed to compute the thickness and volume of sprayed concrete layers from scanned data. To accomplish this, those layers must initially be co-registered all together in the same reference frame, as mentioned previously in section 2.2.
The proposed procedure was designed as follows and is completed in two steps: (1) thickness calculation based on the signed distances between epochs and (2) volume estimation.
For the thickness calculation the signed distances from the pre-sprayed to the post-pre-sprayed epochs were computed using Cloud Compare (CloudCompare 2.6.2, 2016). In order to obtain the signed distances, the posterior point cloud was transformed to a mesh. The reason to choose the posterior point cloud was the presence of objects on the site and the difficulty to mesh elements like concrete armours.
As a result, the values for the distances should be below zero for a majority of the points in the case study and represent the local thickness of the sprayed concrete. The mean of those values represents the average thickness for this specific layer and the histogram for this result is also provided to check how far the data is spread apart.
The volume estimation method is based on the integration of the signed-distances point cloud. For the volume estimation, we need to first create a rectangular grid superimposed over the layer. A data interpolant for scattered data (x,y,z) was used as well to create a volume similar to that used in Puente et al, 2013. The spatial resolution of the volumetric interpolated values defined by the grid-space was set to 5 cm. We then estimate the volume of concrete as the integration of the negative distances in the interpolated volume.
This methodology was implemented using MATLAB and Cloud Compare. For visualization purposes, RiScan Pro software was used as well.
3. RESULTS AND DISCUSSION
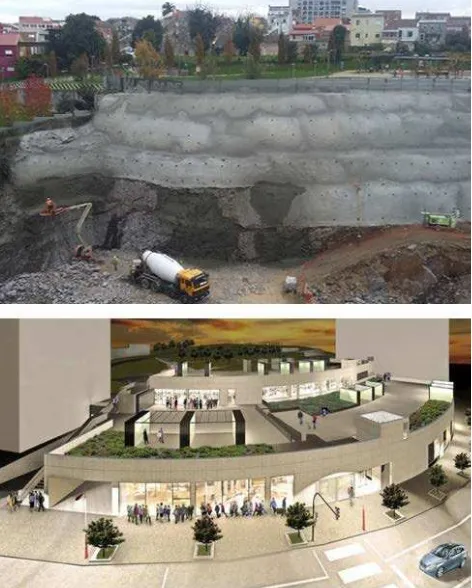
In this section, an example of the possibilities of the methodology stated in section 2 is demonstrated on a real-life case study, an anchored retaining wall in the center of Vigo, Spain, see Figure 4. In order to evaluate the method and estimate the consumption of concrete sprayed on the wall, the acquisition of repeated point clouds were carried out on site during different phases of the construction project.
Figure 4. Overview of the project area. (a) View of shotcrete-pumping truck in operation on wall and excavation works in progress. (b) Impression of the new shopping mall (Source:
www.farodevigo.es)
3.1 Area of study
The rapid transformation of its city economics has become Vigo in the European city with the fastest growing population during the last century, being today the 14th largest city of Spain with a metropolitan area of almost a half million inhabitants. However, this resulted in continuous urban planning changes, making Vigo less structured than other Galician cities (Alvarellos, 2004). During the last five years, the municipality of Vigo has led to a desire for modernization and rehabilitation of the older facilities. Nowadays, it aims at improving the local shopping options of its city center with the upcoming construction of a modern-style shopping mall. The project is expected to be finished by winter of 2016 and involves the design of an anchored wall on the building site, which is still underway. This type of wall, with an actual length and height of 71 and 21 meters respectively, is typically constructed in cut situations in which construction proceeds from the top down to the base of the wall, as shown in Figure 4a.
will complete the building. Figure 4b gives an impression of the shopping mall.
3.2 Acquisition of terrestrial LiDAR data
Authors selected a Riegl LMS-Z390i (Riegl, 2010) for data acquisition. This is a Time-of-Flight (ToF) system with a high range. This fact makes it suitable for precise surveys with no access to the area of interest, which is very useful for surveying hazardous locations like this one.
Processing LiDAR data can be very demanding for computer memory, as there are for example, more than 100 million data points in a detailed view of the whole wall. Therefore, we selected a case considering a smaller subset of the full data set, focusing on a test area of approximately 40 x 5 m. The remaining of the site area collected with LiDAR data was used for data registration but discarded for volume calculation.
Two individual scans of the unshotcreted and shotcreted test area were captured at different epochs, see Figure 4. Proximate scan positions were located in front of the building site at an estimated distance of 70 m from the wall. As a consequence, point clouds will need to be registered in a common coordinate system and rock bolts will serve as control points for the purpose. This allows direct comparison and estimation of sprayed concrete thickness and volume by doing a detailed analysis of the two surfaces (pre- and postshotcreting).
Figure 5 (left) shows an example point cloud which contains a number of rock bolts to be detected. On the right, an individual bolt is modelled as a cylinder. The radius of the cylinder is 20 mm and therefore, in order to detect the bolt, an approximate point spacing of 10 mm was set in the acquisition. These settings resulted in point clouds of 8766144 and 9993814 points for the two epochs respectively.
3.3 Processing of terrestrial LiDAR data
The results of the application of an automatic procedure for rock bolt detection and layer thickness and volume analyses on the available anchored wall data are given here.
3.3.1 Bolt detection: As aforementioned, the deep network
used in this work consists of two autoencoders and a softmax output layer. The input to the system consists of a series of 31-dimensional vectors from the point cloud of the site. The output is a probabilistic 3D vector showing the class that the vector belongs to among the targets: rock bolt, bolt neighbourhood and general.
The first step involves the selection of a number of vectors that will act as the training dataset. For rock bolt class, a number of 119 vectors corresponding to bolts with different orientations to the laser scanner position were selected.
Figure 5. Example point cloud showing a number of rock bolts on site (left). On the right, a detailed geometric approximation
of a cylindrical bolt and corresponding point cloud.
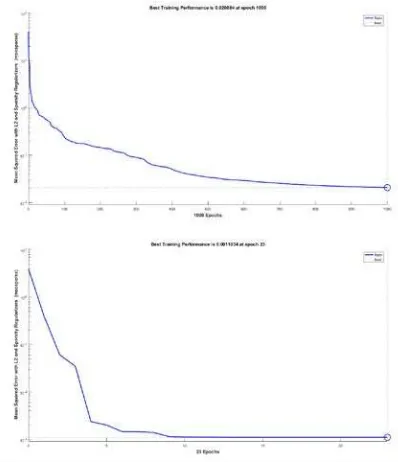
The training dataset contains 67 examples for rock vicinity. These vectors include examples of the plates that tighten the bolt to the concrete and some examples of the shadows in the point cloud that cause the bolts orientation as shown in Figure 3. The remaining vectors up to a total of 744 training examples were selected from the region of interest and the site area. Figure 6 shows the errors in the training of the autoencoders 1 (up) and 2 (down). The first autoencoder obtains the features that describe the hidden relationships in the training data. The second autoencoder is based on the features obtained by the previous one, and consequently, the minimization of training error is faster. Consistently, the training performance is more accurate for the second autoencoder, yielding a comparison of 0.0011 versus 0.0208 mean squared error (MSE).
Figure 6. Training performance in terms of Mean Squared Error for autoencoders 1 (Up) and 2 (Down).
The following steps consist of training the SoftMax layer considering the target class as an output and the features of encoder 2 as input. The performance of this layer is based on the crossentropy and yields a final result of 0.366. Afterwards, both autoencoders and the output layer are stacked in the deep network described by Figure 2.
This deep network is trained taking as inputs the vectors in the training dataset and as outputs the target class for each vector. The final performance indicator for the whole network is 0.242 and the confusion matrix for the trained detector is shown in Figure 7.
Figure 8. Results for rock bolts detection. The false positives are mainly located out of the slope of interest.
The total number of rock bolts is 159 and 14 of them were not detected, which corresponds to a detection rate of 91%. Figure 8 shows a screen capture. Due to the design of the input vector to the network, there occur border issues and, as a consequence, a large number of false positive points. In our case, the presence of false positives is not dramatic as they are considered as outliers in the registration step.
3.3.2 Point cloud registration and volume estimation:
Point cloud registration was achieved by two successive procedures: an initial coarse registration followed by a fine registration. The rough alignment was obtained by a transformation and RANSAC. The RMSE error for this registration was of 0.434 m. The registration procedure finished with a rigid body transformation based on ICP and showed an error of 0.052 m. A detail of the point clouds resulting of this two-step alignment are shown in Figure 9.
For the volume of concrete estimation and thickness calculation, the signed distances from the initial to the successive point cloud were obtained using Cloud Compare. In this case, the latter point cloud was used as a reference.
Figure 9. Point cloud registration based on rock bolt locations. Points registered after the initial geometric procedures (grey)
are transformed by ICP (purple) and registered to previous points (teal).
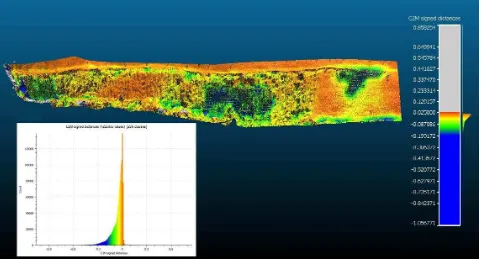
Figure 10 shows the results for thickness estimation in form of point cloud. The histogram of the distances was overlaid in the picture for readability. As expected, most of the points are consistently negative. The integration of the negative distances in this point cloud of signed differences with a grid space of 5 cm permits to obtain an estimation for the volume of sprayed concrete. This volume was of 3597 litres.
4. CONCLUSIONS AND FUTURE TRENDS
An automatic LiDAR-based method has been proposed for estimating the thickness and volume of sprayed concrete on an anchored retaining wall. The high density, high accuracy 3-D point cloud models obtained from a terrestrial laser scanner during the active construction phases were used to retrieve rockmass information remotely and complete volume calculations.
In particular, the algorithm first detects and segments rock bolts using a deep network diagram based on autoencoder. Furthermore, it uses these bolts to corregister the point clouds of different epochs. The alignment of successive scans provides valuable rockmass information, letting the user to conduct punctual thickness measurements, but also to measure the volume of shotcreted layers, avoiding the overestimation of costs by contractors.
A future trend from this work is related to the improvements that can be made in order to increase the productivity of the segmentation process. A parallelization of the method, making use of additional instances of the detector, would decrease the processing time. Compilation to a native application using C/C++ or a similar language would also benefit the computation time.
Moreover, the bolt detector could be suitable for mobile laser scanner (MLS) data processing by changing the azimuth angle for linear displacement, i.e., changing from spherical coordinates in TLS to cylindrical coordinates in MLS. Particular considerations should be made for speed and resolution requirements.
ACKNOWLEDGEMENTS
The financial support of the Spanish Ministry of Economy and Competitiveness through the projects ‘‘HERMES-S3D: Healthy and Efficient Routes in Massive Open-Data based Smart Cities (Ref.: TIN2013-46801-C4-4-R) and ‘‘ENERBIUS: Integral System for energy optimization and reduction of the CO2 footprint in buildings: BIM technology, indoor mapping, UAV and tools for energetic simulation (ENE2013-48015-C3-1-R) and the Torres Quevedo Program for the grant (PTQ-13-06381), is grateful acknowledged.
REFERENCES
Abellán, A., Oppikofer, T., Jaboyedoff, M., Rosser, N. J., Lim, M., Lato, M. J., 2014. Terrestrial laser scanning of rock slope instabilities. Earth Surface Processes and Landforms, 39(1), pp. 80-97.
Alvarellos, H., 2004. Galicia en cen prodixios. Xerais, Vigo, pp.219.
Cai, Y., Jiang, Y., Djamaluddin, I., Iura, T., Esaki, T., 2015. An analytical model considering interaction behavior of grouted rock bolts for convergence–confinement method in tunneling design. International Journal of Rock Mechanics and Mining
Sciences, 76, pp.112-126.
CloudCompare (version 2.6.2) [GPL software]. (2016). Retrieved from http://www.cloudcompare.org/
EFNARC, 1996. European Specification for Sprayed Concrete, European Federation of National Association of Specialist Repair Contractors and Material Suppliers for the Construction Industry, Aldershot, UK, 1996.
Fekete, S., Diederichs, M., Lato, M., 2010. Geotechnical and operational applications for 3-dimensional laser scanning in drill and blast tunnels. Tunnelling and Underground Space
Technology, 25(5), pp. 614-628.
Ginouse, N., Jolin, M., Bissonnette, B., 2014. Effect of equipment on spray velocity distribution in shotcrete applications. Construction and Building Materials, 70, pp. 362-369.
Ginouse, N. and Jolin, M., 2015. Investigation of spray pattern in shotcrete applications. Construction and Building Materials, 93, pp. 966-972.
Goodfellow, I., Bengio, Y. and Courville, A., 2016. Deep Learning. Book in preparation for MIT Press. http://www.deeplearningbook.org. Visited: 24/03/2016
Kuchta, M.E., 2002. Quantifying the Increase in Adhesion Strength of Shotcrete Applied to Surfaces Treated with High-pressure Water. SME Preprint 02-35, SME Annual Meeting, Phoenix, AZ.
Malmgren, L., Nordlund, E. and Rolund, S., 2005. Adhesion Strength and Shrinkage of Shotcrete. Tunnelling and
Underground Space Technology, 20, pp.33-48.
Monserrat, O. and Crosetto, M., 2008. Deformation measurement using terrestrial laser scanning data and least squares 3D surface matching. ISPRS Journal of
Photogrammetry and Remote Sensing, 63(1), pp.142-154.
Puente, I., González-Jorge, H., Riveiro, B, Arias, P., 2012. Deformation monitoring of motorway underpasses using laser scanning data. In: The International Archives of the
Photogrammetry, Remote Sensing and Spatial Information Sciences, Melbourne, Australia, Vol.XXXIX-B5, pp. 235-238.
Puente, I., Solla, M., González-Jorge, H., Arias, P., 2013. Validation of mobile LiDAR surveying for measuring pavement layer thicknesses and volumes. NDT & E International, 60, pp. 70-76.
Puente, I., Lindenbergh, R., González-Jorge, H., Arias, P., 2014. Terrestrial laser scanning for geometry extraction and change monitoring of rubble mound breakwaters. In: The
International Annals of the Photogrammetry, Remote Sensing and Spatial Information Sciences, Riva del Garda, Italy, Vol.
II-5, pp. 289-295.
Riegl, 2009. Z390i Laser Scanner Data Sheet (Revised version 20/04/2010)
Rodríguez, Á., Nabulsi, S., Río, O., 2009. A method for estimating thickness of sprayed concrete layers from pumped volume. In: Proceedings of the Second International
Conference on Computational Methods in Tunnelling (EURO: TUN 2009), Bochun, Germany, pp.875–882.