PROBLEMS AND LIMITATIONS OF SATELLITE IMAGE ORIENTATION FOR
DETERMINATION OF HEIGHT MODELS
K. Jacobsen
Institute of Photogrammetry and GeoInformation, Leibniz University Hannover, Germany [email protected]
HRIGI – High-Resolution Earth Imaging for Geospatial Information, ISPRS WG I/4
KEY WORDS: ZY3, WorldView-2, Pleiades, Cartosat-1, systematic errors
ABSTRACT:
The usual satellite image orientation is based on bias corrected rational polynomial coefficients (RPC). The RPC are describing the direct sensor orientation of the satellite images. The locations of the projection centres today are without problems, but an accuracy limit is caused by the attitudes. Very high resolution satellites today are very agile, able to change the pointed area over 200km within 10 to 11 seconds. The corresponding fast attitude acceleration of the satellite may cause a jitter which cannot be expressed by the third order RPC, even if it is recorded by the gyros. Only a correction of the image geometry may help, but usually this will not be done. The first indication of jitter problems is shown by systematic errors of the y-parallaxes (py) for the intersection of corresponding points during the computation of ground coordinates. These y-parallaxes have a limited influence to the ground coordinates, but similar problems can be expected for the x-parallaxes, determining directly the object height. Systematic y-parallaxes are shown for Ziyuan-3 (ZY3), WorldView-2 (WV2), Pleiades, Cartosat-1, IKONOS and GeoEye. Some of them have clear jitter effects. In addition linear trends of py can be seen. Linear trends in py and tilts in of computed height models may be caused by limited accuracy of the attitude registration, but also by bias correction with affinity transformation. The bias correction is based on ground control points (GCPs). The accuracy of the GCPs usually does not cause some limitations but the identification of the GCPs in the images may be difficult. With 2-dimensional bias corrected RPC-orientation by affinity transformation tilts of the generated height models may be caused, but due to large affine image deformations some satellites, as Cartosat-1, have to be handled with bias correction by affinity transformation. Instead of a 2-dimensional RPC-orientation also a 3-dimensional orientation is possible, respecting the object height more as by 2-dimensional orientation. The 3-dimensional orientation showed advantages for orientation based on a limited number of GCPs, but in case of poor GCP distribution it may cause also negative effects. For some of the used satellites the bias correction by affinity transformation showed advantages, but for some other the bias correction by shift was leading to a better levelling of the generated height models, even if the root mean square (RMS) differences at the GCPs were larger as for bias correction by affinity transformation.
The generated height models can be analyzed and corrected with reference height models. For the used data sets accurate reference height models are available, but an analysis and correction with the free of charge available SRTM digital surface model (DSM) or ALOS World 3D (AW3D30) is also possible and leads to similar results. The comparison of the generated height models with the reference DSM shows some height undulations, but the major accuracy influence is caused by tilts of the height models. Some height model undulations reach up to 50% of the ground sampling distance (GSD), this is not negligible but it cannot be seen not so much at the standard deviations of the height. In any case an improvement of the generated height models is possible with reference height models. If such corrections are applied it compensates possible negative effects of the type of bias correction or 2-dimensional orientations against 3-dimensional handling.
1. INTRODUCTION
Not all optical satellite images have a satisfying calibration, attitude accuracy and time interval for recording attitude information (Jiang et al. 2015) (Zhang et al. 2015) (Radhadevi et al. 2016). The common method of optical satellite image orientation is based on the bias corrected rational polynomial coefficients (RPC), individually for the single images of a stereo pair. The bias correction is based on ground control points (GCPs), usually measured in single images. The major problem of GCPs is the identification within the images, not so much the accuracy of the ground coordinates. This may lead to discrepancies of the location of corresponding points in a stereo model and finally to tilts of the height models determined by intersection. The bias correction usually is made by two-dimensional affinity transformation in image or object space. Of course it is possible to check the significance of the affine parameters and to eliminate not significant values, but this is
still influenced by the GCPs. For images taken by some satellites it is satisfying to use only a shift instead of an affinity transformation as bias correction. This may be the case e.g. by images from IKONOS, GeoEye and Pleiades, but for example for Cartosat-1 images an affinity transformation is absolutely required. The affine parameters may lead to a tilt of the stereo models, but this may be caused also the direct sensor orientation, available as RPC. In the case of a stereo pair it is possible to use also a stereo orientation based on the RPC. This may improve the tilts of the generated height models. Of course an orientation of a block configuration (d’Angelo et al. 2013) is optimal, but a common user of satellite images does not have such image combinations.
The limited accuracy of the direct sensor orientation may lead to an undulation of the height model. With reference height models such undulations and height model tilts may be determined and corrected. This correction has to be filtered to avoid or at least reduce the influence of a change of the The International Archives of the Photogrammetry, Remote Sensing and Spatial Information Sciences, Volume XLII-1/W1, 2017
vegetation between data acquisition of the reference and the evaluated height models. The first information of limited accuracy of the generated height models can be achieved by the analysis of y-parallaxes of the intersections for height model generation. Here some satellites show high frequent discrepancies caused by satellite jitter, but also a dependency of systematic y-parallax errors as linear function of the X- and the Y-coordinate. Y-parallaxes have a limited influence to the object coordinates, but a similar influence has to be expected to the x-parallaxes, influencing directly the object height. High frequency height errors cannot be determined by a comparison with reference height models due to the requirement of a filtering for local height changes; this is only possible for undulations with a lower frequency. The analysed problems of the height models are shown with examples from the Chinese stereo satellite Ziyuan-3, WorldView-2, Pleiades and the Indian stereo satellite Cartosat-1. More satellite types have been analyzed, but the selected four describe the range of the height model deformation type. All analyzed height models have been shifted by least squares adjustment to the reference height models. This was required due to some problems of the reference height models with the geodetic datum. Of course such problems can be eliminated by bias corrected RPC-orientation in relation to the GCPs, but the reference height models may have also datum problems against the GCPs.
2. ANALYSIS OF Y-PARALLAXES
The shown systematic y-parallaxes are the average of approximately 200 equal distance groups of the ground coordinates in X- and Y-direction from intersections for the generation of height models. The handled data sets have between 7 million and 36 million points, in the average corresponding to 35000 up to 180000 points per group, eliminating random effects.
Figure 1. Systematic y-parallaxes of WorldView-2 (0.5m GSD) height model 2 based on RPC-orientation with bias correction by affine transformation and by shift [m]
The systematic y-parallaxes of the WorldView-2 (0.5m GSD) model 3 in Karaburun (Fig. 1) show in the Y-direction a strong jitter effect of approximately +/- 10cm in object space. In the X-direction the systematic y-parallaxes based on a bias correction by affinity transformation have a tilt of approximately 60cm over the whole range while this is just 10cm for the bias correction by shift. This jitter effect is not very large in relation to the WorldView-2 GSD, but it may reduce the image quality.
Bias correction affinity Bias correction shift Figure 2. Systematic y-parallaxes of WorldView-2 height models 2 and 4 based on different bias correction [m]
Figure 3. Systematic y-parallaxes WorldView-2, model 3 [m]
The WorldView-2 models 2 and 4 of the area Karaburun, imaged from the same orbit, within 1.5 minutes, show the same jitter effect in X-direction (Fig. 2). Based on bias correction by affinity transformation model 2 has a tilt in X-direction of 1.6m over the whole range, while with bias correction by shift no tilt exists. In model 4, based on bias correction by shift (Fig. 2, right) there is a tilt of 20cm, respectively 10cm while the tilt reaches 50cm, respectively 30cm, in case of bias correction by affinity transformation.
The y-parallaxes averaged in 200 x 200 sub-areas of the scene (Fig. 3) show the periodic systematic effects as striping. Only the sub-areas with at least 60 points are shown to eliminate random effects. Gaps in figure 3 are caused by water surfaces and in forest areas where the matching is difficult. Corresponding striping is available also in model 2 and 4.
Figure 4. Systematic y-parallaxes of Ziyuan-3 (3.4m GSD) for bias correction by shift
Figure 5. Systematic y-parallaxes of Ziyuan-3 (3.4m GSD) for bias correction by affinity transformation
Ziyuan-3 shows in the ISPRS-test area Sainte-Maxime, France, also some periodical effects in the Y-direction with a lower frequency as WorldView-2 (Fig. 4 and 5). The bias correction by affinity transformation causes a tilt of 3m in Y-direction, while the tilt is just approximately 0.5m for the bias correction by tilt. Ziyuan-3 shows in the X-direction two local errors of approximately 70cm. The size has to be seen in relation to the GSD of 3.4m and the base to height relation of 1:1.15.
Figure 6. Systematic y-parallaxes of Pleiades-1A, Zonguldak
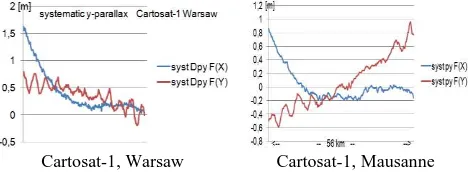
The systematic y-parallaxes of the Pleiades-1A model in Zonguldak are very small (Fig. 6). With 4cm, respectively 6cm they are negligible in relation to 50cm GSD of Pleiades. The orientation of Cartosat-1 (2.5m GSD) in the test areas Warsaw and Mausanne had to be made with bias correction by affinity transformation. In the Warsaw test area the root mean square differences at 33 GCPs are reaching 16.86m, respectively 12.54m in case of bias correction by shift, while this goes down to 1.41m, respectively 1.35m, in case of bias correction by affinity transformation. Some high frequent systematic y-parallaxes can be seen in the y-direction, while in the X-direction a curvature from 1.6m down to 0m can be seen. In the test area Mausanne nearly the same effects exist (Fig. 7), only the tilt is different
Cartosat-1, Warsaw Cartosat-1, Mausanne Figure 7. Systematic y-parallaxes of Cartosat-1
Systematic y-parallaxes in the range up to +/- 0.2 pixels have been seen also in IKONOS and GeoEye stereo models, but not with high frequency components
3. HEIGHT MODELS FROM ZIYUAN-3
As mentioned, the Ziyuan-3 triple stereo camera system has a limited accuracy of calibration and the attitude information is limited in accuracy and time interval (Jiang et al. 2015) (Zhang et al. 2015). Nevertheless after correction based on reference height models the final result is very good. Only the forward and backward views of Ziyuan-3 have been used for the height model generation.
camera Bias corr. SX SY significant
backward Shift 3.17 3.07 2
Affine 1.91 2.51 5
forward Shift 2.66 3.42 2
affine 1.89 1.81 5
Table 1. Accuracy of bias corrected RPC-orientation at 12 GCPs and number of significant affinity parameters
5 of 6 affine parameters of the two-dimensional bias correction are significant. By bias correction with affinity transformation the standard deviations of the GCPs are reduced against bias correction by shift to 66% (Table 1).
Bias correction by shift and by affinity transformation Figure 8. Discrepancies at GCPs by Ziyuan-3 based on intersection with orientation from 2D-orientation
Bias correction SX SY SZ
Shift 1.94 1.83 3.70
affine 1.93 1.84 3.70
Table 2: Accuracy of Ziyuan-3 3-D-orientation at 12 GCPs
The result based on a three-dimensional orientation does not depend upon the type of bias correction (Table 2).
Whole area Slope < 10% tilt
SZ NMAD SZ NMAD X Y
2D shift 3.89 2.88 2.72 2.36 -2.29 -3.42 2D affine 4.65 4.20 3.56 3.58 1.10 -11.63 3D shift 3.90 2.95 2.73 2.43 -1.57 -4.09 3D affine 4.26 3.60 3.19 3.13 2.45 -7.71 3D shift,
leveled
3.85 2.79 2.67 1.90
3D affine, leveled
3.84 2.78 2.74 1.88
Table 3. Comparison of Ziyuan-3 DSM with reference DSM from aerial images, depending upon type of orientation; for non-forest areas
Table 3 shows the result of comparisons of generated Ziyuan-3 height models in non-forest areas with a reference height model from French IGN based on aerial images. Both height models The International Archives of the Photogrammetry, Remote Sensing and Spatial Information Sciences, Volume XLII-1/W1, 2017
are DSM, but the definition of the forest canopy height is quite different for images with 3.4m GSD and 0.2m GSD. The accuracy in the forest areas clearly is not as good as shown in table 3 for non-forest areas. As usual for flat terrain, here shown for locations with a slope below 10%, the accuracy is better as for stronger inclined areas. Also as usual the normalized median deviation (NMAD) is smaller as the standard deviation of the height (SZ) due to a higher percentage of larger discrepancies as corresponding to the normal deviation. The normal distribution based on NMAD has a misfit to the frequency distribution of the height discrepancies between 6.8% and 10.2% while it is for SZ between 8.9% and 13.4%.
The Ziyuan-3 height models have a quite stronger model tilt (Table 3) over the model size of 62km times 57km in case of orientation based on bias correction by affinity transformation as for orientation corrected by shift. The three-dimensional orientation reduces the model tilt in case of bias correction by affinity transformation; nevertheless it is still not negligible. The model tilt is not in line or sample direction (Fig. 9). Of course the best results are achieved after levelling of the height models. Here the relation between RPC orientation with bias correction by shift or affine transformation is reversed – the best results are achieved by bias correction by affinity transformation, but the advantage is limited. The results based on 2D-orientation are not shown; they are more or less identical to the results based on 3D-orientation. That means the three-dimensional orientation has mainly advantages of a better levelling of the DSM. NMAD is more improvement by levelling the DSM as SZ due to a slightly higher percentage of larger height discrepancies as corresponding to normal distribution.
Figure 9. Tilt of DSM based on 2D orientations with bias correction by affinity transformation
Colour coded height differences of whole area
Colour coded height differences after levelling Figure 10. Ziyuan-3 DSM based on bias correction by affinity transformation
The model tilt is also obvious by the colour coded height differences (Fig. 10 left). Based on the height differences against the reference height model a levelling is possible (Fig. 10 right).
As shown before (Jacobsen 2016), there is not only a model tilt; also an undulation in X-direction with amplitude of +/-1m exists. This should not be neglected, but a correction of the
DSM by the undulation has a limited influence to the accuracy numbers of only 1cm up to 2cm.
Figure 11. Smoothened systematic height differences of Ziyuan-3 DSM against IGN reference, SRTM DSM and AWZiyuan-3DZiyuan-30 as function of X
The improvement of the Ziyuan-3 DSM by the reference DSM leads to similar results as the improvement based on the SRTM DSM or AW3D30. ASTER GDEM should not be used due to limited levelling accuracy and some vertical shifts. As shown in figure 11, the undulation can be determined with similar results, only a small tilt and systematic height difference exists for SRTM DSM and AW3D30.
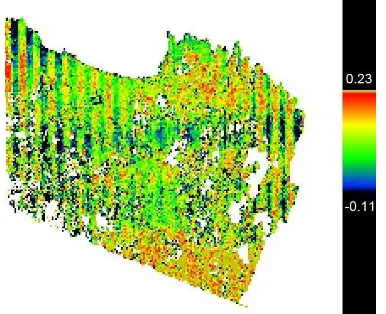
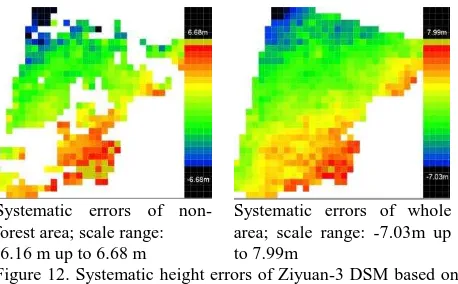
For the accuracy analysis the forest area has been masked out due to larger discrepancies in the forest area, but this is not required for the improvement of the Ziyuan-3 DSM (Fig. 12); the height discrepancies in the forest area seems to be mainly random without important systematic effect.
Systematic errors of non-forest area; scale range: -6.16 m up to 6.68 m
Systematic errors of whole area; scale range: -7.03m up to 7.99m
Figure 12. Systematic height errors of Ziyuan-3 DSM based on bias correction by affinity transformation
4. HEIGHT MODELS FROM PLEIADES-1A
In the test area Zonguldak, Turkey, a Pleiades height model has been analyzed. Due to 0.5m GSD a better accuracy as for Ziyuan-3 with 3.4m GSD is expected. From the triple stereo configuration of Pleiades only the first and last image has been used, having a base to height relation of just 1:4.5 corresponding to an angle of convergence of 12.5°.
Beside the small y-parallaxes (Fig. 6), information about stable inner orientation is given by the RPC-orientation (Table 3).
Bias correction SX SY significant
284 shift 0.43 m 0.52 m 2
284 affine 0.43 m 0.48 m 3
283 shift 0.44 m 0.50 m 2
283 affine 0.44 m 0.48 m 3
Table 3. Accuracy of bias corrected RPC-orientation at 168 GCPs and number of significant affinity parameters
Figure 13. Vertical discrepancies at GCPs – 3D orientation of Pleiades with bias correction by shift; upper left = Black Sea
SX SY SZ
Shift 0.42 m 0.52 m 1.11 m
affine 0.42 m 0.49 m 1.09 m
Table 4. Accuracy of 3_D-orientation at 168 GCPs
The differences at GCPs (Fig. 13) based on orientation with bias correction by affinity transformation and by shift are limited. Beside the shift parameters only one more of the 6 affine parameters is significant. The vertical accuracy of the three-dimensional orientation (Table 4) corresponds to 0.5 GSD for the x-parallax. In case of Ziyuan-3 this is 1.09 GSD. The next indication of good image geometry is the systematic y-parallaxes (Fig. 6). This is nearly the same for both types of bias correction. They are reaching only 0.06m, respectively 0.04m – approximately 0.1 GSD instead of 1.0 GSD for Ziyuan-3.
Bias transformation – independent upon 2D- or 3D-orientation. 168 GCPs have been used, being quite more as usually. Due to this situation the tilt of the height models based on bias correction by affinity transformation are slightly smaller as in case of bias correction by shift. The tilt is limited in size and has only a negligible influence to the accuracy numbers.
Bias correction by shift By affinity transformation Figure 14. Systematic height errors of Pleiades DSM
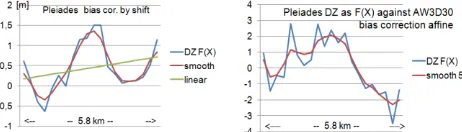
Figure 15. Systematic errors of DZ as function on X against aerial reference (left) and against AW3D30 (right)
Figures 14 and 15 show also for the Pleiades DSM some systematic effects even if this was not expected due to the negligible effects of the y-parallaxes (Fig. 6). Satisfying similar systematic height errors have been achieved by comparison of the Pleiades DSM with the reference points as well as with AW3D30, confirming the result (Fig. 15). Corresponding systematic errors are available as function of Y. Such deformations in the size of up to 70% of the accuracy cannot be neglected and have to be improved. This correction is possible also by means of AW3D30 or SRTM DSM. The correction eliminates the systematic effects, but the accuracy numbers (Table 5) are changed not more as 1cm up to 2cm.
5. HEIGHT MODELS FROM WORLDVIEW-2
Three WorldView-2 height models in the project area Karaburun, Turkey, have been analyzed. They are located directly beside each other and imaged from the same orbit. Ground control points from aerial photo flights have been used. These GCPs were difficult to be identified in the WorldView-2 images, explaining the larger discrepancies at the GCPs of model 2 and 3, exceeding the GSD of 0.5m.
Model number and bias Table 6. Discrepancies of WorldView-2 orientation at 13 to 15 GCPs
Bias correction SX SY SZ
Shift 1.79 m 1.10 m 0.50 m
affine 1.94 m 1.64 m 0.56 m
Table 7: Accuracy of 3-D-orientation of model 2 at 13 GCPs
Based on the same GCPs in the X-direction the standard deviations of the orientation by bias correction with affinity transformation are just 69% of the orientation by shift, while this is 88% for the Y-component. This cannot be explained by the jitter effect in the X-direction (Figures 1 and 2).
Whole area Slope < 10% tilt
SZ NMAD SZ NMAD X Y
2D shift 1.69 1.13 1.27 0.75 0.28 -0.11 2D affine 1.52 1.03 1.29 0.99 -0.30 -1.11 Table 8. Comparison of WorldView-2 model 2 DSM with LiDAR DSM in non-forest area and without quarries
The three-dimensional orientation has been made only for model 2 where a reference LiDAR-DSM exists. The identification problems of the GCPs influence also the horizontal accuracy of the three-dimensional orientation, The International Archives of the Photogrammetry, Remote Sensing and Spatial Information Sciences, Volume XLII-1/W1, 2017
nevertheless the vertical accuracy with 0.50m respectively 0.56m (Table 7) is within the system accuracy determined by the GSD multiplied with height to base. For the available base to height relation of 1:1.43 one GSD in the x-parallax corresponds to 0.5m 1.43 = 0.71m for the object height.
Figure 16. Systematic height errors of WorldView-2 DSM model 2 against LiDAR DSM; only for non-forest area without quarries
The definition of the forest canopy by a LiDAR DSM is not the same as for images with 50cm GSD, causing larger random errors. So the forest has been eliminated from the comparison. The same is with the quarries which changed very fast due to strong building activities.
As for the other height models some tilts and systematic deformations of the WorldView-2 height model exist (Fig. 16 – 18). The tilt with an influence in X-direction of 0.26m and the undulations in X-direction of up to 0.25m and in Y-direction of up to 0.50m are not negligible, they are in the range relative to the GSD as shown before for the other sensors.
Figure 17. Systematic discrepancies of WorldView-2 DSM model 2 based on bias correction by shift against LiDAR DSM; only for non-forest area without quarries, as function of X
Figure 18. Systematic discrepancies of WorldView-2 DSM model 2 based on bias correction by shift against LiDAR DSM; only for non-forest area without quarries, as function of Y
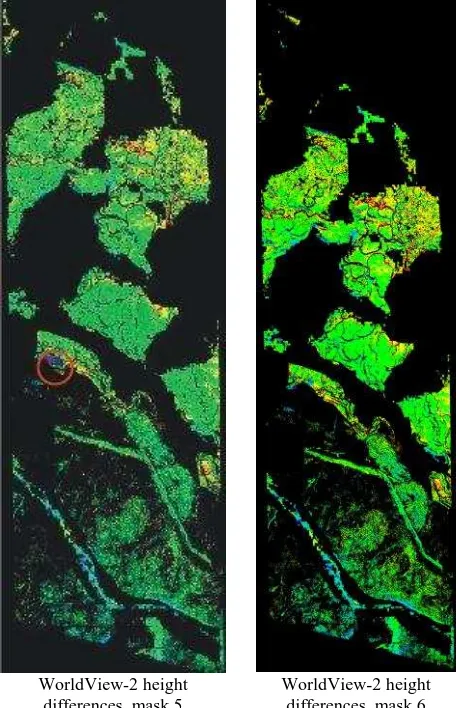
Figure 19. Systematic discrepancies of WorldView-2 DSM, bias corrected by affine transformation, computed for 180 discrepancies in non-forest areas, mask open5
Figure 20. Systematic discrepancies of WorldView-2 DSM, bias corrected by affine transformation, computed for 180 discrepancies in non-forest areas, mask open6
WorldView-2 height differences, mask 5
WorldView-2 height differences, mask 6 Figure 21. Color coded height differences for non-forest area with different forest masks – different area encircled
The justification of the determination of systematic discrepancies as function of X and Y for just 30 groups and the smoothing filter is demonstrated by figures 19 and 20, showing the systematic discrepancies computed for 180 groups. Of course this supports the information about satellite jitter (Fig. The International Archives of the Photogrammetry, Remote Sensing and Spatial Information Sciences, Volume XLII-1/W1, 2017
1), but it is strongly depending upon objects which should be eliminated from the investigation. The center part figure 19 has a peak down and up for the systematic height errors as function of Y which is not shown in figure 20. The reason for this can be seen in figure 21; it shows on the left hand side a small violet and a red area. The violet part is a dump and the red part belongs to a quarry, both changed between WorldView-2 imaging and LiDAR data acquisition. These small parts have not been respected in the mask 5, but in the mask 6 for specification of the investigation area. The smoothened function (red lines in figures 19 and 20) are not so much influenced by the object changes and especially if only 30 groups are used, it is not any more important and the systematic information can be used for improvement of the height model.
As for the height models of the sensors mentioned before, the model tilt and the undulations are not negligible in relation to 0.5m GSD of WorldView-2 and the base to height relation of 1:1.43. Nevertheless also a correction by the free available worldwide height models is possible. An improvement with AW3D30 eliminated the problems, but the accuracy numbers are only improved by 1cm up to 2cm.
6. HEIGHT MODELS FROM CARTOSAT-1
image Bias: shift Bias: affine
SX SY SX SY
Forward 16.86 m 1.64 m 1.41 m 1.49 m after 12.54 m 2.83 m 1.35 m 1.27 m Table 8. Discrepancies of Cartosat-1 orientation at 33 GCPs
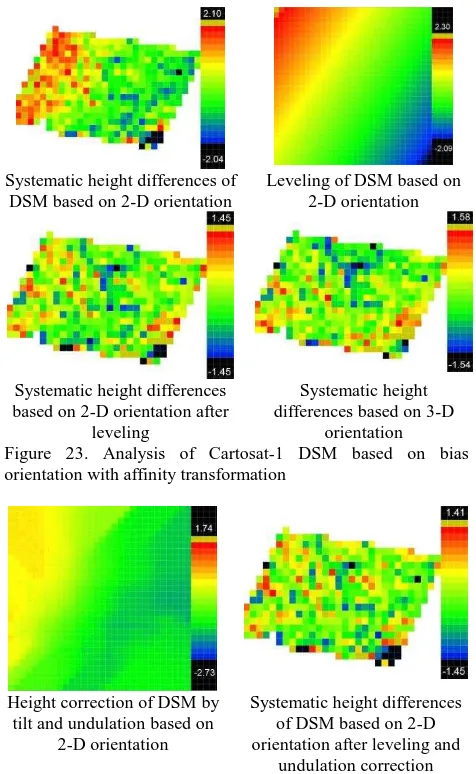
The identification of the GCPs for the Cartosat-1 test area Warsaw is without problem and the 33 points are well distributed (Fig. 22). The RPC-orientation with bias correction by affinity transformation with accuracy of approximately 0.55 GSD is satisfying. On the other hand the large discrepancies in X of the orientation with bias correction by shift are so large that no further use of this method of orientation has been made for Cartosat-1. The strong affine image deformation in X-direction can be seen in figure 22.
Figure 22. Discrepancies at GCPs – forward camera, RPC orientation with bias correction by shift
Bias correction SX SY SZ
Shift 14.30 m 2.79 m 1.91 m
affine 1.38 m 1.64 m 0.56 m
Table 9: Accuracy of Cartosat-1 3-D-orientation at 32 GCPs
The three-dimensional orientation confirms the problems with affinity deformation of the Cartosat-1 scenes. Only the result Table 9. Comparison of Cartosat-1 DSM with reference DSM in non-forest area [m]
The accuracy of the Cartosat-1 height models (Table 9) have to be seen in relation to 2.5m GSD and the base to height relation of 1:1.6.The achieved results are in the range of expectation; as usual tilts and undulations of the DSM can be seen. The tilts are smaller in case of three-dimensional orientation but with 0.5 GSD not negligible.
The systematic height undulations with +/-30cm for the X-direction and +/-20cm for the Y-X-direction are small for a height model based on 2.5m GSD images. Nevertheless they can be corrected together with the not negligible tilt (Fig. 24 left). This is reducing the standard deviation to SZ=3.16m and NMAD to 2.48m being a limited improvement against only leveling the
7. CONCLUSION
In all analyzed height models from optical satellite images tilts and undulations exist. In most cases the accuracy figures are not too much influenced by such deformations, nevertheless the systematic height errors cannot be tolerated.
The type of bias corrected RPC-orientation does not have an influence to the final accuracy of the height model if reference height models are used for a correction. Only for Cartosat-1 a bias correction by affinity transformation is required. By three-dimensional RPC-orientation the height models based on it are not so much tilted as by two-dimensional orientation, nevertheless height model tilts have to be expected also in case of a 3D-orientation. The bias-correction by affinity transformation reduces the discrepancies at the GCPs, but if not a high number of GCPs is available, it causes height model tilts. An indication of systematic image errors comes by the analysis of the y-parallaxes for an intersection of height models. Here also high and median frequency height errors, caused by satellite jitter, have been identified, nevertheless based on reference height models corresponding problems in X-direction, influencing the object height, cannot be eliminated due to required filtering of height model discrepancies for influences of vegetation height changes.
Height model tilts and undulations can be determined and corrected by reference height model as they are free of charge available with the SRTM DSM and AW3D30.
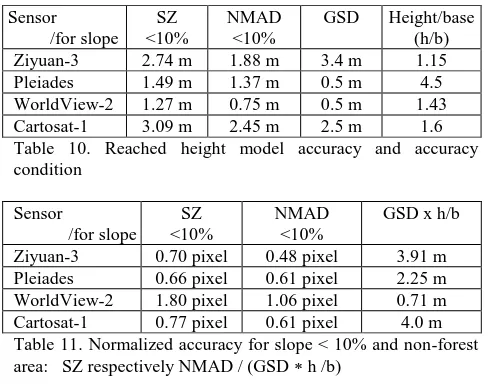
The height accuracy depends upon the terrain inclination. The distribution and size of terrain inclination varies from test area to test area, allowing only a comparison for areas with inclination below 10%. The canopy definition of forest depends upon the GSD of the imaging system respectively LiDAR footprint and also the type of forest. This does not allow a comparison of the accuracy for different areas. So finally the DSM accuracy only can be compared for flat areas without forest. The reached height model accuracy by theory depends upon the GSD multiplied with the height to base relation.
Sensor Table 11. Normalized accuracy for slope < 10% and non-forest area: SZ respectively NMAD / (GSD h /b)
The normalized accuracy, the influence to the x-parallax in relation to the GSD, (SZ respectively NMAD divided by (GSD h/b)) of course depends upon the character of the test area – if it is rough or smooth, and also the GSD itself. Nevertheless with exception of WorldView-2 the results are not too different. For the standard deviation with exception of WorldView-2 in the average a normalized value of 0.71 and for NMAD 0.61 has
been reached. With WorldView-2 in test area Karaburun as reference a LiDAR DSM exists, this leads to larger differences as reference DSM from optical images. In addition in this area the influence of quarries still exists, even if the main part has been masked out, and the area is extremely rough. This is also shown by the large difference between SZ and NMAD. So the limited result of the WorldView-2 DSM can be explained – it is not depending upon the quality of WorldView-2 images. The standard deviation of 0.71 GSD in the x-parallax,
d’Angelo, P., et al., 2013. Automatic orientation of large multi -temporal satellite image blocks: Proceedings of International Symposium on Satellite Mapping Technology and Application 2013
Jacobsen, K., 2016: Analysis and correction of systematic height model errors, ISPRS Archives - Volume XLI-B1, pages 333-339
Jiang, Y.-H. et al. 2015: Geometric Calibration and Accuracy Assessment of ZiYuan-3 Multispectral Images, IEEE Xplore 2015
Radhadevi, P.V., et al. 2016: Performance Assessment and Geometric Calibration of Resourcesat-2, Int. Arch. Photogramm. Remote Sens. Spatial Inf. Sci., XLI-B1, 237-244, 2016
Zhang, G. et al. 2015: Geometric accuracy improvement and assessment of Chinese high-resolution optical satellites, IEEE JSTARS, 2015.2429151