AN INCREMENTAL MAP BUILDING APPROACH VIA STATIC STIXEL INTEGRATION
M. Mufferta, S. Anztb, U. Frankea
aDaimler Research, Sindelfingen, Germany - [maximilian.muffert, uwe.franke]@daimler.com bHochschule f¨ur Technik (HFT), Stuttgart, Germany - [email protected]
KEY WORDS:Map Building, Stereo Vision, Stixel Representation, Evidential Theory
ABSTRACT:
This paper presents a stereo-vision based incremental mapping approach for urban regions. As input, we use the 3D representation called multi-layered Stixel World which is computed from dense disparity images. More and more, researchers of Driver Assistance Systems rely on efficient and compact 3D representations like the Stixel World. The developed mapping approach takes into account the motion state of obstacles, as well as free space information obtained from the Stixel World. The presented work is based on the well known occupancy grid mapping technique and is formulated with evidential theory. A detailed sensor model is described which is used to determine the information whether a grid cell isoccupied,freeor has anunknownstate. The map update is solved in a time recursive manner by using the Dempster‘s Rule of Combination. 3D results of complex inner city regions are shown and are compared with Google Earth images.
1 INTRODUCTION
Precise ego vehicle localization in urban regions is one of the major challenges in autonomous driving applications (Kammel et al., 2008), (Thrun, 2010). For this task, it is not sufficient to only use GPS information, because well known limitations like multi-path effects or signal shadowing occur in urban re-gions. Thus, precise self-localization approaches are often based on prior map information. Next to the (re)detection of 3D land-marks (Lategahn and Stiller, 2012), another possibility is the use of geometrical information of the static environment, like build-ing facades or traffic infrastructures (Larnaout et al., 2012). With the help of this information, the accuracy of self localization in-creases. Furthermore, modern driver assistance systems like lane change systems or collision avoidance systems (Muffert et al., 2013) would also benefit from detailed prior map information to support trajectory planning for the ego vehicle.
In this paper, the focus is on the incremental map building pro-cess in urban regions given the absolute pose and orientation of the ego vehicle. The goal is to update the map sequentially to achieve real time capability in future. For the mapping approach, the results should contain static environment information (e.g. building facades) since only this information is useful for further tasks such as ego vehicle localization. In contrast to the use of ultrasonic sensors (Pagac et al., 1998) or laser scanners (Thrun, 2010), a stereo camera system is applied which went into series production in the Mercedes-Benz S- and E-class in summer 2013. It is assumed that the approximated absolute pose of the experi-mental vehicle is known, e.g. by using an inertial measurements unit in combination with a GPS sensor.
For the first time we use the 3D scene representation called Stixel World (Pfeiffer and Franke, 2011) as input data for the mapping approach. It is computed from dense disparity images (Fig. 2(a)) at each acquisition time step. A Stixel is defined by its 2D position and 2D velocity, its width, and its height referring to the coordinate system of the ego vehicle (Fig. 2(b)). Hereby, the Stixel World efficiently describes dynamic and static objects, as well as free space information. In contrast to the raw input data (up to500.000disparity values), the 3D scene is represented by a few hundred Stixels only. As a result, this step reduces the com-putational burden for the following steps significantly. Due to named properties research groups of Driver Assistance Systems increasingly rely on 3D representations like the Stixel World.
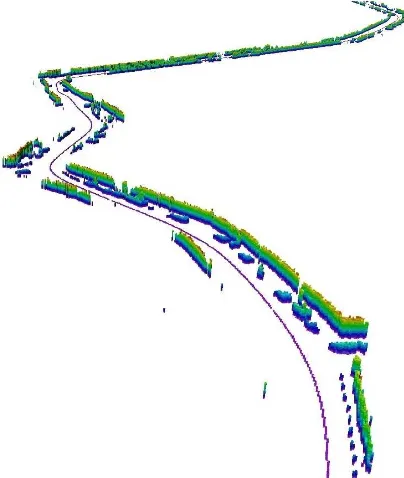
Figure 1: The result of the mapping approach for a3.000image sequence. For the visualization and the data structure the Oc-toMapRepresentation (Wurm et al., 2010) is used. The purple line represents the driven path of the ego vehicle. The height of the static environment is color encoded.
Subsequently, the multi-layered Stixel World is segmented into static and dynamic object classes using the approach by Erbset al. (Erbs et al., 2012), as seen in Fig. 2(c). This allows to exclude dynamic objects like driving vehicles or bicyclists, so that static environment information is only considered for the mapping ap-proach. In Fig. 2(d), the final set of Stixels used for the mapping approach is shown.
The remainder of this paper is organized as follows: Section 2 gives a brief overview about related work. Then, Section 3 points out the mapping process which is based on the idea of Cartesian occupancy grid maps (Moravec and Elfes, 1985) in combination with evidential theory (Shafer, 1976). Finally, results are shown in Section 4 and Section 5 summarizes the paper.
2 RELATED WORK
Elfes and Movarec (Elfes, 1987), (Moravec and Elfes, 1985) introduced the occupancy grids at first using wide angle sonar sensors. Thrunet al. (Thrun et al., 2005) give a detailed overview about probabilistic methods for 2D occupancy grid mapping tech-niques given the robot’s pose. At first, Thrunet al. describe an incrementalad hocapproach which is based on a binary Bayes filter. A drawback is the assumption that all grid cells are in-dependent and mostly initialized with a probability of0.5. Fur-thermore, the described sensor model is considered unsuitable for stereo vision sensors in the authors view: It returns fixed proba-bility values foroccupied(e.g.0.8) orfree(e.g.0.2) which does not capture the measurement characteristics of a stereo camera system. In addition, Thrunet al. formulate a maximum a poste-riori approach with a descriptive sensor model which considers the dependence of all grid cells. This is a golden standard model, but the disadvantage is the non incremental map update which is a requirement for the developed mapping approach. A detailed discussion of both methods can also be found in (Merali and Bar-foot, 2012).
To reconstruct the complete 3D environment of urban scenes Gallupet al. (Gallup et al., 2010) and Zhenget al. (Zheng et al., 2012) present probabilistic methods using street-level videos or photo collections. The required depth maps are estimated using either structure from motion or dense stereo techniques.
Gallupet al. (Gallup et al., 2010) use a n-layer height map which allows the representation of overhanging structures like balconies or bridges. Zhenget al. (Zheng et al., 2012) take up this idea and present an efficient incremental depth map fusion framework us-ing wavelet based compression techniques.
The developed mapping process is formulated with eviden-tial theory (Shafer, 1976). We take up the idea from (Moras et al., 2011) and (Yang and Aitken, 2006) which use ultrasonic and range sensors in contrast to a stereo camera system.
Yanget al. (Yang and Aitken, 2006) give a detailed overview of evidential map building techniques: Each grid cell state is de-scribed by its power set which is defined by the subsetsfree, oc-cupiedandunknown. Furthermore, the conflict in a cell is de-scribed. For each subset a probability assignment function is defined which formulates a detailed characterization of the sen-sor model. The Dempster‘s Rule of Combination (Shafer, 1976) makes an incremental cell update possible.
3 MAPPING PROCESS
Assuming a planar surface of the environment, a 2D Cartesian reference grid mapM={mj}, j ∈ {1, ..,J}with the cellsmj is given. For each cell hypotheses offree(F) andoccupied(O) are made. As described in (Moras et al., 2011) and (Yang and Aitken, 2006), in evidential theory the power set is defined by
2Ω={∅,{O},{F},{O, F}}. (1)
The subsetΩ = {O, F}describes the ignorance of a cell and is denoted as theunknownstateU. The subset∅is the empty set. Following the definition of Eq. (1), for each element A of the power set abelief mass function m∗j(A)is specified with the
prop-ertym∗j(∅) +m
∗
j(O) +m
∗
j(F) +m
∗
j(U) = 1. The complete state
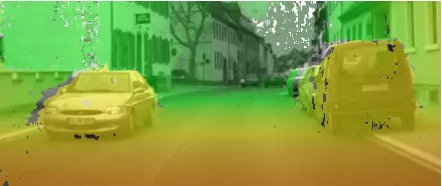
(a) The dense disparity image, estimated via SGM (Gehrig et al., 2009). The color represents the distance. Red stands for near, green for far away objects.
(b) The Dynamic Stixel representation (Pfeiffer and Franke, 2011). It contains free space information and object boundaries. The arrows pre-dict the Stixel position within the next0
.5sec.
(c) The results of the Stixel segmentation (Erbs et al., 2012). The vehi-cle on the left side is classified as an oncoming object. The correspond-ing Stixels are red. The static environment is colored in dark grey.
(d) The input data for the mapping approach: The static Stixels are col-ored in yellow to highlight the input data. Here, Stixels with a distance of 25 m to the ego vehicle coordinate system are used.
Figure 2: Pipeline of the generation of the input data.
of a cell is given by the Cartesian information of the center point (XjandZj) and thebelief mass function:mj= [XjZjm∗j(A)]T.
3.1 Input data
Referred to the 3D Cartesian space, each StixelSi= [s,s˙, H, W]T i
with i ∈ {1, ..,I}is parametrized by its position vectors = [X, Z]T
with the lateral and longitudinal componentsX andZ, its heightH and its widthW. Consequently, obstacles are de-scribed by planar, vertical oriented surfaces which is a common assumption in urban regions. As a result, facades behind parking vehicles can be mapped, as shown in Fig. 5.
A well known challenge in mapping approaches is that dy-namic objects have to be detected to be not taken into account in the fusion step. To overcome this problem, the Stixels are tracked over time which is achieved by the 6D-Vision principle (Franke et al., 2005). This scheme uses Kalman filter to estimate both the position and velocity of each Stixel. Performing this step makes it possible to obtain a motion states˙= [ ˙X,Z˙]T
.
The separation of the scene into moving or stationary obsta-cles is achieved by a multi-class traffic scene segmentation (Erbs et al., 2012) which is based on a conditional random field frame-work. With the help of this segmentation, from now,Sidescribes only the static Stixels which are used as input data. An example is shown in Fig. 2(d).
With the help of the pinhole camera projection equation (pro-jection from the disparity(d)-column(u)-space to the 3D space with given variancesσd2andσ2u) and using Gaussian error
prop-agation it could be shown that the covariance matrixΣ(is)of the
positionsiof a Stixel is estimated by
Σ(is) =
including the baselineband the focal lengthfof the stereo rig. Due to the assumption that the ego vehicle’s position and ori-entation is known the Stixels are transformed into the reference coordinate system of the mapMat each acquisition time step.
3.2 Sensor Model
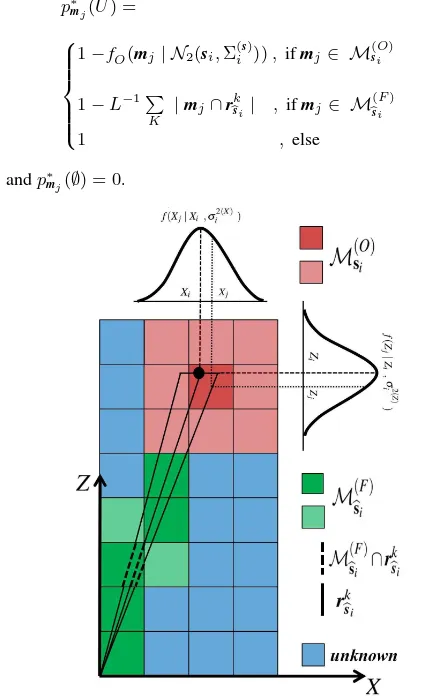
The sensor model describes in which way the Stixel position siinfluences a set of cellsMsi ∈ M. Due to the fact that each Stixel obtains information about free space and obstacles (see Section 3.1), the cellsMsiare partitioned into cells which sup-port a set ofoccupiedcellsM(siO)and a set offreecellsM(
F)
bss i i
, as seen in Fig. 3. Additionally, cells which are not influenced by a Stixel (i.e.M\Msi) are defined with anunknownstate U.
To formulate the mapping process with evidential theory, at first, thebelief mass functionof the subsetm∗j(O)has to be
de-fined. Next to the cell which is directly hit by a Stixel a region of cell neighbors is considered inM(siO). The size of the region de-pends on the estimated uncertainties ofsi. With the help ofΣ(s)
i ,
thebelief mass functionfor the subset O is defined by
m∗j(O) =
i ))returns an occupancy value
of evidence given the 2D normal distributionN2(si,Σ(
s)
i )as long
as the current cellmjis an element ofM(siO).
As shown in Fig. 3, the space between the ego vehicle and the StixelsbSi ∈Siwhich represents the first obstacles in the image
rows is free space. A set ofK raysRbsi = {rk}bsi withk ∈
{1, .., K}from the ego vehicle to the Stixel are defined where
Kdepends on the width of the StixelWi. All cells intersecting
with those rays are defined asMb(sFi). Subsequently, the rays are partitioned into ray segments as illustrated in Fig. 3.
In a more mathematical way, the intersectionmj∩rkof an arbitrary cellmjwith a rayrkreturns the adequate ray segment with its length|mj∩rk|. The assumption is made that the more a cell includes rays segments, the greater is the evidence offree.
With the summarized lengthL = P
K
Figure 3: The sensor model of the mapping approach. The cell which is directly hit by a Stixel is dark red, the immediate cell neighbors are bright red. For these cells an evidential value of occupiedis estimated which is based on a two dimensional Gaus-sian distribution. The distribution is defined by the position of a Stixel si = [X, Z]i and the covariance matrix Σ(s)
i which
3.3 Incremental Map-Updating via Dempster’s Rule of Com-bination
Up to this point, the sensor model and the definition of the be-lief mass functionare described. Now, an incremental map update between consecutive time stepst−1andtis realized to recur-sively merge new Stixel measurements into the existing map. The Dempster‘s Rule of Combination is used which combines two independent statesm∗j,t(A) andm
∗
j,t−1(A)at consecutive time
steps. The general formulation is defined by
m∗j,t(A)⊕m
In this contribution, the fusion step is formulated as
m∗j(O) =
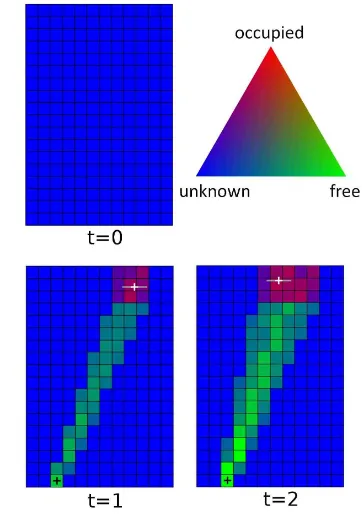
For a better understanding of the update step from Equation 7, results of a simulation are shown in Fig. 4:
At the beginning (t= 0), all cells are initialized with an un-knownstate which is visualized by a dark blue map. Because of this, the power set of a cell is defined asm∗j,0(O) =m∗j,0(F) = m∗j,0(∅) = 0andm∗j,0(U) = 1.
At the next time step (t= 1), the figure points out the integra-tion of one Stixel measurement into the map. The evidence for occupiedgrows in these cells which are directly hit by the Stixel. In the cells between the ego position (black cross) and the Stixel the subset offreegrows slowly, visualized by the color green.
The influence of an additional measurement and the recur-sive filter characterization can be seen at the following time step
t = 2: In overlapping areas the evidence offreeandoccupied grows which is particularly shown by the free space area.
During the update step K is not equal to zero, as long as a conflict occurs in the cells.As an example, this case happens if a current Stixel measurement overlaps free space area from the last time step. Specifically, the conflict is significant if Stixel outliers occur. This effects a robustness of our algorithm.
As seen in Eq. 7 the subsets O, F and U are normalized by the term(1−K)at each time step to satisfy the properties of the belief mass function.
To obtain the mentioned height layer, the Stixel heightHi,tis
taken into account. For each cell a heightHj,tis estimated over
time by
Note that the heightHj,0 is initialized by zero. For the
visual-ization of the 3D environment model, the open source framework OctoMap(Wurm et al., 2010) is used which is based on a 3D Octree representation (see Fig. 1).
Figure 4: Example of the time recursive update step: At t = 0, the map is initialized asunknown(dark blue). At time step
t = 1the integration of one Stixel into the map is shown. The cell which is directly hit is red, the immediate cell neighbors are purple. The field of view between ego position (black cross) and the Stixel position is free space which is encoded with the color green. With an additional Stixel measurement at time stept= 2 history and current measurements are merged. The stronger the color saturation the stronger the evidence of free, occupiedor unknown.
4 RESULTS
In this work, mapping results of a3.000image sequence of an urban drive (see Fig. 1) are presented. The used stereo cam-era system is mounted behind the windshield of the experimental vehicle. It has1024×440px image sensors and records with 25Hz. With the help of an inertial measurement unit from iMar1 in combination with a GPS sensor, a global vehicle ego motion was determined. An image Stixel width of5px and a grid cell size of 0.04 m2is chosen. We assume a disparity uncertainty of
σd = 0.5pxand a column uncertainty ofσd= 0.25px. To
re-duce the number of outliers only Stixels with a distance less than 25m to the ego vehicle’s position are used.
Fig. 5 shows the occupancy grid results of a20m×30m exam-ple map which revealsoccupied(red),free(green) andunknown (blue) grid cells. The stronger the color saturation the stronger the evidence offree,occupiedorunknown. On the right side of the map an entrance gate, two parking vehicles and the building facades are visualized. The area between the vehicles up to the building facade isunknownbecause this area is not visible. On the left side the poles of the parking area are mapped correctly which underlines the high level of detail of the Stixel World.
Figure 5: An exemplary mapping result is shown. On the left side the original images with the input data of three time steps are presented. The map in the center shows the results using the described approach. The color revealsoccupied(red),free(green) and unknown(blue) areas of the environment. The stronger the color saturation the stronger the evidence offree,occupiedorunknown. On the right side of the map an entrance gate, two parking vehicles and the building facades are mapped correctly. Furthermore, poles on the left side are presented, too. The cells ”behind” the vehicle have anunknownstate. On the right side of the figure the height layer is shown. There, the color encodes the height from zero (dark blue) to about 4 m (dark red). The facades are about 4 m high; vehicles, the entrance gate and the poles have heights between 0.5-1.5 m.
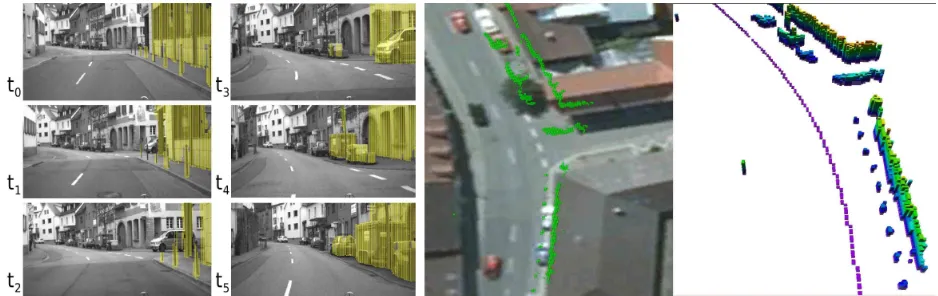
Figure 6: The first detailed example of the3.000image sequence is shown. The original images with the input Stixels (left), the 2D mapping results overlaid on Google Earth images (center) and the 3D representation (right) using theOctoMaprepresentation are shown. Due to the segmentation of the multi-layered Stixel World into stationary and moving objects, the oncoming vehicle is not taken into account for the mapping approach. Furthermore, walls behind walls are represented. Because of the limited field of view the right building in this scene could not be mapped.
In addition, Fig. 5 shows the height layer for the map. The building facades are about 4 m high; vehicles, the entrance gate and the poles have heights between 0.5-1.5 m which are conclu-sive results.
In Fig. 6 and Fig. 7 detailed results from the complete image sequence are shown. For a consistency check of the pipeline of the mapping approach the results are overlaid on Google Earth images. Both figures point out that mapped corners of buildings, facades and parking areas are consistent with the Google Earth images. Note that we have not take into account uncertainties in the ego vehicle’s position.
As shown in Fig. 6, the oncoming vehicle is ignored for the mapping approach thanks to the fact that the named Stixel seg-mentation step (Erbs et al., 2012) allows to ignore moving ob-jects.
Fig. 7 points out that the poles next to the right driving corridor are mapped correctly. Because of the fact that the velocity of the waiting vehicle at the intersection is zero, the vehicle is classified as a static object.
In addition, the comparison with the Google Earth images points out a drawback using a stereo camera system: Due to the limited field of view the complete right building in the scene of Fig. 6 was not recorded and, as a consequence, can not be mapped. To overcome this drawback wide angle lenses should be used in future work.
5 SUMMARY
In this work, a stereo vision based incremental mapping ap-proach for urban regions was presented. For the first time the 3D environment representation multi-layered Stixel World is used as input data. For reliable mapping results the Stixel World was segmented into static and dynamic objects. Thus, only static en-vironment information is used for our technique.
The mapping approach was formulated with evidential the-ory which allows the explicit representation offree,occupiedand unknownregions. A detailed sensor model describes how Stixel measurements influence the state of the cells. To fuse new Stixels into the map incrementally, the Dempster‘s Rule of Combina-tion was used. In a further step, a recursive height layer for the map was estimated. Detailed mapping results of a3.000image sequence were shown. Furthermore, the mapping results were compared with Google Earth images for a consistency check of the pipeline of the mapping approach.
REFERENCES
Elfes, A. E., 1987. Sonar-based real-world mapping and naviga-tion. Journal of Robotics and Automation 3(3), pp. 249–265.
Erbs, F., Schwarz, B. and Franke, U., 2012. Stixmentation - prob-abilistic stixel based traffic scene labeling. In: British Machine Vision Conference (BMVC), Surrey, England, pp. 71.1–71.12.
Franke, U., Rabe, C., Badino, H. and Gehrig, S., 2005. 6d-vision: Fusion of stereo and motion for robust environment perception. In: German Association for Pattern Recognition (DAGM), Vi-enna, Austria.
Gallup, D., Pollefeys, M. and Frahm, J.-M., 2010. 3d reconstruc-tion using an n-layer heightmap. In: German Associareconstruc-tion for Pattern Recognition (DAGM), Darmstadt, Germany, pp. 1–10.
Gehrig, S., Eberli, F. and Meyer, T., 2009. A real-time low-power stereo vision engine using semi-global matching. In: Interna-tional Conference on Computer Vision Systems (ICVS).
Kammel, S., Ziegler, J., Pitzer, B., Werling, M., Gindele, T., Jagzent, D., Schr¨oder, J., Thuy, M., Goebl, M., Hundelshausen, F. v., Pink, O., Frese, C. and Stiller, C., 2008. Team annieway’s autonomous system for the 2007 DARPA Urban Challenge. Jour-nal of Field Robotics 25(9), pp. 615–639.
Larnaout, D., Bourgeois, S., Gay-Bellile, V. and Dhome, M., 2012. Towards bundle adjustment with GIS constraints for on-line geo-localization of a vehicle in urban center. In: 3DimPVT, Z¨urich, Switzerland.
Lategahn, H. and Stiller, C., 2012. Experimente zur hochpr¨azisen landmarkenbasierten Eigenlokalisierung in un-sicherheitsbehafteten digitalen Karten. In: UNiDAS e.V, Walt-ing, Germany.
Merali, R. S. and Barfoot, T. D., 2012. Patch map: A benchmark for occupancy grid algorithm evaluation. In: IEEE/RSJ Inter-national Conference on Intelligent Robots and Systems(IROS), Algarve, Portugal.
Moras, J., Cherfaoui, V. and Bonnifait, P., 2011. Moving ob-jects detection by conflict analysis in evidential grids. In: IEEE Intelligent Vehicles Symposium (IV), Baden-Baden, Germany, pp. 1122–1127.
Moravec, H. P. and Elfes, A. E., 1985. High resolution maps from wide angle sonar. In: IEEE International Conference on Robotics and Automation (ICRA), pp. 116 – 121.
Muffert, M., Pfeiffer, D. and Franke, U., 2013. A stereo-vision based object tracking approach at roundabouts. In: IEEE Intel-ligent Transportation Systems Magazine, Volume 5, Number 2, pp. 22–23.
Pagac, D., Nebot, E. and Durrant-Whyte, H., 1998. An evi-dential approach to map-building for autonomous vehicles. In: IEEE Transactions on Robotics and Automation, Vol. 14num-ber 4, pp. 623–629.
Pfeiffer, D. and Franke, U., 2011. Towards a global optimal multi layer Stixel representation of dense 3D data. In: British Machine Vision Conference BMVC, BMVA Press, Dundee, Scotland.
Shafer, G., 1976. A Mathematical Theory of Evidence. Princeton University Press.
Thrun, S., 2010. What we’re driving at. http://googleblog.
blogspot.de/2010/10/what-were-driving-at.html.
Thrun, S., Burgard, W. and Fox, D., 2005. Probabilistic Robotics. Intelligent Robotics and Autonomous Agents, The MIT Press.
Wurm, K. M., Hornung, A., Bennewitz, M., Stachniss, C. and Burgard, W., 2010. OctoMap: A probabilistic, flexible, and com-pact 3D map representation for robotic systems. In: Proceedings of the ICRA 2010 Workshop on Best Practice in 3D Perception and Modeling for Mobile Manipulation, Anchorage, AK, USA.
Yang, T. and Aitken, V., 2006. Evidential mapping for mobile robots with range sensors. In: -IEEE Transactions on Instru-mentation and Measurement, IMTC, Ottawa, Ontario, Canada, pp. 1422–1429.