TERRAIN EXTRACTION BY INTEGRATING TERRESTRIAL LASER SCANNER DATA AND SPECTRAL INFORMATION
C. L. Lau a, S. Halim a, M. Zulkepli a, A. Mohd Azwan b, W. L. Tang a, A. K. Chong c
a
Department of Geoinformation, Faculty of Geoinformation and Real Estate, Universiti Teknologi Malaysia, UTM Skudai, Malaysia – [email protected], [email protected],
[email protected], [email protected]
b
Department of Surveying Science and Geomatic, Faculty of Architecture, Planning and Surveying, Universiti Teknologi Mara (Perlis), Malaysia – [email protected]
c
School of Civil Engineering and Surveying, University of Southern Queensland, Australia –
KEY WORDS: Terrestrial Laser Scanner, Colour Image, Spectral Information, Integration, Terrain Extraction
ABSTRACT:
The extraction of true terrain points from unstructured laser point cloud data is an important process in order to produce an accurate digital terrain model (DTM). However, most of these spatial filtering methods just utilizing the geometrical data to discriminate the terrain points from non-terrain points. The point cloud filtering method also can be improved by using the spectral information available with some scanners. Therefore, the objective of this study is to investigate the effectiveness of using the three-channel (red, green and blue) of the colour image captured from built-in digital camera which is available in some Terrestrial Laser Scanner (TLS) for terrain extraction. In this study, the data acquisition was conducted at a mini replica landscape in Universiti Teknologi Malaysia (UTM), Skudai campus using Leica ScanStation C10. The spectral information of the coloured point clouds from selected sample classes are extracted for spectral analysis. The coloured point clouds which within the corresponding preset spectral threshold are identified as that specific feature point from the dataset. This process of terrain extraction is done through using developed Matlab coding. Result demonstrates that a higher spectral resolution passive image is required in order to improve the output. This is because low quality of the colour images captured by the sensor contributes to the low separability in spectral reflectance. In conclusion, this study shows that, spectral information is capable to be used as a parameter for terrain extraction.
1. INTRODUCTION
1.1 Evolution of the Three Dimensional (3D) Data Collection Techniques
Nowadays, 3D data acquisition tools are changing from the conventional method of total station to more efficient methods such as Global Positioning System (GPS), close range photogrammetry (CRP) and laser scanner in many applications, namely civil construction,
information on some discrete points and not the entire surface of the interest surface area (Bitelli et al., 2004). Besides that, TLS also has the capability as ALS in capturing 3D points and without contacting with the scanned object.
1.2 Point Clouds Filtering
The process of data filtering is to remove the noise and unwanted data from the dataset before further processing for example, 3D modelling and 3D analysis. This is because the collected 3D point cloud data not only consist of bare earth points, but also the non-bare earth object points. Hence, the need of data filtering is required in order to differentiate between point clouds from bare earth and those point clouds Terrain Model (DTM) become not accurate and the quantitative precise analysis of the situation becomes not reliable (Barbarella and Fiani, 2012). Therefore, the dataset for the accurate DTM generation should only consists of the terrain points and avoid as much as possible for the non-terrain points.
In general, the existing filtering algorithms can be categorised into six main types and they are morphological filter, progressive densification filter, surface-based filter, segmentation-based filter, full-waveform analysis and spectral filter method. Normally, a threshold value is set in the discriminant function for detecting the outlier points (Barbarella and Fiani, 2013). However, these filtering approaches are still semi-automated and manual editing is still required (Guarnier et al., 2012).
1.3 Spectral Information for Point Clouds Features Extraction
Each of the scanned point contains the intensity value as fourth attribute. This point cloud intensity is a type of spectral information which is the strength of the return laser signal from the scanned surface. Besides that, visible channels
which consist of red, green and blue (RGB) spectral band value also can be added into the point cloud as add-on spectral data by integrating both TLS and digital camera. Point cloud intensity had been used as one of the spectral information for point cloud segmentation and filtering process which had been done by Lichti (2005), Sithole (2005), Baligh et al. (2008), Yunfei et al. (2008), Guarnieri et al. (2012) and Pirotti et al. (2013). Maximum likelihood discriminant function was applied by Lichti (2005) to discriminate between different surface classes through analysing the intensity of the point cloud. Whereas Baligh et al. (2008) applied wavelet de-noising on the raw range image of point cloud by analysing amplitude of point cloud as pre-filtering process. Meanwhile, the calibrated relative reflectance of the point cloud was exploited by Guarnieri et al. (2012) and Pirotti et al. (2013) as pre-filtering process which in under online waveform processing. The laser signal reflectance threshold was identified from frequency distribution plot of the reflectance data. However, the use of point cloud intensity data is still not promising for separating the non-ground and ground points.
2. CASE STUDY 2.1 Description of Study Area
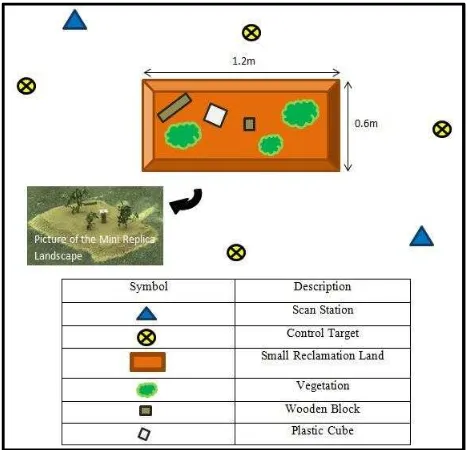
The data acquisition for the preliminary study on the developed method was conducted at a mini replica landscape in Universiti Teknologi Malaysia (UTM), Skudai campus before it is applied in a complex landscape. The mini replica landscape consists of some vegetation, wooden block and plastic cube on top of small reclamation land with the approximate dimension of 1.2m×0.6m as shown in Figure 1.
Figure 1. The sketch of overall layout of the scan stations, control points and the mini replica
landscape
2.2 Data Collection
Leica ScanStation C10 was used in the process of data acquisition. First of all, four B&W target were used as control points and they were established around the mini replica landscape for the purpose of point clouds registration. Then, two scan stations were used to cover the entire mini replica landscape. The scan resolution used in the data acquisition process is the highest scan resolution (0.02m horizontal and vertical spacing at 100m). After finished with scanning, it was followed by images capturing by using the scanner built-in camera. The type of the built-in camera used is a 4
megapixels camera and the size of the provided image is 1920 x 1920 pixels.
2.3 Data Processing
In this case study, the colour images captured were mapped automatically onto the point clouds dataset using Leica Cyclone (v. 7.3.3) software as those images were captured by built-in camera of the Leica ScanStation C10 scanner where both sensor are well integrated. Figure 2 (a) and (b) shows the different between the coloured point clouds and point clouds with laser intensity only.
Figure 2. (a) Coloured point clouds and (b) the point clouds with laser intensity only of the
study area
while the terrain is referring to the flat surface terrain.
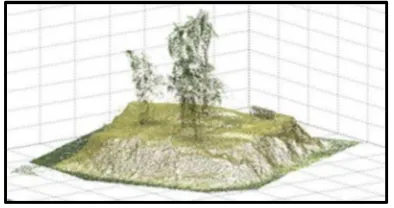
The spectral information of the coloured point clouds for the selected sample classes are analysed by calculating the maximum, minimum and mean of every spectral band (R, G and B) for each interest feature region. After that, the spectral information for each type of interest feature was plotted into spectral feature-space histograms (RGB) by using Matlab. Then, specific threshold value for each type of feature was determined by analysing the average distribution of the spectral information for each individual band. The spectral threshold ( +/- 10 from the mean value of each corresponding spectral band) are used in order to extract each different types of feature from the coloured point clouds. This process of terrain extraction is done through using developed Matlab coding. Figure 3 shows the coloured point clouds in Matlab program.
Figure 3. The view of coloured point clouds of the mini replica landscape in Matlab program
3. RESULTS AND DISCUSSION 3.1 Spectral Feature-space Histograms
Figure 4 until Figure 8 shows the spectral feature-space histograms for each individual RGB spectral band of different sample of features which are terrain, slope terrain, vegetation, wood and road. From all of the histograms shown below, the shape of the data distribution histograms show skewed right except feature-space histograms of the slope terrain sample which show nearly symmetric distribution. From these corresponding histograms, the reflection of the individual RGB spectral band for different features can be
studied by observing the span of the histogram, mean value of each spectral band, and the concentration of the upper and lower end of the histogram. For example, the right tail of the vegetation and wood feature-space histogram is longer compared to the terrain sample feature-space histogram although they show same pattern which is right skewed distribution. Besides that, the shape of the histogram is also depending on the sample size of the feature class. Furthermore, the mean of each spectral band for all of the sample classes have been visually illustrated in Figure 9.
Figure 4. Spectral feature-space histograms for one of the terrain sample in individual spectral
band
Figure 5. Spectral feature-space histograms for one of the slope terrain sample in individual
spectral band
Figure 6. Spectral feature-space histograms for one of the vegetation sample in individual
Figure 7. Spectral feature-space histograms for wood in individual spectral band
Figure 8. Spectral feature-space histograms for road in individual spectral band
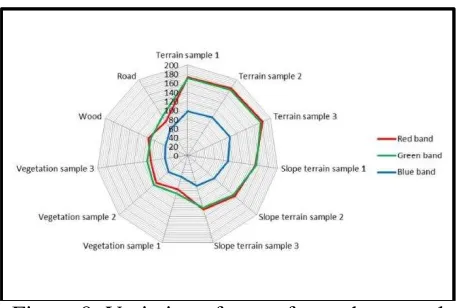
Figure 9. Variation of mean for each spectral band of different feature sample classes
From Figure 9, the feature classes for terrain, slope terrain and wood show the same trend of mean value (red band ˃ green band ˃ blue band) for three of the spectral bands. The feature sample classes of terrain, slope terrain and wood have the same trend because the colour of these feature surfaces is almost the same which is in brown colour. On the other hand, the feature classes for vegetation and road show another type of trend for the mean value (green band ˃ red band ˃ blue band). In this case, the green band is the highest among the spectral bands. This is because both of these features
appear greenish in the images. The main reason for the different in the shape and distribution of the different feature’s spectral feature-space histogram is the reflectivity and absorbability of the sun’s radiation. On the other hand, the surface texture and the incidence angle of the sunlight also will be one of the causes.
Nevertheless, there are some degrees of difference in term of mean value of each spectral band for different type of features although they are showing the same trend, for instance the terrain and wood. This is because different featureThe average mean for the three of the spectral bands (R, G, B) for terrain in term of 8-bit colour value are (177.4385, 173.9557, 100.2641) while the mean for the three of the spectral bands for wood are (95.6035, 89.4591, 54.2071).
3.2 Discussion
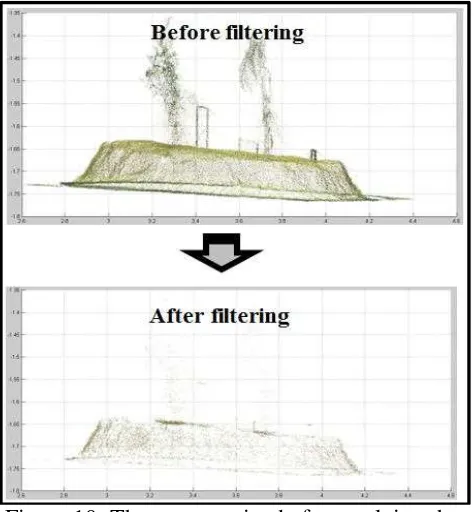
In this study, the spectral information of the terrain and slope terrain class was applied in the terrain extraction process. In other word, the threshold value set for terrain points extraction is solely depending on the digital number of the three spectral bands for the terrain and slope terrain feature class. The samples of these two features class were chosen randomly and the spectral information of the point clouds in these chosen interest region were used to get the mean value of the digital number for the three spectral bands. The output gained for the terrain extraction approach based on the spectral information is shown in Figure 10.
complex modeling of the features reflectance are needed.
Figure 10. The output gained after applying the non-terrain filtering approach based on the
spectral information
4. CONCLUSION
The results obtained from this study show that the spectral information can be applied as one of the attribute in the terrain extraction approach. This is because the spectral reflectance from different types of feature classes is unique and able to be differentiated from each other by analysing on the trend of the mean value for the spectral bands. However, the quality of this method can be improved by combining both spectral information and geometrical information for terrain extraction.
REFERENCES
Alba, M. and Scaioni, M. 2010. Automatic Detection of Changes and Deformation in Rock Faces by Terrestrial Laser Scanning. Proceedings of International Archives of the Photogrammetry, Remote Sensing and Spatial Information Sciences, Newcastle upon Tyne,
UK, Commission V, WG V/3, ISPRS Vol. 38, Part 5, pp. 11-16.
Baligh, A., Zoej, M. V., and Mohammadzadeh, A. 2008. Bare Earth Extraction from Airborne Lidar Data using Different Filtering Methods. In Proceedings of the International Archives of the Photogrammetry, Remote Sensing and Spatial Information Sciences, Beijing, China, Commission III, Vol. 37, Part B3b, pp. 237-240.
Barbarella, M. and Fiani, M. 2012. Landslide Monitoring Using Terrestrial Laser Scanner: Georeferencing and Canopy Filtering Issues in a Case Study. International Archives of the Photogrammetry, Remote Sensing and Spatial Information Sciences, Melbourne, Australia, Commission V, WG V/3, Vol. 39, Part B5, pp. 157-162.
Barbarella, M. and Fiani, M. 2013. Monitoring of Large Landslides by Terrestrial Laser Scanning Techniques: Field Data Collection and Processing. European Journal of Remote Sensing, 46, pp. 126-151.
Bitelli, G., Dubbini, M. and Zanutta, A. 2004. Terrestrial Laser Scanning and Digital
Photogrammetry Techniques to Monitor
Landslide Bodies. International Archives of Photogrammetry, Remote Sensing and Spatial Information Sciences, Istanbul, Turkey, Commission V, WG V/2, Vol. 35, Part 5, pp. 246-251.
Guarnieri, A., Pirotti, A., and Vettore, A. 2012. Comparison of Discrete Return and Waveform Terrestrial Laser Scanning for Dense Vegetation Filtering. The International Archives of Photogrammetry, Remote Sensing and Spatial Information Sciences, Melbourne, Australia, Commission VII, Vol. 39, Part B7, pp. 511-516.
Pirotti, F., Guarnieri, A. and Vettore, A. 2013. Vegetation Filtering of Waveform Terrestrial Laser Scanner Data for DTM Production. Applied Geomatics, 5(4), pp. 311-322.
Sapkota, P. 2008. Segmentation of Coloured Point Cloud Data. International Institute for
Geo-Information Science and Earth
Observation. Thesis Master of Science in Geo-information Science and Earth Observation, Specialisation: Geoinformatics.
Schulz, T. 2007. Calibration of a Terrestrial Laser Scanner for Engineering Geodesy. Technical University of Berlin. Thesis Doctoral of Science.
Sithole, G. 2005. Segmentation and
Classification of Airborne Laser Scanner Data. ITC, University of Delft, The Netherlands. Ph.D. Thesis.
Yunfei, B., Guoping, L., Chunxiang, C., Xiaowen, L., Hao, Z., Qisheng, H., Linyan, B., and Chaoyi, C. 2008. Classification of LIDAR Point Cloud and Generation of DTM from LIDAR Height and Intensity Data in Forested
Area. The International Archives of