POTENTIAL OF AIRBORNE IMAGING SPECTROSCOPY AT CZECHGLOBE
J. HANUŠ, T. FABIÁNEK, L. FAJMON
CzechGlobe –Global Change Research Institute CAS, 603 00, Bělidla 986, Brno, Czech Republic - [email protected]
Commission TeS: WG I/2
KEY WORDS: Imaging Spectroscopy, Hyperspectral sensors, Airborne platform, Pre-processing chain
ABSTRACT:
Ecosystems, their services, structures and functions are affected by complex environmental processes, which are both natural and human-induced and globally changing. In order to understand how ecosystems behave in globally changing environment, it is important to monitor the current status of ecosystems and their structural and functional changes in time and space. An essential tool allowing monitoring of ecosystems is remote sensing (RS). Many ecosystems variables are being translated into a spectral response recorded by RS instruments. It is however important to understand the complexity and synergies of the key ecosystem variables influencing the reflected signal. This can be achieved by analysing high resolution RS data from multiple sources acquired simultaneously from the same platform. Such a system has been recently built at CzechGlobe - Global Change Research Institute (The Czech Academy of Sciences).
CzechGlobe has been significantly extending its research infrastructure in the last years, which allows advanced monitoring of ecosystem changes at hierarchical levels spanning from molecules to entire ecosystems. One of the CzechGlobe components is a laboratory of imaging spectroscopy. The laboratory is now operating a new platform for advanced remote sensing observations called FLIS (Flying Laboratory of Imaging Spectroscopy). FLIS consists of an airborne carrier equipped with passive RS systems. The core instrument of FLIS is a hyperspectral imaging system provided by Itres Ltd. The hyperspectral system consists of three spectroradiometers (CASI 1500, SASI 600 and TASI 600) that cover the reflective spectral range from 380 to 2450 nm, as well as the thermal range from 8 to 11.5 μm. The airborne platform is prepared for mounting of full-waveform laser scanner Riegl-Q780 as well, however a laser scanner is not a permanent part of FLIS. In 2014 the installation of the hyperspectral scanners was completed and the first flights were carried out with all sensors.
The new hyperspectral imaging system required adaptations in the data processing chain. The established pre-processing chain (radiometric, atmospheric and geometric corrections), which was tailored mainly to the AISA Eagle instrument operated at CzechGlobe since 2004, has been now modified to fit the new system and users needs. Continuous development of the processing chain is now focused mainly on establishing pre-processing of thermal data including emissivity estimation and also on joint processing of hyperspectral and laser scanning data.
1. INTRODUCTION
1.1 Hyperspectral remote sensing at CzechGlobe
Airborne hyperspectral remote sensing (imaging spectroscopy) is an advanced tool in the field of remote sensing (RS) (Goetz, 2009). Compared to traditional multispectral sensors, which record the reflected solar radiation in several broad spectral bands, hyperspectral sensors record it into many narrow continuous spectral bands (Schaepman, 2009). Therefore imaging spectroscopy data provide almost contiguous spectral information about the Earth’s surface in the optical domain of the electromagnetic spectra. A typical spectral range covered by hyperspectral sensors spans from the visible and near-infrared (VNIR) bands (i.e. 400 – 1000 nm) towards the short-wave infrared (SWIR) bands (i.e. 1000 – 2500 nm). Hyperspectal RS therefore brings an enhanced insight into spectral properties of Earth’s surfaces. Furthermore, it stimulates a development of new methods for high accuracy Earth surface object detection and quantitative retrieval of surface properties (Kokaly et al., 2009).
Global Change Research Institute - CzechGlobe (CVGZ, Academy of Sciences of the Czech Republic) has been operating the VNIR hyperspectral sensor AISA Eagle (Specim Ltd., Finland) since 2004. In 2014 CzechGlobe has completed a new platform for advanced remote sensing called Flying Laboratory of Imaging Systems (FLIS). This paper introduces FLIS, i.e. an airborne carrier equipped with a suite of hyperspectral sensors and eventually a laser scanner, and further it introduces a pre-processing chain for hyperspectral RS data established at CzechGlobe.
1.2 Flying Laboratory of Imaging System (FLIS)
FLIS consists of an airborne carrier, a suite of hyperspectral sensors and eventually an airborne laser scanner.
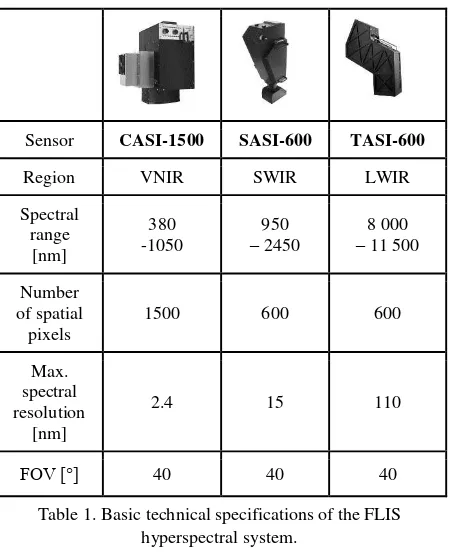
The airborne carrier is a Cessna 208B Grand Caravan with two fuselage slits for imaging RS instruments (see Fig. 1). Both slits are equipped with an inertial measurement unit (IMU) and global navigation satellite system (GNSS) receivers POSAV410. Both systems allow near teal-time geo-processing of image data acquired by deployed imaging instruments. The suite of airborne imaging spectroradiometers (hyperspectral system) consist of three sensors produced by the Canadian company ITRES Research Limited. The first sensor, CASI-1500, acquires data in the VNIR region. The second sensor, SASI-600, acquired data in the SWIR region and the last sensor TASI-600 covers the thermal infrared (LWIR) spectral region. Basic technical specifications of the FLIS hyperspectral systems are shown in Table 1.
The FLIS is prepared for installation of a full-waveform airborne laser scanner. For applications that require laser scanner data this instrument could rented and installed in the aircraft.
The International Archives of the Photogrammetry, Remote Sensing and Spatial Information Sciences, Volume XLI-B1, 2016 XXIII ISPRS Congress, 12–19 July 2016, Prague, Czech Republic
This contribution has been peer-reviewed.
Sensor CASI-1500 SASI-600 TASI-600
Region VNIR SWIR LWIR
Spectral range
[nm]
380 -1050
950 – 2450
8 000 – 11 500
Number of spatial
pixels
1500 600 600
Max. spectral resolution
[nm]
2.4 15 110
FOV [°] 40 40 40
Table 1. Basic technical specifications of the FLIS hyperspectral system.
2. VNIR, SWIR DATA PRE-PROCESSING CHAIN
The chain has been continuously improved by extending it with various processing schemes tailored to the CzechGlobe hyperspectral sensors and to the needs of RS data end-users. If hyperspectral data are acquired for very demanding purposes, excellent calibration and corrections of the raw RS data is required. In this case, it is necessary to carry out a supportive ground measurement campaign, where additional data on surface reflectance, geometric accuracy of selected ground control points and atmospheric conditions are measured simultaneously to RS data acquisition. For other kinds of applications, it is possible to perform standard or simplified data corrections, i.e. by calculating so called apparent reflectance (described below). In the following sections we introduce the basic components of our pre-processing chain, i.e. radiometric, geometric and atmospheric corrections of airborne hyperspectral data and the related software tools and packages. In the Figure 1 are displayed spectral characteristics of both sensors after radiometric and atmospheric correction.
2.1 Radiometric correction
Radiometric corrections are performed by means of calibration parameters. Parameters are regularly obtained in CzechGlobe spectroscopic laboratory by procedure recommended by the sensor developer.
2.2 Atmospheric correction
Atmospheric correction is applied in order to remove the effect of the atmosphere (i.e., absorption and scattering by atmospheric gases and aerosols) and to convert at-sensor radiance values into at-surface reflectance. Atmospheric corrections are necessary in order to maintain the comparability of hyperspectral datasets acquired by different sensors, in different time and place. Several approaches of atmospheric correction can be employed.
2.2.1 Radiative transfer models: The most common and standard approach of atmospheric corrections is based on atmospheric radiative transfer models, e.g. MODTRAN or 6S. In our pre-processing chain we use the ATCOR-4 (Richter, 2007) software package for atmospheric corrections, which is based on the MODTRAN5 (Berk, et al., 2008) atmospheric model. Besides the atmospheric correction, ATCOR-4 offers additional corrections of hyperspectral data, such as nadir normalization and BRDF correction. For proper parameterization of the MODTRAN5 radiative transfer model it is necessary to estimate some atmospheric parameters. The atmospheric parameters can be either derived from hyperspectral data itself or measured in-situ. The main advantage of this approach is that it is a universal and robust method, independent of field measurements. The limiting factor of this approach is imperfect knowledge of atmospheric parameters.
2.2.2 Empirical method: In empirical methods of atmospheric correction, the acquired image spectra are forced to match the in-situ measured reflectance spectra of the reference targets. Most commonly, a simple linear regression is calculated between the image and in-situ spectra. At least one reference target is required to perform an empirical correction, however, more reference targets will increase the accuracy of corrections. The great advantage of this method is that it is simple and fast and it produces accurate solutions for an area close to reference target. The major disadvantage is that field measurements are needed.
2.2.3 Apparent reflectance: This approach is suitable for those RS applications, where the quality of RS data in not the highest priority. In this approach, an apparent at-sensor reflectance is calculated. It means that atmospheric effects caused by the atmosphere between the aircraft and the ground remain uncorrected. At-sensor apparent reflectance is calculated by dividing at-sensor radiance by incoming downwelling irradiance at the sensor level. The downwelling irradiance is measured by a hemispherical irradiance sensor mounted on the top of an airplane and the irradiance data are recorded simultaneously with the image data. This method is useful for mapping large or distant areas without proper knowledge of atmospheric parameters.
Figure 1. Example of spectral characteristics of CASI-SASI sensors after radiometric and atmospheric correction. The International Archives of the Photogrammetry, Remote Sensing and Spatial Information Sciences, Volume XLI-B1, 2016
XXIII ISPRS Congress, 12–19 July 2016, Prague, Czech Republic
This contribution has been peer-reviewed.
3. THERMAL DATA PRE-PROCESSING CHAIN
3.1 Radiometric correction
Radiometric corrections of measured data are performed using the program RadCorr Ver. 5.2.11.2. (Itres Ltd) and laboratory determined calibration parameters. Values of final image data are given in radiometric units, i.e. in [μW cm-2
sr-1 nm-1]. Processed TASI data contain 22 spectral bands.
3.2 Atmospheric correction
Radiation measured by the sensor (Lm) is composed of radiation emitted by the surface, ε B(Ts), reflected incoming radiation from the atmosphere, (1 - ε) L↓atm, and direct radiation of the atmosphere, L↑atm. These components can be written as the equation of radiative transfer:
Lm= τ ε B(Ts) + τ (1 - ε) L↓atm + L↑atm,
where τ is the transmittance of the atmosphere, ε is emissivity of the material, B(Ts) is the radiation of black body at a temperature Ts, L↓atm is incoming radiation from the atmosphere and L↑atm is the radiation of the atmosphere only.
Variables L↓atm. L↑atm and τ are determined by means of radiative transfer model MODTRAN 5.3. Model input is the actual state of the atmosphere, determined by the use of MOD07_L2 product from MODIS satellite images. After incorporating of the variables in the equation of radiative transfer, we obtain the radiation escaping from the surface of the measured object:
LLL = ε B(Ts) + (1 - ε) L↓atm,
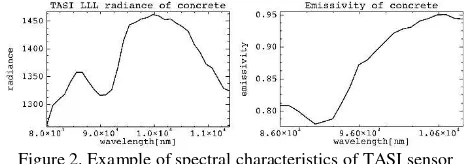
which is the sum of emitted and reflected radiation. Examples of LLL radiance and consequent emissivity of a surface is shown in the Figure 2.
Figure 2. Example of spectral characteristics of TASI sensor after corrections.
4. GEO-REFERENCING
Geo-referencing of our airborne hyperspectral data is performed in two successive steps, direct image geocoding and resampling to a selected coordinate system. Direct image geocoding consists of geometric corrections and orthogonalization of image data. Geometric corrections compensate for image geometric distortions caused by variations in flight path and attitude of the plane (recorded as roll, pitch and heading angles by IMU). Orthogonalization compensates distortion caused by sensor acquisition geometry and surface topography.
After the geocoding step the image data are resampled into a grid of a desired coordinate system. Currently the image data are mostly transformed into the UTM map projection.
For image geo-referencing we use the PARGE software (Schläpfer, 2006). Additionally, we also use other sensor-specific software such as CaliGeo for the AISA images and GeoCorr for the ITRES sensors. All software packages require
input data from the GNSS/IMU systems (i.e., geographic coordinates, altitude and attitude angles of a plane during the image acquisition) and a digital elevation/surface model (DEM/DSM) for image geo-referencing.
5. QUALITY ASSESMENT
It is recommended to verify the quality of the atmospheric correction by comparing at-surface reflectance to ground-measured spectra of selected homogenous, reference targets. Eventually, the measured reference spectra can be used for vicarious calibration. Quality of geo-referencing could be verified by means of Ground Control Points.
ACKNOWLEDGEMENTS
This work was supported by the Ministry of Education, Youth and Sports of CR within the National Sustainability Program I (NPU I), grant number LO1415 and CzeCOS infrastructure LM2015061.
REFERENCES
Acharya, P.K., Anderson, G.P., Berk, A. and Shettle, E.P., 2008. MODTRAN® 5.2. 0.0 USER’S MANUAL.
Goetz, A.F.H., 2009. Three decades of hyperspectral remote sensing of the Earth: A personal view. Remote Sensing of Environment, 113, S5-S16. Elsevier Inc. doi: 10.1016/j.rse.2007.12.014.
Kokaly, R.F., Asner, G.P., Ollinger, S.V., Martin, M.E., & Wessman, C.A., 2009. Characterizing canopy biochemistry from imaging spectroscopy and its application to ecosystem studies. Remote Sensing of Environment, 113, S78-S91
Richter, R., 2007. Atmospheric/Topographic Correction for Airborne Imagery, ATCOR-4 User Giude, Version 4.2, Deutsches Zentrum fuer Luft- und Raumfahrt e. V. (DLR) and ReSe Applications Schläpfer, pp. 125. (http://www.rese.ch/atcor/atcor4/)
Schläpfer, D., 2006. Parametric Geocoding, PARGE User Guide, Version 2.3. ReSe Applications Schläpfer & Remote Sensing Laboratories University of Zurich http://www.rese.ch/parge/ PDF/CDROM edition, Wil SG, pp. 195.
Schaepman, M.E., 2009. Imaging Spectrometers. In T.A. Warner, M. Duane Nellis & G.M. Foody (Eds.), The SAGE Handbook of Remote Sensing (pp. 166-178). London (UK): SAGE
The International Archives of the Photogrammetry, Remote Sensing and Spatial Information Sciences, Volume XLI-B1, 2016 XXIII ISPRS Congress, 12–19 July 2016, Prague, Czech Republic
This contribution has been peer-reviewed.