Original Paper
DEVELOPMENT OF DIGITAL MULTILAYER ECOLOGICAL
MODEL FOR PADANG COASTAL WATER (WEST SUMATRA)
A.Hartoko1 and M.Helmi2
1 Department of Fisheries - Faculty of Fisheries and Marine Sciences, Diponegoro University. 2
Waindo SpecTerra Indonesia
Received: 5 May, 2004 ; Accepted: 28 May, 2004
ABSTRACT
Coastal water ecology represents a significant gain with regard to regional and local economic, fisheries (including marine culture), tourism and other activities. Measuring their typical spatial distribution pattern, however, has proved challenging since the real coastal water parameters as a part of a whole ecosystem and their interactions has never been revealed so far.
A GPS guided sampling and in-situ measurement for the field data, digital and an image processing analysis were applied to insure that the simulated coastal water-ecology model was displayed with high levels of spatial, geodetic and real-data accuracy. The derived techniques could ultimately provide to coastal managers and decision makers with truthful ecologically and cost-effective means to assess the right zone for fisheries and other coastal water activities based on both temporal and spatial changes.
Keywords: spatial modeling, coastal water, ecology
Correspondence: [email protected], Telp. 024-7474698, 024-7460038, Fax. 024-7460039
I
NTRODUCTION
In the past few years in analyzing, making zonation and management plan of a coastal area, some investigator often decide the zones ‘by feeling’ or trial and error. This happens since we can not ‘see’ the real spatial distribution, structure, pattern and characters of the ecological parameters of the sea (physical, chemical as well as biological parameters as part of an ecosystem). The question is then, how should investigator decide what the desired information, where to decide the zone for marine culture, how to understand the spatial distribution of each parameter and how to analize interaction, etc. Usually, the choice is intuitive, and in some cases investigators use what happens to be
readily available. As a result, the entire decision on the zonation processes may not be obtained correctly.
M
ATERIALS AND
M
ETHODS
The study is a part of MCRMP (Marine and Coastal Resource Mapping Project) by Directorate General of Coastal and Small Islands – Ministry of Marine and Fisheries and was conducted at West Padang coastal waters from May to September 2004. Measurement of research parameters such as sea surface temperature, conductivity, pH, dissolved oxygen was carried in-situ using HORIBA Water Quality Checker, completed with a GPS station record (latitude and longitude). Phyto and zooplankton were collected using a 60 and 100 micron pore-size plankton net and 500 micron for larva. Research vessel of Marine Laboratory – Bung Hatta Univer-sity, Padang – West Sumatra was used during the study.
About 22 stations of field data and samples were collected. First step in building a digital layer for the ecosystem model was transferring ‘geodetic/ position data’ (degree; minute; second / D˚ M’ S” ) of latitude and longitude data into a single-numerical value with a formula of :
Numeric Value (Lat; Long ) = Degree + {minute + (second/60)}/60
Then the Y (latitude), X (longitude) and Z data (ecological parameters) was grided using Er_Mapper ver 6.4 software. The world geodetic system (WGS84) for geodetic datum and South-UTM47 for map projection was used in the digital mapping processes of the Landsat_ETM7 image. Single or three of ecological layer (using three band composite technique) can be displayed simultaneously. Grided layer of ecological parameters was then overlayed on the administrative-cropped satelite image of Padang.
Root-Mean-Square (RMS) method was used to measure the spatial-accuracy of digital layer. A pair-wise and multiple regression analysis was selected as the analysis method to answer several questions relating to the correlation among
digital layer of field data. Correlation coefficient (r) and beta values (or standardized partial regression coefficient) were used to assess the correlation important of each pair in the regression equation (Clark and Hosking, 1986).
and abiotic factors) – atmospheric interactions ware less studied so far.
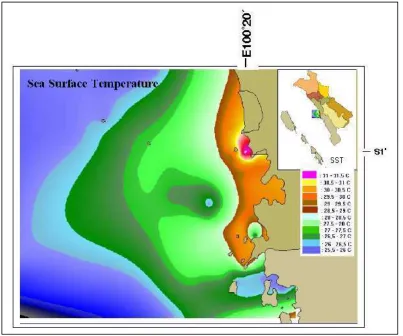
One of the ecological character of west Sumatra coastal water is that the coastal water is a part of a deep water ecosystem of Indian ocean. Figure 1 below is an example of spatial distribution of sea surface temperature (SST). Basically three major sea surface temperature level can be indicated, that is 25 - 26,5˚C/blue; 26,5 – 28,5˚C/ green and 28,5 - 31,5˚C /pink and indicated that higher SST near coast- line then gradually decreasing toward deeper zone. Although
some colder water enclaved in some bays (south part) can also be recognized.
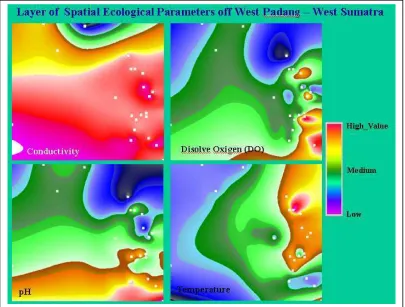
As in Figure 2, it is indicated spatial distribution and pattern of ecological parameter off west Padang coastal water, that is conductivity, dissolved oxygen (DO), pH and sea surface temperature (SST) with white dot represent the position of sample. These four of spatial layers suggest that even measured at the same coordinate this will gave totally different pattern of spatial distribution on each ecological parameter.
Fig. 1. Spatial distribution of sea surface temperature of West Coast of Padang
A pair-wise and multiple regression analysis among digital layer of field data (Figure 2) based on the value of r (correlation coefficient) value suggest that almost all parameters as a whole of
Table 1. Correlation Coefficient of Regression Models for Each Pair Ecological Factors
Ecological Factor : (r)
Conductivity x DO 0.83
DO x pH 0.63
pH x Temperature 0.79
Temperature x DO 0.87
Temperature x Conductivity 0.60
Furthermore, based on value of each corelation coefficient we can identify and understand that a pair of ecological parameters has a better than the others. Based on the r-value in Table 1, indicates that sea surface temperature has the best ecological correlation (r = 0.87) with dissolved oxygen (DO).
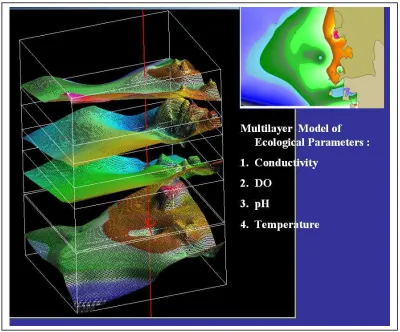
With the use of multi-layer on three dimensional basis we can explore more detail visual analysis as in Figure 3, that is the variation of one parameters in relationship to the other parameter simultaneously. We can take any point of samples on the spatial layer of the four parameters at any time.
Fig. 3 Visualization of multi-layer spatial-ecology model of West Coast of Padang
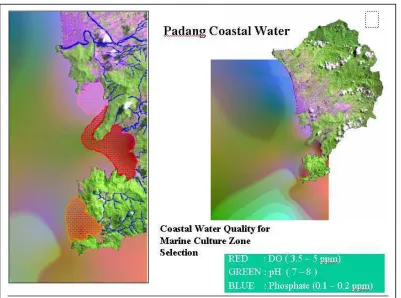
In order to support spatial analysis for zonation or site-selection for special purposes such as for marine-culture, we can use combinations of layer of culture supporting parameters. Such as dissolved oxygen (DO), pH – as ‘seawater stability indicators’ and nitrate or phosphate as nutritive indicator (Figure 4) using a three-band composite for ecological layer model. Where red-layer representing for DO, green-layer representing for pH and blue-layer representing for phosphate. It is
Fig. 4. Three-band composite layer model for marine culture site selection
Table 2. Value of Ecological Parameters and Criteria for Marine Culture
Ecological Parameter Good Moderate In-suficient
Dissolved Oxygen (ppm) Achmad,et.al, 1998 3 - 5 2 - 3 0,5 - 2
PH ;Chue vide Wardoyo,1982 7 - 8 5.5 - 7 2 – 5.5
Phosphate (ppm); Yoshimura vide Wardoyo,1982 0.1 – 0.2 0.05 – 0.1 0.01 – 0.05
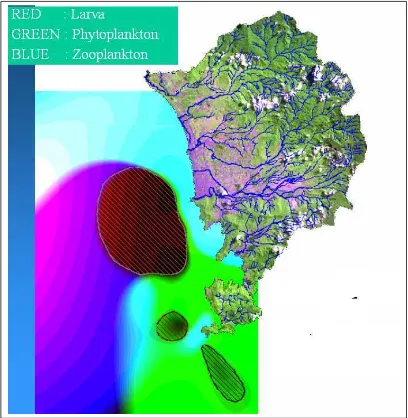
In order to detect or identify the biological character of coastal water based upon phytoplankton and zooplankton spatial layer to indicate the spatial distribution of ‘grazing-area’ and three-band composite layer of phytoplankton-zooplankton and larvae indicates the ‘feeding and spawning-area’ for conservation purposes as in Figure 5.
This suggests that the two form of ‘ecological and biotic composite’ spatial layer acts as spectral layer, in that no single
Fig. 5 Three-band biotic-composite layer off West Padang for ‘feeding and spawning-ground’
Such kind of research was land-based oriented only so far. Further analysis can be conducted with input of score and weighted algoritms, based on criteria for marine culture set by Ministry of Marine and Fisheries for more accurate zonation purposes. As a whole the approach of the method had been developed is dedicated for friendly use for researchers and students especially in tropical waters where variations of ecological parameters are very small.
C
ONCLUSIONS
Further research should explore the development and use of multi-layer method as a holistic approach for empirical guide in coastal resources zonation processes. Studies employing multitempo-ral data might take advantage of seasonal differentiation and specific spatial distribution pattern. Predictability of biotic factors that shows a strong seasonal variation, in particular larval and fish biomass may increase if regression equations incorporate spatial layers from seasonal function in the ecosystem.
A
CKNOWLEGEMENTS
The authors acknowledge the use of data and financial support of MCRMP – West Sumatra, Directorate General of Coastal and Small Islands, Ministry of Marine and Fisheries, especially Dr. Subandono, Mr. Sigit of BAPPEDA Province of West Sumatra, Dr. Arlius and Mr.Suparno of Fisheries Lab. Univ. of Bung Hatta, West Sumatra and the numerous field worker who made the data collection possible.
R
EFERENCES
Clark and Hosking, 1986. Statistical
Methods for Geographers. John
Willey and Sons, New York. 518p.
Crist and Cicone,1984. A
Physically-based Transformation of
Thematic Mapper Data – The TM Tasseled Cap, IEEE Transactions
on Geoscience and Remote
Sensing, 22 : 256 - 266
Danson F.M and P.J.Curran, 1993. Factors Affecting the Remotely Sensed Response of Coniferous Forest Plantations. Remote Sensing of Environments, 43: 55-65
Hartoko,A.2000. Pemetaan Terpadu Parameter Ekosistem Laut Dangkal dan Laut Dalam Data Satelit NOAA dan Landsat_TM. Thesis Doktor. ITB Bandung (unpublished)
Hartoko,A.J.Rais; S. Mira; N.R.Nganro, 2000a. Pemetaan Parameter Ekosistem Laut Dalam Utara Papua/Irja. Prosiding Konperensi Nasional II, Makasar.
Kauth R.J and G.S.Thomas, 1976. The Tasseled Cap – A Graphic Description of the Spectral-Temporal Development of Agricultural Crops as Seen by Landsat, Proceeding of the Machine Processing of Remotely Sesnsed Data Symposium, West Lafayete, Indiana, pp 41-51
Richardson,A.J and C.L.Weigand,1977. Distinguishing Vegetation from Soil Background Information. Photogrametric Engineering & Remote Sensing, 43: 1541-1552