Supplementary Material to
All-atom empirical force field for nucleic acids: 1)
Parameter optimization based on small molecule and
condensed phase macromolecular target data.
Nicolas Foloppe1 and Alexander D. MacKerell, Jr.*
Department of Pharmaceutical Sciences, School of Pharmacy, University of Maryland,
Baltimore, Maryland 21201
1) Present address
Center for Structural Biology Department of Bioscience Karolinska Institutet S-141 57, Huddinge Sweden
* To whom correspondence should be addressed.
Keywords: CHARMM, force field, molecular mechanics, empirical, molecular dynamics, DNA, RNA
Abbreviations: ABNR: adopted-basis Newton-Raphson; BSSE: basis-set superposition error; DNA: deoxyribonucleic acid; HF: Hartree-Fock; LJ: Lennard-Jones; MD: molecular dynamics; MP2: second order Møller-Plesset; NMR: nuclear magnetic resonance; NRAP:
Abstract.
Empirical force field calculations on biological molecules represent an effective method to obtain atomic detail information on the relationship of their structure to their function. Results from those calculations depend on the quality of the force field. In this manuscript, optimization of the CHARMM27 all-atom empirical force field for nucleic acids is presented together with the resulting parameters. The optimization procedure is based on the reproduction of small molecule target data from both experimental and quantum mechanical studies and condensed phase
1. Introduction
Empirical force field based computational studies are widely used methods for the investigation of a variety of properties of biological macromolecules.1,2 In combination with growing computational resources these methods allow for atomic detail simulations on
heterogeneous systems that may contain 100,000 or more atoms. In particular, force field-based techniques offer the ability to directly analyze the relationship of structure to energetics,
information that experimental approaches can only access indirectly.
Over the last several years force field techniques have played an increasingly important role in the study of nucleic acids. Empirical force field calculations are increasingly involved in the refinement of nucleic acid structures in conjunction with crystallographic3,4 or NMR data.5-7 Force field based techniques alone can enhance the interpretation of a wide variety of
biochemical and biophysical experimental data1,2 and provide insights which may be difficult or impossible to obtain from experiment. This may be particularly true with DNA, for which the use of experimental techniques has been plagued by a number of problems. Although X-ray crystallography has yielded a wealth of information about DNA,8-10 it is limited to the sequences that can crystallize and diffract to good resolution. Crystallization is obtained with non-physiological solvents and it is well documented that the observed crystal structures for a given deoxyribo-oligonucleotide may depend on the crystal packing, making it somewhat difficult to distinguish what is contributed by the intrinsic properties of the sequence and what is imposed by the crystal environment.11-14 NMR has become increasingly powerful in deriving deoxyribo-oligonucleotides structures in solution, however, the accuracy of the NMR-derived structures is elusive due to the lack of long range distance restraints.15,16 Consequently, details of the structure, dynamics and solvation of DNA in solution remain poorly characterized, making this a particularly interesting area for the application of simulation methods. DNA is particularly amenable to computer simulations given that duplex DNA simulations can be initiated with DNA in one of its canonical forms,17 thereby avoiding the need for an experimentally
determined structure to initiate the calculations. In addition to DNA, computational studies of small oligonucleotides18 and of RNA19 represent active areas of research on nucleic acids.
DNA,26 with CHARMM2225 overstabilizing the A form of DNA20,28,29 and the AMBER9624 force field having sugar pucker and helical twist values not in agreement with canonical B values.30 Refinement of structures based on experimental data have also highlighted the need for more accurate nucleic acid force fields.4,7,31 Recently, a revised version of the AMBER96 nucleic acid force field (AMBER98)30 and a nucleic acid force field from Bristol-Myers Squibb (BMS) have been presented.32
These observations prompted the reoptimization of the CHARMM22 all-atom nucleic acid force field, the details of which are described here. This new all-atom force field for nucleic acids will be referred to as CHARMM27, based on the version of the program CHARMM33,34 with which it will initially be released. An important part of the development of CHARMM27 has been devoted to obtaining a force field which adequately represents the equilibrium between the A and B forms of DNA as well as the A form of RNA. This has been achieved by balancing the intrinsic energetic properties of a variety of model compounds with the overall
conformational properties of DNA and RNA. This strategy is physically more relevant, although significantly more demanding, than approaches where the parameters are adjusted either purely empirically, to reproduce only experimental condensed phase properties, or to only reproduce quantum mechanical (QM) data on model compounds. By simultaneously reproducing target data for both small model compounds and duplex DNA and RNA, a force field in which the proper combination of local contributions that yield condensed phased properties of DNA and RNA in agreement with experiment can be achieved.
Following the introduction, the parametrization approach used in the optimization of the CHARMM27 nucleic acid force field is described. Details of the calculations are included in the Methods Section which is followed by a Results and Discussion Section. Inclusion of the discussion with the results allows for emphasis on the actual implementation of the
parametrization approach to be discussed alongside the appropriate data. A concluding section reiterates a number of points of emphasis in the present parametrization work and discusses several issues associated with force field optimization. An accompanying manuscript applies the CHARMM27 parameters to MD simulations of DNA and RNA in solution.35
2. Parametrization Approach 2.1 Potential energy function
U(R) = + ++
+ + (1)
+
Equation 1 includes the bond length, b, the distance between atoms separated by two covalent bonds (1,3 distance), S, the valence angle, , the dihedral or torsion angle, , the improper angle, , and the distance between atoms i and j, rij. Parameters, the terms being optimized in the present work, include the bond force constant and equilibrium distance, Kb and b0, respectively, the Urey-Bradley force constant and equilibrium distance, KUB and S, respectively, the valence angle force constant and equilibrium angle, K, and 0, respectively, the dihedral force constant, multiplicity and phase angle, K, n and , respectively, and the improper force constant and equilibrium improper angle, K and 0, respectively. These terms are referred to as the internal parameters. Also optimized were the nonbonded or interaction parameters between atoms i and j including the partial atomic charges, qi, and the Lennard-Jones (LJ) well-depth, ij, and
minimum interaction radius, Rmin, ij, used to treat the van der Waals (VDW) interactions. Typically, i and Rmin, i are obtained for individual atom types and then combined to yield ij and Rmin, ij for the interacting atoms via combining rules. In CHARMM ij values are obtained via the geometric mean (ij = sqrt(i * j) and Rmin, ij via the arithmetic mean, Rmin, ij = (Rmin, i + Rmin, j)/2. The dielectric constant, e, is set to one in all calculations, corresponding to the permittivity of vacuum.
2.2 Parameter Optimization Strategy
with this additional data the presence of parameter correlation cannot be entirely eliminated. Thus, the approach used for the parameter optimization, as well as the reproduction of a selected set of target data by the parameters, can influence the quality of the force field.
The present parameter optimization study represents an extensive revision of the
previously published CHARMM22 all-atom empirical force field parameters for nucleic acids.25 Presented in Figure 1 is a flow diagram of the parameter optimization procedure. Loops I, II and III in Figure 1 were included in the optimization of the CHARMM22 force field for nucleic acids, with loop IV representing an extension of that approach included in the CHARMM27 optimization.
In the CHARMM22 nucleic acid parameter optimization a variety of model compounds were selected with target data collected on those compounds. This target data included both experimental and ab initio data and solely acted as the basis for the parameter optimization. Empirical force field calculations were performed on the model compounds with the computed properties compared with the target data. The parameters were then manually adjusted to better reproduce the target data. Part of this process involved iterative procedures where, upon
changing one class of parameters, a set of previously optimized parameters were readjusted if necessary (loops I, II and III in Figure 1). For example, a set of partial atomic charges would be assigned to a model compound following which dihedral parameters would be adjusted to reproduce a target potential energy surface for that model compound. The partial atomic charges would then be reinvestigated due to possible changes in geometry associated with optimization of the dihedral parameters that could effect the reproduction of the target data for the charge optimization. This approach yields a parameter set that accurately reproduces a variety of internal (e.g. geometries, vibrational spectra, conformational energetics) and interaction (e.g. interactions with water, heats of sublimation) target data for the selected model compounds. Once the optimization procedure at the model compound level was complete the resultant parameters were then used to perform simulations of B and Z DNA in their crystal environments, both of which yielded satisfactory agreement with experiment. At this point the CHARMM22 parametrization was considered complete.
This approach relies on the reproduction of the small molecule target data by the force field also yielding satisfactory results on macromolecules in the condensed phase; analogous approaches have been used for the optimization of other force fields.24,38-40 With the
dynamics (MD) simulations that disagreed with experiment. Reoptimization of the protein backbone parameters to systematically deviate from the QM energetic data led to improved properties for the protein backbone. This additional procedure is represented by loop IV in Figure 1. The need for this additional loop may reflect limitations associated with the level of theory of the QM data as well as the simplified form of the potential energy function in equation 1, and emphasizes the importance of including macromolecular properties as part of the target data for the parameter optimization procedure.
For the present CHARMM27 parameter optimization study, the initial parameters
assigned to the model compounds were extracted directly from the CHARMM22 parameter set. The internal parameters were then optimized to reproduced geometries, vibrational spectra and conformational energetics for the model compounds, using an iterative approach to maximize the agreement with the internal target data (loop II in Figure 1). The partial atomic charges and LJ parameters were then iteratively adjusted using the new minimum energy geometries (loop I in Figure 1). Partial atomic charges were adjusted using a previously applied methodology.25,42 In this approach the target data for optimizing the charges on specific chemical groups are minimum interaction energies and geometries between a water molecule and these chemical groups in a variety of orientations obtained from QM calculations at the HF/6-31G* level of theory. Scaling of the interaction energies and offset of the minimum interaction distances are performed to obtain charges that yield satisfactory condensed phase properties.38,42-44 The offsets and scaling account for a number of factors including limitations in the QM level of theory and the omission of explicit electronic polarizability in the potential energy function, as previously discussed.41 The scaling factors and offsets mentioned above have been optimized specifically for the TIP3P water model.43,45 Accordingly, the CHARMM27 force field is designed to be used with the TIP3P water model. For the bases, base-base interaction energies and distances and dipole moments were also included in the charge optimization. LJ parameters of base atoms were optimized using water-model compound interactions along with crystal simulations with the crystal unitcell parameters and heats of sublimation being the target data. Using the converged interaction parameters, the internal target data for the model compounds were then rechecked and additional optimization of the parameters performed as required until both the internal and interaction parameters had converged (loop III of Figure 1).
deviations between the simulated and survey dihedral distributions, the dihedral parameters for, typically, one or two of the dihedrals were adjusted and the condensed phase simulations repeated. During the readjustment steps, comparisons with the small molecule energetic target data was always performed. This iterative loop in the CHARMM27 parameter optimization constitutes loop IV in Figure 1. During this loop, adjustment of the dihedral parameters was done to “soften” the small molecule energy surfaces (i.e. lower energy barriers) rather than moving the location of the minima in the energy surfaces and increasing energy barriers to restrict the condensed phase simulations to sample the dihedral distributions from the survey. This approach is designed to produce a force field sensitive to the environment rather than being dominated by the intrinsic conformational energetics of the nucleic acid molecule itself.
Optimization of the unique parameters associated with RNA was performed following completion of the DNA parameter adjustment.
2.3 Model compounds
Selection of adequate model compounds that are consistent with the ultimate application of the force field under development is essential for proper parameter optimization. The present model compounds were designed to include functional groups required to properly model the local nucleic acid environment, including the dihedrals indicated in Figure 2A, while being small enough to remain computationally tractable. To select the appropriate model compounds ab initio calculations were performed to investigate which compounds have structural and energetic properties consistent with experimental data.46-48 The model compounds selected from these studies are shown in Figure 2B. For the majority of these compounds MP2 level ab initio data is required to properly treat experimental structural and energetic properties. Accordingly, in the present work MP2 results are used as target data whenever feasible. Note that all the
compounds, excluding compound A, contain the furanose ring. This moiety was included to allow for dihedral parameter optimization to take into account contributions from changes in the furanose ring pucker, consistent with the north and south sugar puckers that occur in DNA, respectively. In addition, the complexity of these molecules required that only a subspace of the full conformational space be sampled. This subspace was selected to be relevant to that
occurring in DNA.48
Dimethylphosphate (DMP, compound A), was the primary model compound for
associated with and were also checked using compound D, which was designed to model the BI and BII states that occur in B DNA.9 The glycosyl linkage, , was modeled with compound E with the four DNA bases. This compound explicitly treats all the atoms that are included in the dihedrals describing (e.g. the O4’-C1’-N9-C4, O4’-C1’-N9-C8, C1’-N9-C4 and, C2’-C1’-N9-C8 dihedrals for the purines). Optimization of the parameters to model the sugar puckering was performed using compounds F and G. Compound F was used to check the influence of a phosphate group on sugar pucker. With compound F a dianionic phosphate was used to avoid problems with the proton on a monoanionic phosphate. Compound G is a nucleoside and was studied with the standard nucleic acid bases along with imidazole as the base. QM studies have shown compound G with imidazole to have conformational properties that are consistent with a variety of experimental data.46 Both the deoxy and ribo forms of compounds C, F and G were included; the ribo forms were used to optimize parameters associated with the C2’ hydroxyl group and the furanose parameters in RNA.
2.4 Macromolecular Target Data
As discussed in section 2.2 the present work also used macromolecular structural
information as the target data. To do this DNA and RNA duplexes were selected for condensed phased simulations and are listed in Table 1. Since emphasis was placed on the DNA portion of the force field due to the sensitivity of DNA structure to environmental effects, base sequence and base composition,17 five DNA structures were selected as target data. Two crystal structures were selected for simulations in the explicit crystal environment. The B form CGATCGATCG decamer was chosen due to its high resolution and presence of several
phosphodiester linkages in the BII conformation and the A form GTACGTAC octamer because of the relatively high content of AT basepairs in contrast to the majority of A form DNA crystal structures. During each parameter optimization cycle, the two crystals were subjected to MD simulations from which probability distributions of the backbone and glycosyl dihedrals and of the sugar pseudorotation angles and amplitudes were obtained and compared to NDB crystal survey distributions. This information was then used to adjust selected parameters associated with dihedrals observed to deviate significantly from the target data. In addition to the crystals, three DNA sequences were selected for additional testing in solution (Table 1). The EcoRI recognition sequence is probably the most studied DNA oligomer, making its inclusion
optimization solution simulations were performed on these DNA sequences to check that the results from the B DNA crystal simulations were not adversely influencing the force field and that the parameters properly reproduced the equilibrium between the A and B forms of DNA associated with changes in water activity.17 For condensed phase simulations of RNA the UAAGGAGGUGAU dodecamer was used (Table 1). Only one RNA duplex was included as target data given the greater homogeneity of RNA duplex structures as compared to DNA.17 Details of the results from the solution simulations not included in the present manuscript are presented in the accompanying manuscript.35
3. Methods.
Nucleic acid atom names and torsional angles are defined as in Saenger17 and the same nomenclature is applied to the model compounds. The canonical A and B forms of the DNA are defined according to Arnott and Hukins54 and the sugar pseudorotation angle and amplitude have been determined following Altona and Sundaralingam, using the same reference state for P
= 0.0.55
All empirical calculations were carried out with the CHARMM program33,34 using a dielectric constant of 1.0. The water model in all calculations was the CHARMM-modified TIP3P.43,45 Parameters for sodium are from Beglov and Roux56 and the magnesium parameters are based on reproduction of the experimental free energy of solvation (B. Roux, personal communication).
3.1 Vacuum model compound calculations
QM calculations were carried out with the GAUSSIAN 94 program,57 using the 6-31G* and 6-31+G* basis sets for neutral and negatively charges species, respectively. Torsional energy surfaces were performed at the Hartree-Fock (HF) level or with treatment of electron correlation via Møller-Plesset perturbation theory to the second order (MP2), as noted. QM energy minimizations were performed to the default tolerances in the GAUSSIAN program. Minimum interaction energies and geometries between model compounds and water were determined at the HF/6-31G* level by optimizing the interaction distance, and in some cases an interaction angle (Figure 3), with the intramolecular geometries constrained to the gas phase HF/6-31G* optimized structure for the model compound and the TIP3P geometry for water.45 The interaction energy was determined as the total energy of the supermolecular complex minus the sum of the monomer energies; no correction for basis set superposition error (BSSE) was included.
descent (SD) followed by 50 to 200 steps of adopted basis Newton-Raphson (ABNR) and 50 Newton-Raphson (NR) steps to a final energy gradient of ≤106 kcal/mol/Å. Energy surfaces were performed by harmonically constraining the selected dihedral with a force constant of 10,000 kcal/mol/degree2. Minimum interaction energies and geometries between model
compounds and water were determined by varying the interaction distance, and in some cases an interaction angle, with the intramolecular geometries constrained to the empirical gas phase optimized structure for the model compound or the TIP3P geometry for water.45 Interaction orientations were identical to those used in the QM calculations.
Sugar puckering surfaces were analyzed by dividing the pseudorotation space into four equally sized quadrants centered around P = 0.0, P = 90.0, P = 180.0 and P = 270.0, which are referred to as the north, east, south and west quadrants, respectively. Pseudorotation potential energy surfaces were obtained by individually constraining one of the five furanose endocyclic dihedrals to values ranging from -40 to 40˚ in increments of 10˚ and allowing the remainder of the system to optimize. Pseudorotation angles were then calculated from the final optimized structures. The use of a single torsional constraint to enforce the pseudorotation angle was performed to allow for the amplitude of the ring to vary during the optimization. To obtain the north and south minimum structures the sugars were initially constrained to the C3’endo and C2’endo puckers, respectively, and optimized following which the constraints were removed and full optimization performed. The east barrier (P = 90.0, O4’endo) was obtained by constraining the C1'-C2'-C3'-C4' dihedral to 0.0withthe furanose initially in the O4’ conformation and optimizing the remainder of the structure. Constraints on the remaining degrees of freedom in the model compounds were applied as described in the following paragraph. In all cases an initial minimization in the presence of the constraints was followed by a minimization in the absence of the dihedral constraints, with only the appropriate sugar constraint maintained.
Optimizations were performed by initially minimizing with the dihedrals , , and C3’-C2’-O2’-H constrained to values of t, g+, t, anti and 0.0˚, respectively, followed by removal of those
constraints and completion of the minimization. In all cases identical constraints were used for both the QM and empirical calculations.
3.2 Condensed phase simulations
Production MD simulations in the condensed phases were performed in the NPT
ensemble58 at 300 K with a time step of 0.002 ps and the Leap-Frog Integrator. All calculations were performed using SHAKE59 to constrain covalent bonds involving hydrogens and images were generated using the CRYSTAL module60 in CHARMM. Electrostatic interactions were treated via either atom truncation or the Ewald method.61 Atom truncation was performed by using the force shift and force switch methods to smooth the electrostatic and LJ terms, respectively.62 Nonbond pair lists were maintained to 14 Å, nonbond interactions were truncated at 12 Å and the LJ switching function was initiated at 10 Å. Nonbond lists were updated heuristically. Particle Mesh Ewald (PME)63 calculations were performed using the specified real space cutoffs with the LJ interactions truncated at the same distance. The fast Fourier transform grid densities were set to approximately 1 Å-1. The screening parameter was
determined for each system by using a 6th order smoothing spline and varying the screening parameter (kappa) from 0.20 to 0.50 and selecting the value at which the change in the energy as a function of kappa went to zero. In all cases the value of kappa was in the range of 0.28 to 0.35. RMS differences (RMSD) values relative to the experimental starting structures were determined following least-squares fitting of the specified non-hydrogen atoms.
Small molecule crystal calculations were performed with the full unitcells as the primary atoms with the symmetry of the unitcells maintained (e.g. for monoclinic systems the and angles were constrained to 90˚ while all other unitcell parameters were allowed to relax). These calculations were initiated by minimizing the entire system for 100 ABNR steps, followed by a 5 ps MD equilibration period and a MD production simulation of 50 ps. Averages and RMS fluctuations were obtained over the final 50 ps. For determination of the heats of sublimation, Hsub, gas phase simulations of uracil and 9-methylthymine were required. These calculations were performed in an identical fashion to the crystal simulations, except that the temperature control was performed using the Nosé algorithm.64 Vacuum simulations to obtain the gas phase energy required for determination of Hsub from the PME simulations were performed by including all possible nonbond atom pairs.
one nucleic acid duplex as the primary atoms. Hydrogen atoms were added to the crystal
structures using the HBUILD module65 of CHARMM and then subjected to a 50 SD step energy minimization with the non-hydrogen atoms fixed. Next, an appropriate amount of solvent was added to fill vacuum spaces in the crystal by generating the primary and image atoms (including DNA, water and counterions identified in the X-ray structure) and overlaying them with a waterbox of the same dimensions as the asymmetric unit(s). Added water molecules whose oxygen atoms were within 1.8 Å of any of the X-ray determined primary or image non-hydrogen atoms were then removed. The water deletion distance of 1.8 Å was determined by applying different values for the removal of waters, generating the starting configurations, minimizing and running 100 ps NVT simulations with the DNA constrained. The distance at which the pressure was close to 0 ATM was selected for the final system preparation. When the counterions identified in the experimental crystal structure were not adequate to neutralize the system, additional ions were added at random positions in the asymmetric unit(s). All water molecules and counterions were then energy minimized for 100 SD steps keeping the nucleic acid atoms fixed. This was followed by a 20 ps MD simulation in the NVT ensemble, with the nucleic acid atoms fixed. Following equilibration of the solvent, all atoms were subjected to a MD
simulation in the NPT ensemble. The majority of crystal simulations were performed for 500 ps with analysis performed over the final 100 ps. With the final parameters set, the final structure from the 500 ps simulation was used to initiate three 250 ps simulations that only differed by the random number seed used to assign the initial velocities to the atoms. The final 200 ps of each of these simulations were pooled and used for analysis.
The simulation of the Z DNA CGCGCG crystal was initiated from a previously
equilibrated system that contains 106 water molecules, two sodium and four magnesium ions, as described elsewhere.66 Calculations were performed using PME with a real space truncation distance of 10 Å with the MD simulations run at 288K, corresponding to the experimental regimen. Prior to the 1 ns production simulation the system was subjected to a 200 step ABNR minimization with harmonic constraints of 2.0 kcal/mol/Å2 on all non-hydrogen atoms, a 100 ps
NVT simulation with harmonic constraints 5.0 kcal/mol/Å2 on all DNA non-hydrogen atoms and
a 200 step ABNR minimization of the entire system.
Distributions of the dihedral angles and sugar pseudorotation angles in oligonucleotide crystal structures were obtained from the NDB10 as of March 98. DNA structures containing non-standard DNA components, bound drugs or proteins were excluded. The distributions are presented as probability distributions by sorting the data into 2 bins and were obtained
4. Results and Discussion
Presentation of the results and discussion will be performed consistent with the flow diagram in Figure 1 and based on the terms in equation 1. The subsections will be separated into different portions associated with different model compounds. Except when noted, the presented results are for the converged parameters. The final parameters are included in the Appendix of the Supporting Information and may be obtained from the World Wide Web at
www.pharmacy.ab.umd.edu/~alex/research.html.
4.1 Interaction terms
Optimization of the interaction terms involved refinement of the partial atomic charges for the ether oxygen in the furanose, the phosphate and the bases. Charges for the hydroxyl groups and the alkanes were consistent with the CHARMM22 set. For the LJ terms, new alkane parameters where used for the aliphatic groups67 and LJ parameters for some of the atom types in the bases were optimized as part of the present study. The remaining terms are from
CHARMM22. In the present discussion the terms interaction and nonbonded are used synonymously, referring to the partial atomic charges and LJ parameters. As emphasized by loop II in Figure 1 the interaction terms are influenced by the final values of the internal parameters.
4.1a Sugar and phosphodiester linkage
Partial atomic charges pertaining to the furanose moiety have been optimized using tetrahydrofuran (THF, complex A, Figure 3). 2'-hydroxy-tetrahydrofuran (THFOH, complex B, Figure 3) was used to test the charges of a hydroxyl group substituting the furanose at positions corresponding to the 2' or 3' carbons in nucleic acids. The hydroxyl charges were originally based on methanol and previously used directly without being assessed in the chemical context of the sugar. With THFOH, interactions with three orientations of the hydroxyl group were investigated. In all three cases the water plane was in the same plane as the C-O-H atoms. Comparison of the ab initio and empirical data in Table 2 shows the agreement to be satisfactory for both THF and THFOH. The minimum interaction energies were in good agreement with the scaled ab initio energies, while the minimum distances are all approximately 0.2 Å less than the
Interactions between DMP and water (Figure 3, Complex C) in the CHARMM22 force field had those with the anionic oxygens too favorable (interactions 2, 3 and 4) and the
interaction with the ester oxygen too unfavorable (interaction 1). To compensate for this
imbalance the charges were reoptimized yielding the interaction energies and geometries shown in Table 2. While the interaction with the ester oxygen (C.1 in Table 2) is still slightly too unfavorable and one of the interactions with the two anionic oxygens is slightly too favorable (C.3 in Table 2) the overall balance represents an improvement over CHARMM22. Obtaining this improvement required moving -0.02 e.u. from the anionic oxygens to the ester oxygens.
4.1b Bases
Recent high level ab initio data on Watson-Crick and Hoogsteen basepairing as well as other hydrogen-bonded basepairs and base stacking interactions have greatly increased the amount of target data available for charge optimization of the bases.68-72 Results from some of these studies indicated limitations in the CHARMM22 nonbonded parameters.69,71 These works stimulated the reoptimization of both the partial atomic charges and LJ parameters for the bases.
In addition to base-water interactions (see Figure 3 and Table 3), target data for optimization of the base charges included interaction energies for a variety of basepairs (see Table 4 and reference71) and dipole moments. Optimization of the LJ parameters was based on the reproduction of the heats of sublimation of the uracil and 9-methyladenine crystals along with interactions between water and aromatic base hydrogens. For example, Rmin on the
aromatic hydrogens was decreased from the value of 1.3582 Å used for benzene73 to 1.10 Å. In the present work the flexibility in the base charges was increased by defining the unit charge group to encompass the entire base. This contrasts the CHARMM22 charges where unit charge groups of 7 atoms or less were used.
smaller radius on the aromatic base hydrogens, as well as on imidazole, appears to be due to the carbon covalently bound to the hydrogen always being directly adjacent to one or two nitrogen atom in the rings, yielding a more polar character as compared to standard aromatic C-H groups.
An overall comparison of the present CHARMM27 and the CHARMM22 base to water interactions is presented in Table 3, where the average differences, RMSD, and average absolute errors for the water-base interactions are reported. In all cases the CHARMM27 values are better than for CHARMM22, with the improvement being significant in all cases except adenine. This improvement is due to the use of larger unit charge groups and the new Rmin value for the aromatic hydrogens.
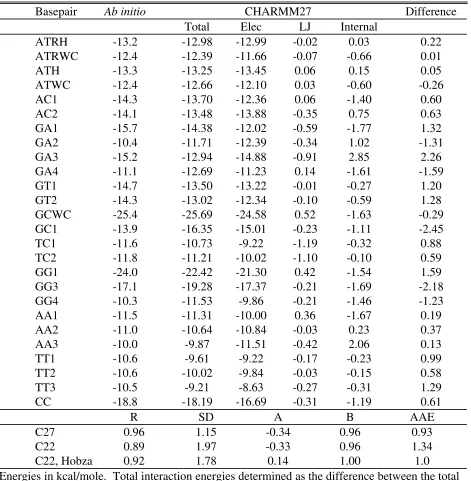
Optimization of the base parameters also included the Watson-Crick and Hoogsteen basepair interactions along with the remaining base dimers defined by Hobza et al.71 Presented in Tables 4 are the MP2/6-31G* BSSE corrected data along with their CHARMM27
counterparts. In addition to the total empirical interaction energies are the electrostatic, LJ and internal strain contributions to the basepairing interaction. In several instances the LJ and internal strain terms make significant contributions to the overall interaction energy. These contributions emphasize the need for proper treatment of the LJ and internal parameters to obtain a properly balanced force field. Comparison of the ab initio and CHARMM27 values in Table 4 show the agreement to generally be good, although with some differences. The largest
differences occur with the GA3, GC1 and GG3 pairs. The GG3 interaction in CHARMM22 was reported to differ by -7.2 kcal/mol from the ab initio data; calculations in our laboratory yielded a difference of -6.5 kcal/mol. This difference is -2.2 kcal/mol in CHARMM27, a significant improvement. On the other hand, the GC1 interaction for CHARMM22 was reported to have a difference of -1.2 kcal/mol 1.7 kcal/mol in our laboratory) which is worse with CHARMM27 (-2.5 kcal/mol).
To judge the overall improvement in CHARMM27 the data in Table 4 were subjected to linear regression analysis along with determination of the standard deviation and average absolute error, as previously performed.71 These results are shown at the bottom of Table 4 along with the CHARMM22 values. Two sets of CHARMM22 values are reported based on calculations in the present study and values reported in Hobza et al.71 Comparison of the CHARMM27 and CHARMM22 data show the new force field to be equivalent to or in better agreement with the ab initio data. This improvement indicates the CHARMM27 base charges and LJ parameters to yield a more balanced representation of the different types of hydrogen bonded base-pair dimers.
results include both gas phase dipole moments and those calculated in the presence of water using the AM1-SM274 and SCIPCM75 reaction field models. The ordering of the CHARMM27 dipole moments is in good agreement with the QM data, with the only exception being the order of thymine and uracil. The CHARMM27 dipole moments are systematically larger than the gas phase QM values. This is required due to the omission of explicit electronic polarizability from the potential energy function (equation 1). Such an overestimation represents a mean field polarization of the bases by the surrounding condensed phase environment, an approach that is common in empirical force fields designed for the condensed phase, as discussed previously.41 To better gauge the extent of the overestimation, dipole moments were determined for the bases in water using two QM reaction field models. The reaction field dipole moments are all larger that the CHARMM27 values, suggesting that the extent of the overestimation of the base dipoles in the force field is reasonable. Better quantitation of the relevance of the dipole moments from the reaction field models with respect to force field models will require additional studies.
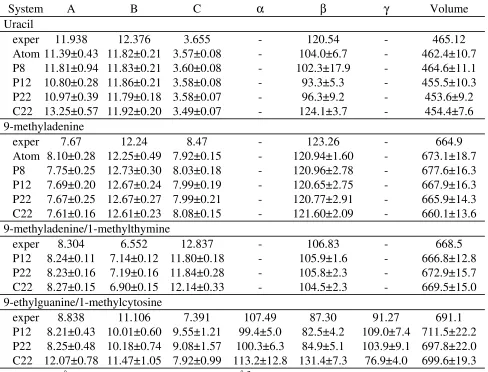
Optimization of the LJ parameters for the base ring carbon atoms was performed using crystal calculations of the systems listed in Table 6. For uracil and 9-methyladenine the Hsub values have been experimentally determined.76 1-methylthymine, for which both the crystal structure and heats of sublimation are known, was not included due to problems with a
pseudosymmetry axis in the molecule, as previously discussed.25 Presented in Table 7 are the experimental and calculated unitcell parameters for the four crystals. Note that the calculations were performed with the full unitcell as the primary atoms, versus the use of the asymmetric unit in the CHARMM22 parametrization. Stereodiagrams of all the small molecule crystals may be seen in Figure 4 of MacKerell et al.25 In the present calculations both atom-based truncation and PME methods were used for the treatment of the electrostatic interactions. The PME method was applied with three real space cutoff distances. This was performed due to the necessity of truncating the LJ terms at the same distance as the real space cutoff. That truncation eliminates possible favorable long-range dispersion effects that could impact the calculated crystal
experiment. Significant differences occur in the and angles as well as the three unitcell lengths. The lack of experimental crystals of the individual molecules in the 9-ethylguanine/1-methylcytosine crystal makes systematic analysis of the cause of the differences difficult. Table 7 also includes results from the CHARMM22 force field showing CHARMM27 to generally yield a better representation of the crystals than CHARMM22, although exceptions exist.
Heats of sublimation for the uracil and 9-methyladenine crystals offers additional target data for optimization of the LJ parameters. Table 8 includes CHARMM27 Hsub values for the two crystals for different treatments of the nonbond interactions along with CHARMM22 and experimental data. For uracil CHARMM27 overestimates Hsub by two or more kcal/mol. Of note is the increase in Hsub in the PME versus atom-truncation calculations and as the
truncation distance in the PME calculations is increased. The increase in Hsub with the increased truncation distance is attributable to the dispersion portion of the LJ term and is consistent with the decrease in the unitcell volume in Table 7. With 9-methyladenine the agreement between experiment and calculations is improved as compared to uracil, with the CHARMM27 values bracketing experiment. For both uracil and 9-methyladenine the CHARMM22 values are significantly larger than both the experimental and CHARMM27 values. The improved agreement between experiment and CHARMM27 concerning both the unitcell parameters and Hsub as compared to CHARMM22 emphasizes the improvements in the new force field.
Differences in the CHARMM27 unitcell parameters and Hsub with respect to
experiment indicate that further improvements in the force field, possibly including extension of the form of the potential energy function, are needed. For example, Hsub for 9-methyladenine is in good agreement with experiment, however, the calculated unitcell parameters are in poorer agreement, suggesting that the ideal balance of structure and energetics has still not been
reached.
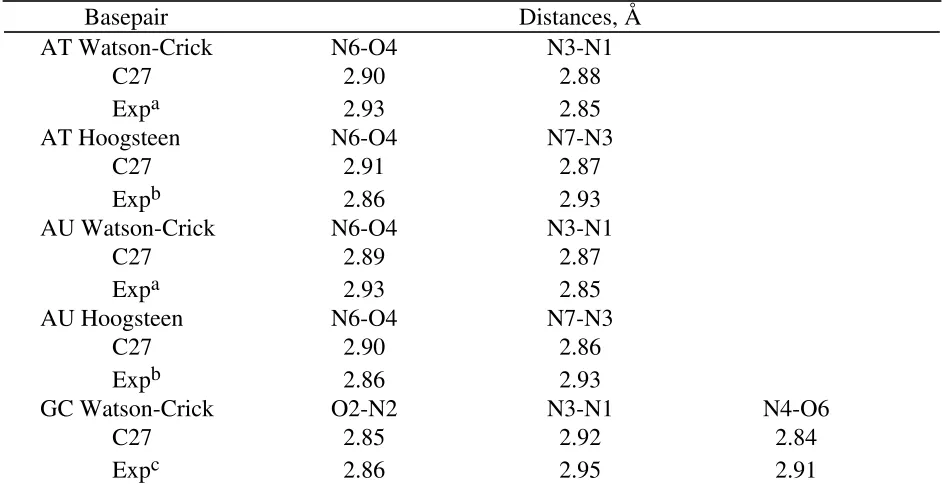
Additional tests of the base parameters involved calculation of the interaction geometries and enthalpies of the Watson-Crick and Hoogsteen basepairs and base stacking interaction energies. Table 9 contains CHARMM27 basepair interaction energies, enthalpies and vibrational contributions, along with the corresponding data from experiment and ab initio
experiment, both of which fall in the range of the ab initio results. For the AT and AU pairs the empirical values are significantly less favorable than the experimental values, while they fall into the range of the ab initio results. Recently, a corrected experimental value of 12.1 kcal/mol for the AT basepair was reported that takes into account the different conformations accessible to the AT basepair.69 Comparison of the AT Watson-Crick and Hoogsteen pairs shows CHARMM27 to reproduce the ab initio trend with the AT Hoogsteen pair having an interaction enthalpy -0.38 kcal/mol more favorable than the Watson-Crick basepair. CHARMM27 also calculates the AU basepairs to have an interaction enthalpy more favorable than the AT pairs. This result is consistent with the experimental data, though the magnitude of the calculated differences is smaller. No high level ab initio calculations on the AU basepair are available. The necessity for such calculations is obvious from the different experimental interaction enthalpies of the AT and AU basepairs.
Hydrogen bond distances for the Watson-Crick and Hoogsteen basepairs are presented in Table 10, along with experimental data from crystal structures. The agreement overall is good with the largest difference of 0.07 Å occurring with the N4-O6 distance in GC. While
comparison of the distances with data from single crystals is limited, the quality of the agreement further indicate that the present parameters are adequately treating the hydrogen bonding
interactions.
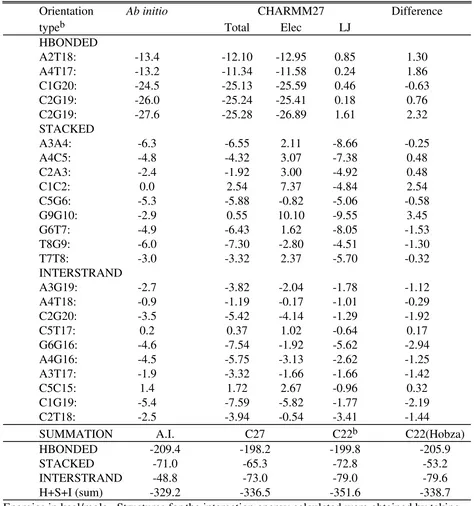
Base-base stacking interactions make a significant contribution to the stability of DNA and RNA oligonucleotides.17,77 Such interactions must be properly treated for successful simulations of DNA and RNA duplexes. Proper treatment of the stacking interactions must include a balance with hydrogen bonded interactions between the bases. Several ab initio studies of base stacking interactions have been performed.68,71,72 Of these, the work of Hobza et al.71 is the most readily reproducable due to the use of the crystal structure of the CCAACGTTGG decamer78 to define the relative orientations of the bases. Their ab initio data, at the MP2/6-31G* (BSSE corrected) level are presented in Table 11 for selected Watson-Crick pairs (HBONDED), STACKED pairs and INTERSTRAND (non WC) interacting pairs along with results from CHARMM27, including the electrostatic and LJ contributions. At the bottom of Table 11 is a summation of the different types of interacting pairs required to compare the relative energetics of the different interaction orientations. Those data include results from CHARMM22 performed as part of the present study and as reported by Hobza et al.71
Comparison of the ab initio and CHARMM27 data show the trends for the different interacting pairs to be mimicked by the force field. Detailed analysis of the summations in Table 11 shows the CHARMM27 values for the HBONDED and STACKED pairs to reproduce the ab initio
results, while the CHARMM27 INTERSTRAND interactions are too favorable. In
dominates the STACKED interactions and there are varying contributions to the
INTERSTRAND interactions. The quality of the CHARMM27 agreement with HBONDED and STACKED ab initio interactions suggests that the balance between the electrostatic and LJ contributions to base-base interactions in the force field is satisfactory.
The poorer agreement of the INTERSTRAND interactions is difficult to understand. For pairs where the CHARMM27 interaction energies are significantly larger then the ab initio (i.e. C2G20, G6G16 and C1G19) the electrostatic term dominates in two cases (C2G20 and C1G19) and the LJ dominates in the other. In other cases (i.e. A4G16 and A3T17) the electrostatics and LJ contributions are approximately equal. Problems with the ab initio data must also be
considered. Limitations in the MP2/6-31G* level of theory with BSSE correction for the
treatment of dispersion interactions have been noted.68 Furthermore, the use of the counterpoise method to correct for BSSE may overestimate the correction, especially in the presence of a relatively limited basis set.79 Such effects could lead to different “correction errors” for the different types of orientations. For example, the extent of orbital overlap for the HBONDED pairs is expected to be minimal as compared to the STACKED pairs. Accordingly, the influence of BSSE correction is expected to be least in the HBONDED pairs and the largest in the
STACKED pairs. While these problems are beyond the scope of the present work they do indicate that additional studies are required to better quantitate stacking interactions between bases.
4.2 Internal parameters
Optimization of the internal parameters involved reproduction of geometric and vibrational target data for the sugar moiety, the phosphodiester backbone and the bases. With the phosphodiester backbone, the sugar moiety and the glycosyl linkage a considerable part of the effort involved adjustment of the dihedral parameters to simultaneously reproduce QM potential energy surfaces and probability distributions of those dihedrals in experimental crystal structures. This is represented as loop IV in Figure 1. To organize the presentation of the internal parameter optimization the results will be separated into a section describing the reproduction of the geometric and vibrational target data and a section describing the iterative optimization of selected dihedral parameters.
These additional atom types increase the number of parameters available for optimization, thereby allowing for improved agreement with the target data.
4.2a Reproduction of the geometric and vibrational target data
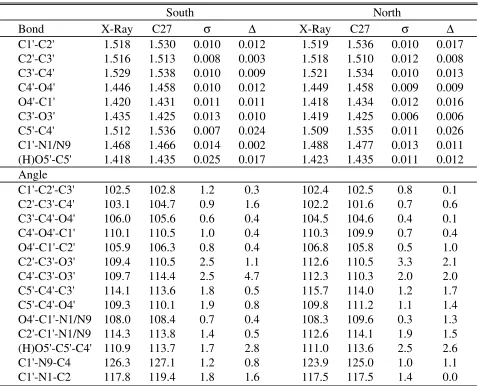
Sugar and phosphodiester backbone. Optimization of the deoxyribose and ribose bond lengths and valence angle parameters was performed based on target data from a statistical analysis of high precision crystal structures of nucleosides and nucleotides.80 Such data are ideal for the development of a force field for condensed phase simulations in that they contain condensed phase contributions averaged over a large number of compounds, thereby avoiding limitations in any single crystal structure associated with packing effects. In the study by Gelbin et al.80 the deoxy and ribo structures as well as the north and south conformations were analyzed separately allowing for explicit parametrization of these in the present study. To take into account the influence of base on the minimized structure a deoxy nucleoside (model compound G) was minimized with each of the four DNA bases. The same was done with the ribo
nucleosides. Reported values are the average over the four DNA or RNA nucleosides. Table 12 compares the individual CHARMM27 deoxyribose bond lengths to their experimental crystal counterparts. The average absolute difference between the crystal and CHARMM27 bond lengths is 0.011 Å in the north conformation and 0.013 Å in the south conformation, indicating that the empirical bond lengths are in reasonable agreement with their crystal references in both conformational ranges. The largest deviation between CHARMM27 and experiment is for the C5’-C4’ bond, due to the equilibrium bond length being directly transferred from the aliphatic groups. Of note is the quality of the agreement for the bonds involving the O4’ atom. Because the C1'-O4' and C4'-O4' bond lengths differ significantly in the survey data, the atom type CN7B was assigned to atom C1' to distinguish between these bonds in the force field. This allowed for optimization of the two bonds individually, yielding the quality of agreement in Table 12.
Table 12 also shows the deoxyribose valence angles, comparing the individual
substituents at this position in nucleosides and nucleotides. This variability and the reasonable agreement for the C4’-C3’-O3’ north angle and the C2’-C3’-O3’ north and south angles precluded further optimization of the parameters associated with this angle.
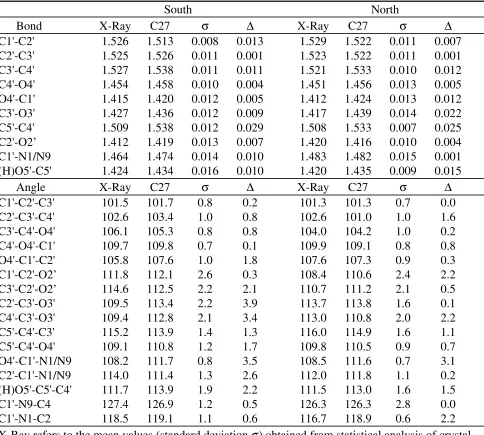
Results on the geometry of the ribose sugar are presented in Table 13. Average absolute differences between CHARMM27 and the crystal data for the bond lengths were 0.010 Å for both the south and north conformations. With the angles the average absolute differences were 1.6 and 1.0˚ for the south and north conformations, respectively. The largest differences in the ribose angles occurred with terms related to the glycosyl linkage. These were in good agreement for deoxyribose (see Table 12) due to the parameter optimization being first performed on the deoxyribose sugar. To correct this problem without sacrificing the quality of the deoxyribose agreement would require the inclusion of new atoms types for the ribose species. Since the overall quality of the ribose internal geometries was deemed satisfactory, such an addition was not made.
Bond, angle and dihedral force constants associated with the sugar moiety were initially obtained from the alkanes37 while those of the phosphodiester linkage were from CHARMM22. To optimize these force constants, vibrational spectra were calculated for the dianionic form of compound B, for compound F and a variation of Compound E with an imidazole base and a 5’ methyl group. While the size of these compounds disallows detailed analysis of the entire spectra, specific modes in the spectra can be identified and used for adjustment of the associated force constants. In particular, the torsional and deformation modes associated with the furanose ring and its exocyclic substituents were accessible. Based on these modes, angle force constants and some dihedral terms were optimized, although the final optimization of most of the dihedral parameters was based on the conformational energetics, as discussed below.
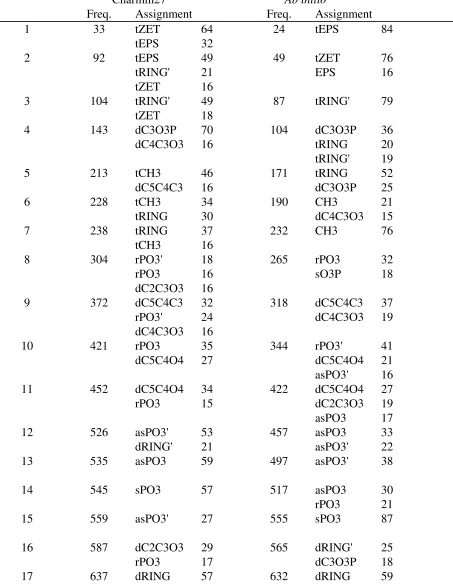
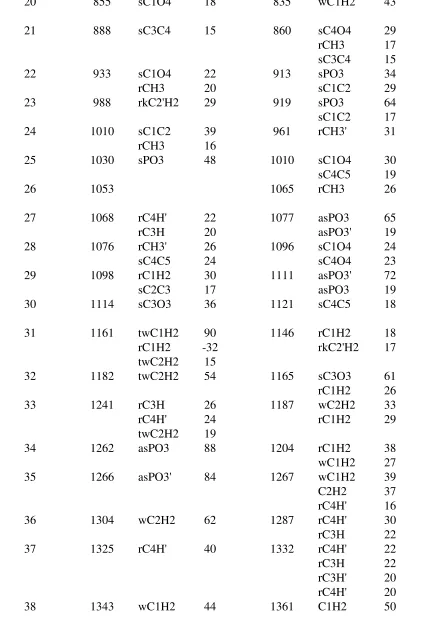
Presented in Tables 14, 15 and 16 are the CHARMM27 and QM determined vibrational spectra, including the potential energy distributions. The QM calculations were performed at the HF/6-31G* or HF/6-31+G* levels and the resultant frequencies scaled by 0.9.81 For compound F (Table 14) there is good agreement for the torsional modes associated with the and
dihedrals (modes 1 and 2). Torsional modes associated with the sugar moiety (tRING) make contributions to vibrations at 92, 104, 228 and 238 cm-1 in the CHARMM27 spectra which agree
well with the values of 87, 104 and 171 cm -1 from the QM calculation. With the sugar ring
deformations (dRING), the CHARMM27 values of 526 and 637 cm-1 are in satisfactory
agreement with the QM values of 565 and 632 cm-1. Other modes of note are dC2C3O3,
dC4C3O3 and dC3O3P, which are relevant to the backbone in nucleic acids. In CHARMM27, modes with contributions from dC2C3O3 or dC4C3O3 occur at 143, 304, 372 and 587 cm-1
CHARMM27 this mode occurs at 143 cm-1, between the QM values of 104 and 171 cm-1 for
modes 4 and 5.
Compound B includes the furanose moiety as well as the , and dihedrals. Table 15 shows the three lowest CHARMM27 modes (modes 1, 2 and 3), which are dominated by these terms, to be in good agreement with the QM data. Sugar furanose torsions (tRING) are again adequately represented by CHARMM27, where values of 97, 311 and 388 cm-1 (modes 4, 7 and
8) bracket the QM modes at 120, 148 and 206 cm-1. In Compound B the furanose ring
deformation frequencies are somewhat too low in the empirical model, with contributions at 584 and 594 cm-1 as compared to QM values of 677 and 813 cm-1, but, the satisfactory agreement of
these modes in Compounds F and the compound E analog (see next paragraph) precluded additional optimization of this term. Exocyclic terms of note include the dC5O5P mode at 218 cm-1 in CHARMM27 versus 189 cm-1 in the QM calculation, and the dC3C4C5 and dO4C4C5
deformation modes that make contributions at 311, 388, 446 and 497 cm-1 in CHARMM27 as
compared to QM values of 148, 321, and 382 cm-1. The final exocyclic mode of note in
compound B is the scC4C5O5 scissor mode at 248 cm-1 in CHARMM27, in reasonable
agreement with the QM value of 206 cm-1.
Compound E with an imidazole base and a 5’methyl group was designed to test the influence of a base on the vibrational properties of the empirical model. Analysis of Table 16 shows CHARMM27 to be in good agreement with the QM data for the four lowest modes. This quality of agreement indicates CHARMM27 to satisfactorily treat torsional degrees of freedom associated with the glycosyl linkage and the sugar (tRING) and wagging of the C1’ atom out of the plane of the imidazole moiety. Other modes associated with the glycosyl linkage are dO4C1ND1, dC2C1ND1 and the rocking of the imidazole ring (rC1ND1CG). Analysis of dO4C1ND1 and dC2C1ND1 in CHARMM27 shows only one contribution at 325 cm-1, which
falls in the range of the QM values at 214, 349 and 425 cm-1. The CHARMM27 imidazole
rocking mode occurs at 325 cm-1, higher than the value of 214 cm-1 from the QM calculations.
Finally, the sugar ring deformation modes from CHARMM27 (modes 11 and 13, 575 and 654 cm-1, respectively), are in good agreement with the QM values at 566 and 651 cm-1. Overall, the
present vibrational analysis shows CHARMM27 to satisfactorily represent distortions associated with the furanose moiety and its exocyclic substituents including a 3’phosphate, a 5’phosphate and a base.
Bases. A recent survey of the geometries of the nucleic acid bases82 motivated
amide in the protein backbone based on calculations on N-methylacetamide, however, the amide is planar when involved in hydrogen bond interactions.85 Based on those results it was assumed that the base amino groups would also be planar when involved in hydrogen bond interactions. This assumption was supported by ab initio calculations at the HF/6-31G* level on cytosine showing the presence of a single water hydrogen bonded to the N4 amino group to yield a planar structure (MacKerell, Jr., A.D. unpublished). Furthermore, in several ab initio studies involving hydrogen bonded nucleic acid base dimers planar geometries were obtained.69-71 Thus,
assuming that the base amino groups are always involved in some type of hydrogen bond, it is appropriate to treat the structures of the bases in the condensed phase as planar. Note that the force constants of the amino groups were adjusted to allow for significant deviations from planarity to occur (see below).
Table 17 includes bond and valence angle RMSD data between the empirical optimized structures and target data for the methylated bases. Data are included for the bond lengths and valence angles of non-hydrogen atoms from the survey82 and for angles involving hydrogens based on QM calculations. Individual values of the bond lengths and angles are presented in Tables 18 and 19. Data from CHARMM22 are included in Tables 17, 18 and 19 for comparison. For the non-hydrogen atoms the CHARMM27 geometries are in better agreement with the crystal survey data than is CHARMM22. This improvement is, in part, due to the CHARMM22 parameters being optimized to reproduce previous survey data.86 Empirical angles involving hydrogen atoms (H-angles) are in good agreement with respect to the selected HF/6-31G* data. The largest discrepancy with the H-angles occurs with guanine. This difference is associated with the nonplanar ab initio versus planar empirical structures of the amino group and also leads to the larger differences in adenine and cytosine as compared to uracil and thymine. Overall, the CHARMM27 internal geometries of the bases are in satisfactory agreement with the target data.
Optimization of the nucleic acid base force constants was performed via the reproduction of vibrational spectra. The amount of experimental and ab initio vibrational data on the bases is large (see MacKerell et al.,25 Ilich et al.,87 Colarusso et al.88 and Aamouche et al.89 ) and the situation is complicated by the role of environment on the molecular vibrations. The majority of experimental data for the bases is obtained in condensed phase environments while ab initio
Vibrational data for adenine are presented in Table 20. The lowest frequency modes are in good agreement concerning both the frequencies and assignments. These modes are
dominated by out-of-plane motions of the rings and their substituents. Such modes will make a significant contribution to distortion of the base occurring in MD simulations, making their correct representation critical for accurate results from MD studies. Discrepancies exist with the amino wagging and torsional modes. The amino torsional frequencies tend to be too high with empirical and ab initio frequencies occurring at 288 and 242 cm-1, respectively, while the wagging modes are too low (i.e. empirical mode 5 occurs at 345 cm-1 while ab initio mode 6 occurs 492 cm-1). Efforts to remedy these discrepancies via different combinations of dihedral and improper parameters were unsuccessful. In addition to the ring torsions at the lowest frequencies, empirical torsional modes for the 5-membered rings occur at 652 and 719 cm-1, which compare well with the ab initio values of 652 and 694 cm-1. Ring deformation modes are adequately reproduced with empirical values occurring at 468 and 531 cm-1 and ab initio modes at 512 and 518 cm-1. To allow for close examination of the ring stretching modes the individual bonds were treated explicitly, except for empirical modes 22, 28, 33, and 34 where the sum of the 5- and 6-membered stretches are presented due to no individual ring stretches contributing 15% or more to the potential energy distribution. In general, the empirical and ab initio ring stretching frequencies are in similar ranges and the agreement of certain modes is good. For example, modes that include the C5-C6 stretch occur at 559 and 602 cm-1 for the empirical and
ab initio data, respectively, C8-N9 stretching modes occur at 993 (empirical) and 1055 cm-1 (ab initio), and the C6-N1 stretching modes occur at 1469 (empirical) and 1489 cm-1 (ab initio).
Guanine is the largest of the bases and, accordingly, the most difficult to assign and fit to the ab initio target data. The empirical and ab initio data are presented in Table 21. As with adenine, the low frequencies are in satisfactory agreement; modes 2 and 3 are somewhat higher than the ab initio estimates and the out-of-plane wag of the amino group (gC2N) makes a significant contribution to mode 3 that is not seen in the ab initio data. This motion also contributes to empirical mode 15 at 673 cm-1, which is in reasonable agreement with ab initio
mode 17 at 736 cm-1. A similar phenomenon is observed with cytosine (see below).
Adjustment of the dihedral and improper parameters associated with these terms was not able to remove the gC2N contribution without significantly altering the higher frequency mode in the vicinity of 700 cm-1. As with adenine, the guanine ring stretches, deformations and torsions all occur in the same frequency regions for the empirical and ab initio data. For example, the C5-N7 stretch occurs at 1164 and 1154 cm-1 for the empirical and ab initio data, respectively. Good agreement is also observed for the amino group in-plane rocking and scissor modes. The
empirical NH2 rock occurs at 980 cm-1 (mode 23) which is somewhat lower than the ab initio
(35 and 36) of 1638 and 1671 cm-1 are slightly higher than the ab initio values at 1612 and 1658 cm-1. Overall, the empirical data is in satisfactory agreement with the ab initio data for the majority of the frequencies and assignments.
The simplified spectra of the pyrimidines, as compared to the purines, allowed for greater ease in interpretation of the spectra and optimization of the force constants. Results for cytosine, shown in Table 22, are in general quite good, though some of the problems present with the purines still occur. The out-of-plane wag of the amino group (gC4N) contributes to mode 2 in the empirical model but not in the ab initio data and the empirical amino group torsion modes are again overestimated (see mode 3), while the amino wags are underestimated (compare empirical mode 6 at 488 cm-1 with ab initio modes 6 and 8 at 519 and 532 cm-1, respectively). In the central region of the spectra the agreement of the ring stretches and deformations are generally good (e.g. the C4-C5 stretch at 739 and 749 cm-1 for the empirical and ab initio data,
respectively), although some significant differences are present (e.g. the C2-N3 stretch at 1572 cm-1 in the empirical model versus the value of 1249 cm-1 in the ab initio data).
The additional molecular simplification of uracil and thymine allowed for good agreement of both the frequencies and assignments, as shown in Tables 23 and 24. In both systems the lowest 10 empirical modes are in good agreement with the ab initio data. The only significant discrepancy is with mode 5 in uracil, assigned to a ring torsion in the empirical model and a ring deformation in the ab initio calculation. Also, modes 6 and 7 for uracil are reversed. In both uracil and thymine the empirical and ab initio in-plane (dC2O and dC4O) and out-of-plane wags (gC2O and gC4O) of the carbonyl groups are in good agreement. For example, the empirical C=O in-plane deformations for uracil occur at 375 cm-1 while the ab initio value is at 383 cm-1 and the empirical C=O wags at 712 and 783 cm-1 (modes 11 and 12) are in good agreement with ab initio values of 723 and 776 cm-1 (modes 10 and 12). In thymine the empirical C5 methyl in-plane (dC5-Me, mode 4, 284 cm-1) and out-of-plane (gC5-Me, mode 5,
301 cm-1) are in good agreement with the ab initio values of 267 and 289 cm-1, respectively. Overall, the present force field satisfactorily reproduces HF/6-31G* scaled frequencies and assignments, indicating that deformations of the bases that occur during MD simulations will be accurately represented by CHARMM27.
4.2b Iterative optimization of selected dihedral parameters
investigated four possible compounds to use as models for sugar puckering, leading to the selection of a nucleoside.46 Similarly, the relevance of model compounds B, C, D, and E (Figure 2B) to nucleic acids has been justified by comparing the derived and ab initio
torsional energy profiles to the corresponding crystal distributions in nucleic acids and their components.48
The dihedral parameters were initially adjusted to reproduce the ab initio conformational energetics of the model compounds as closely as possible for the regions populated by DNA. These parameters were then used to perform condensed phase MD simulations of A and B DNA in crystal environments, from which dihedral angle distributions were obtained and compared with the corresponding distributions from a survey of DNA crystal structures. Deviations between the MD and survey data were noted and the dihedral parameters adjusted to enhance sampling in the MD simulations of regions poorly sampled previously. As discussed in Section 2.2, when it was deemed necessary to deviate from the QM model compound energy surfaces, the empirical surfaces were made “softer” such that the force field would be allowed to better sample conformational space rather than making a “harder” surface where the shape of energy wells would be narrowed and shifted to yield the correct dihedral distribution. An example of this procedure with is presented below. This approach ensures that the force field will not be constrained to canonical regions of conformational space, allowing for the surrounding
environment, base sequence and base composition to impact the regions of conformational space accessible to the phosphodiester backbone, the furanose moiety and the glycosyl linkage.
In the remainder of this section results and discussion will be presented for the individual dihedral angles followed by the sugar puckering. Results include comparison of the empirical and ab initio torsional potential energy surfaces for both the south and north furanose puckers along with comparisons of dihedral distribution from the A and B DNA crystal simulations (Table 1) and their crystal survey counterparts. Inclusion of both the C3’endo and C2’endo furanose puckers at the model compound level was performed to represent the north and south conformational ranges populated by the sugars in nucleic acids. At certain stages during the optimization, solution MD simulations were performed on the EcoRI and CATTTGCATC sequences to insure that the B form properties were not biased by the use of one particular crystal structure. Results from these simulations are included in the accompanying manuscript.35 For the final parameter set, the average RMSD for the B crystal over the 600 ps of sampling (see Methods) for all non-hydrogen atoms with respect to the experimental structure was 1.03±0.08 Å, with the error being the standard deviation. For the A crystal the corresponding values were 1.14±0.08 Å.
torsion Results for the dihedral will be presented first as they represent a good
condensed phase properties. Emphasis in the initial fitting of this dihedral was placed on the g+
conformation, which is the region most populated in DNA and RNA. Shown in Figure 4A are three empirical surfaces for model compound B along with the ab initio data. In Figure 4B probability distributions from MD simulations of the B form crystal using the same three parameter sets are presented along with the survey data for B form DNA structures. Note the change in the scale of the X-axis upon going from Figure 4A to 4B. Parameter set 1 was
optimized to reproduce the ab initio model compound data in the region of 0 to 90˚ (Figure 4A). Use of that parameter set in MD simulations, however, results in a distribution of values much narrower than that obtained from the survey. The parameters were then adjusted to decrease the rise in energy upon departing from the minimum at 50˚ in the model compound (triangles in Figure 4). This change led to better agreement between the MD and survey probability
distributions, although the simulated distribution was still too narrow. This motivated additional adjustments yielding parameter set 3 (diamonds in Figure 4) which is in the greatest
disagreement with the model compound target data, but the best agreement concerning the survey data. Since the goal of the parameter development if for a force field to be used in condensed phase simulations parameter set 3 was selected.
One point concerning the results in Figure 4 should be emphasized. The energy surface for parameter set 3 is clearly “softer” than the ab initio target data, allowing the DNA to more broadly sample conformational space in the MD simulation. The “softer” empirical surface may, in part, be a consequence of the limited sampling of the dihedral in the present MD simulations. It cannot be excluded that additional sampling, via longer or multiple simulations, may be required to properly sample the dihedral. If this were true, parameter set 1 may be the optimal choice for the final force field rather than set 3; this point is discussed in more detail in the Conclusion.
Results for for the final parameter set are presented in Figure 5; this set differs from set 3 in Figure 4 due to changes in a number of other parameters in the force field. The ab initio
data in Figure 5 are at the MP2/6-31+G* level. The CHARMM27 results are in satisfactory agreement with the QM data concerning the location of the minima and barriers. The empirical energy barrier at approximately 120˚ is lower than the QM value, due to the need to “soften” the surface in the vicinity of the g+ minimum. Comparison of the MD and survey probability
distributions shows the agreement to be good for both the A and B forms of DNA (Figures 5C and 5D, respectively).
molecule alters the conformational energetics of DMP, as shown in Figure 6A, leading to a lowering of the energy of the g,t conformer that may impact the equilibrium between the A and B forms of DNA.91 This result has been reproduced at a variety of QM levels of theory, including the use of the IPCM92 reaction field model (A.D. MacKerell, Jr., unpublished results) and other studies have shown the energetics of DMP to be altered by an aqueous environment. 93-97 While solvent contributions do affect the potential energy surface of DMP it is not clear whether the ab initio gas phase or solvated surface should be used as target data. Ideally, the empirical model would reproduce both the gas phase and solvated results, however, this could not be achieved with the present force field. Accordingly, a compromise was made yielding an empirical energy surface that produced energies in the g,t region of the surface (180 to 240˚) intermediate to the gas phase and monohydrate values. This compromise leads to a lowering of the energy barrier between the g,g and g,t conformations below the height seen in either the gas phase or monohydrate surfaces. Also of note when comparing the ab initio and empirical surfaces is the increase in energy as the O-P-O-C dihedral approaches 360˚. In the present parameter set this increase in energy was lowered significantly as compared to the ab initio data to allow the dihedral to sample regions above 300˚ that are significantly populated in B DNA. The resulting probability distributions for both A and B DNA are shown in Figures 6B and 6C, respectively. In both cases the crystal survey data are satisfactorily reproduced by the force field, including the shift in the maximum from approximately 285 to 300˚ upon going from A to B DNA. With B DNA the force field overpopulates the region of 300 to 330˚, however, this is required to obtain the sampling of the region between 330 and 360˚. As discussed above for , the need to lower the energy in the 300 to 360˚ at the model compound level to properly sample that region in the simulation may be due to limited sampling in the simulations.
torsion Optimization of the parameters associated with was performed using compound B (Figure 2B). Presented in Figure 8 are the potential energy profiles for for the C3’endo (Figure 8A) and C2’endo (Figure 8B) puckers along with probability distributions for the A (Figure 8C) and B (Figure 8D) forms of DNA. The present force field reproduces the ab initio data well, although with lower energies for < 180˚. This departure from the ab initio
energy surface was necessary to allow for in the MD simulations to properly sample the regions occupied in the crystal surveys, as shown in Figures 8C and 8D for the A and B forms of DNA. For the A form, the MD simulation results nicely reproduces the NDB survey data. For the B form the force field in the MD simulation properly samples the region of going down to 105˚. There is a slight overpopulation by the MD simulation at 120˚, however, this is not present in solution MD simulations,35 indicating that crystal packing may cause this peak. Supporting this assertion is the presence of a dihedral with a value of 112˚ in the experimental B crystal structure.
The surfaces illustrates how the most populated regions of a dihedral can deviate significantly from the minimum in the potential energy surface at the model compound level. This is most evident with the B form DNA probability distribution. In the model compound the minimum occurs at 240˚ in the energy surface (Figure 8B) while the maximum in the B DNA probability distribution occurs at 177˚ (Figure 8D). Such differences illustrate the influence of the other contributions from the force field on the regions of conformational space being sampled, emphasizing the need for a proper balance between these different contributions.