MULTIPLE-MODEL BASED VERIFICATION OF ROAD DATA
M. Ziems, U. Breitkopf, C. Heipke, F. Rottensteiner
IPI – Institute of Photogrammetry and GeoInformation, Leibniz Universität Hannover,
Nienburger Str. 1, 30167 Hannover, Germany, [email protected]
Commission III, WG III/4
KEY WORDS: Road database, Quality, Updating, Aerial, Classification, Model
ABSTRACT:
This paper describes a semi-automatic system for road verification based on high resolution imagery and 3D surface models. Potential update regions are identified by an object-wise verification of all existing database records. The proposed system combines several road detection and road verification approaches from current literature to form a more general solution. Each road detection / verification approach is realized as an independent module representing a unique road model combined with a corresponding processing strategy. The object-wise verification result of each module is formulated as a binary decision between the classes “correct road” and “incorrect road”. These individual decisions are combined by Dempster-Shafer fusion, which provides tools for dealing with uncertain and incomplete knowledge about the statistical properties of the data. For each road detection / verification module a confidence function for the result is introduced that reflects the degree of correspondence of an actual test situation with an optimal situation according to the underlying road model of that module. A comparison with results from an EuroSDR test on road extraction demonstrate the strengths and limitations of the method.
1. INTRODUCTION
Road networks are important parts of national infrastructure. Therefore, up-to-date, complete and accurate information about road networks is of vital importance. In order to maintain a high quality of road databases, short update-cycles are required. This can be supported by using remote sensing imagery for automated road verification and update. Whereas many road detection approaches were developed in the last two decades, cf. (Mena, 2003; Poullis & You, 2009), only few papers deal with the verification or updating of databases, which can be seen as a natural application for road detection methods.
In (Klang, 1998) a semi-automatic system for the enhancement of the Swedish road database based on a comparison with SPOT and Landsat satellite imagery is described. The approach detects the positions of road junctions within a tolerance radius around the positions indicated in the database. These nodes are used as seed points for an active contour model which is applied to every road object of the database. Finally, a comparison of the extraction result and the corresponding database object provides the human editor with a number of potential objects for the updating process. The system was extended for updating the National Topographic Database of Geomatics Canada (Fortier et al. 2001). Zhang (2004) uses aerial stereo imagery to extract a complete road network by introducing information from an existing database, e.g. approximate geometry and network topology. Zhang and Couloigner (2004) describe a framework for road change detection. They present different map conflation techniques between the database and polylines detected in images, to classify road objects as being unchanged,
partly changed, changed, disappeared, or created. As their focus is on map conflation, they assume the existence of a perfectly detected road network as a basis. Poulain et al. (2010) describe a method that applies high resolution SAR and optical images for an automatic update of a road database explicitly in an urban context. For each database object, features are extracted within a region near the positions indicated by the database. These features reflect different properties of a road,
but also those of typical urban context objects, i.e. buildings and vegetation. In a first step, each road object is verified using the extracted features; in this process, the features are combined by Dempster-Shafer fusion. In a second step, road candidates are extracted from the entire image and verified by their proximity to road objects verified in the first step. The results show that the fusion concept is able to combine features from different data sources successfully. Gerke and Heipke (2008) present a method for road verification in rural areas on the basis of aerial or satellite imagery. They extract linear objects within a region near the position indicated by the database. Then, the extracted lines are compared with the database; only if an object cannot be associated to appropriate linear objects it has to be inspected by a human operator.
In this paper we present a method for automated road verification based on colour orthophotos and normalized Digital Surface Models (nDSM). In accordance with conclusions from a review of the related work, we carry out an object-wise test for each road object in the database. Thus, we solve the verification task locally and introduce prior knowledge from the database to be updated. As we know that we will not find a clear solution for all road objects, difficult situations are forwarded to a human operator together with all the objects that are likely to correspond to a change in the database. Whereas inspecting the scene is automated, the editing task itself is still manual.
In order to define an automatic test that is valid for different settlement structures, environmental conditions and image sources, we combine powerful approaches from current research in the field of road extraction. We presented the method in previous publications that where focused on the adaptation of the road extraction algorithms to the verification task with respect to particular tasks (Ziems et al., 2010, 2011a). In the current paper we focus on the fusion framework we use to combine the different approaches. The experiments are set up to analyse the characteristics of the combination on the basis of different datasets. Furthermore, we compare our results to a benchmark dataset, provided by EuroSDR (Mayer et al., 2006). ISPRS Annals of the Photogrammetry, Remote Sensing and Spatial Information Sciences, Volume I-3, 2012
2. METHOD
Our method relies on a set of object extraction algorithms realized as so called verification modules. These modules are based on different models e.g., describing roads as lines, as homogeneous areas with parallel edges, or by their different appearance compared to context objects such as buildings. Each algorithm can deal with a subset of these situations and its success will depend on the compliance of the model assumptions with the actual appearance of the roads in the image. In addition to its decision about the correctness of the road object, each module delivers a confidence value C with
0≤C≤1 that reflects the degree to which the situation encountered for the road object corresponds to the optimal situation according to the module’s underlying road model. The decisions from all modules are combined in a decision level fusion process in which the confidence values control the impact of a single decision on the final result.
2.1 Dempster-Shafer Fusion Framework
The fusion of the results from the different verification modules is based on the theory of Dempster-Shafer, e.g. (Klein, 1999). Our approach distinguishes the two classes road (R) and non-road (N). Consequently, the hypothesis space, called frame of discernmentΘ in the terminology of Dempster-Shafer, contains only of two elements: Θ={R,N}. The power set of Θ, denoted theory allows the combination of the probability masses from several sensors to compute a combined probability mass for each class A Œ 2Θ \ Ø:
In our model for the original probability masses we assume that each verification module i delivers a binary decision for or against a road, i.e., either Ri or Ni, and a confidence value Ci∈[0, 1] measuring its trust into its own decision. The negation of Ci, CiN=1-Ci, corresponds to the degree to which no decision can be taken by the module given the data. This can be modelled by assigning a probability mass of 1-Ci to Θ, thus mi(Ri∪Ni)=1-Ci. If the module’s decision is Ri, we set mi(Ri)=Ci and mi(Ni)=0; otherwise, we set mi(Ri)=0 and mi(Ni)=Ci. Thus, the module’s decision is weighted by Ci in the fusion framework. After combining the probability masses of all modules using Eq. 1, the overall decision is either R or N, depending on which class obtains the overall maximum support. However, if the confidence value Ci is low for all modules i, indicating situations inappropriate for all modules, the support both for R and N will be relatively low, so that such cases can be found by applying a threshold to the overall support. Thus, roads are accepted as correct if sp(R) ≥ 0.5 « sp(N) < 0.95.
with BjŒ 2Θ (1)
2.2 Verification Modules
In this Section we give a short overview of the verification modules. Some of these modules rely on data sources that are not necessarily available (nDSM or an IR-band); in such a case, these modules are simply not used.
2D_line: This module complies with the road extraction algorithm presented in (Wiedemann and Ebner, 2000) that models roads as linear objects in aerial or satellite imagery with a resolution of up to 2 m. The parameters for each database object are automatically adjusted by taking into account the positional and attribute information from the database to be verified. Then, the extracted lines are compared to the original database by explicitly checking geometry, shape and line width of each road object. If a major part of the road is covered by appropriate line segments, the database object is decided to be correct; otherwise no decision is taken (Gerke and Heipke, 2008). As the underlying line model assumes homogeneous context regions, the algorithm is expected to deliver less reliable results in heterogeneous surroundings. Hence, the confidence of the module’s decision can be based on the image entropy E:
( ) log ( )
g G
E H g H
∈
= −
∑
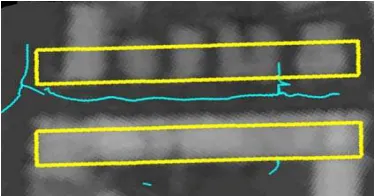
⋅where H(g) is the histogram of the image region next to the road (cf. Figure 1). The entropy is expected to be low for homogeneous and high for heterogeneous contexts. Thus, we assign a high confidence value of C2D-line=0.9 to the module’s decision for E=0 and a low confidence value for C2D-line=0.1 for the maximum possible entropy (E=8 for 8 bit images). Based on these pre-defined values, we can find two parameters a and b
for a shift and a scaling of E and plug the result into a sigmoid function to obtain a confidence function monotonically decreasing with x=E:
Figure 1: 2D line extraction result (blue) and region mask (yellow) for computing entropy E
3D_line: This module is based on (Hinz and Baumgartner, 2003), where roads are detected as “valleys” in the nDSM. Analogously to the 2D_line detector, the resulting lines are compared to the database objects to provide a decision about the correctness of a road object if the major part of the road is covered by appropriate line segments; otherwise no decision is taken (C3D_line=0). The algorithm is designed for densely built-up areas, whereas less densely built-built-up areas show many linear structures in the nDSM that may lead to false alarms. Thus, the confidence C3D_line of the module is formulated by the entropy E of the nDSM next to the road (cf. Figure 2), analogously to the 2D_line module.
Figure 2: nDSM with 3D-line extraction result (cyan) and region mask for computing entropy (yellow)
Parallel_Edge: A frequently used characteristic of roads are parallel edge pairs that represent road borders in an image. In our system, this information is extracted a method similar to (Baumgartner et al., 1999). Only if a major part of the database object with length ldb is covered by extracted edge pairs of length lH+ with appropriate geometry, shape and spacing, the object is considered as correct, otherwise no decision is taken and thus the confidence is set to zero. In case of high coverage, the confidence of the module’s decision is determined by analysing alternative hypotheses in the local surrounding that may result from buildings or tracks on cultivating farmland. To achieve this goal, the projected length lH- of extracted edge pairs with contradictory geometry or shape with respect to the database object is computed. The confidence is defined by:
H H
parallel db
l l
C
l
+− −
= ∀
H H
l + ≥l −
and Cparallel =0, otherwise.
SSH: This model was introduced by Fujimura et al. (2008) to remove a shift of cartographically generalized road data. The basic idea is that the image region belonging to a road can be identified by the uniqueness of its intensity distribution compared to its surroundings. A road is considered to be correct if the sum of the similarities of the histograms (SSH) associated to the road in the database is significantly lower than the SSH
scores of the surrounding image regions. The road geometry and width information from the database is used to define several image regions with identical shape and area (Figure 3). While intensity distributions in areas in the vicinity of a road are similar to each other, the road-related histogram leads to a lower
SSH (Figure 3, lower left). The optimal realization for the underlying model is characterized by a homogeneous neighbourhood in a direction orthogonal to the given road axis. The model can also deal with inhomogeneous neighbourhoods if there is no single non-road region having a low SSH score.
CSSH is modelled as the difference of the actual configuration and the optimal model SSHmodel (Figure 3, lower right):
( )
( )
(
1
1 R
SSH model
r=
C = SSH r SSH r
R⋅
∑
−)
where r is a region index and R is the number of regions considered. Thus, CSSH mainly depends on the surroundings of the road. A high confidence value corresponds to a situation where all non-road regions have a similar intensity histogram but that of the road region is different. A low confidence is obtained if every non-road region has a histogram that is rather different from the histograms of all the other non-road regions.
Figure 3: Input image with road region (blue) and 24 non-road regions (yellow). Left: the computed SSH scores over the profile index. Right: and an optimal SSH configuration.
Colour: An image region belonging to a road has specific radiometric properties that can be defined in advance. We use a Support Vector Machine (SVM) classifier (Vapnik, 1998) for the purpose of distinguishing the two classes road and non-road in an object-based classification scheme. As the radiometric properties for both classes depend on local characteristics, e.g. road surfaces, sun-angle, presence of shadows or roof colours, a training step is required for each scene. The underlying model is appropriate if the colour contrast between the road and its local surrounding is high and if the training data represent the tested object, but unreliable otherwise. Both aspects are considered for the definition of the confidence function. The contrast is determined based on the feature space distances d(z,xl) and d(z,xr) between the feature vector of the road candidate z and the two feature vectors xl and xr from both sides of the road. The latter are computed from the regions next to the road that have similar shape and area, comparable to the SSH strategy (Figure 3). Furthermore, the feature space distance d(z,υ) between the training dataset, represented by a Support Vector Domain Description (SVDD) (Tax and Druin, 2004), and the feature vector of the road candidate z is computed. The confidence Ccol is defined as follows:
( ( , ) )
( , ) ( , ) 1
1
l r
col a d z b
d z x d z x C
e
d d − ⋅ υ+
= ⋅ ⋅
− (3) where d¯ is the average distance of the feature vectors used for training to the SVDD surface. Thus, the value reflects the density of the training data; cf. (Ziems et al., 2011b). The parameters a and b for the sigmoid function are selected so that the term becomes 0.9 for d(z,υ)=0 and0.1 for d(z,υ)= d¯.
Intersection: This module is based on the method developed by Youn et al. (2008) for road extraction in urban areas. The underlying model is based on the structural differences between a road and a row of buildings. Several lines are defined, which are parallel to the database object (cf. Figure 4). Then the number of intersections of these lines with edges extracted from the image is counted. The lower part of Figure 4 shows the distribution of this count for the lines. The small values in the centre indicate the true position of the road, whereas greater values indicate buildings. The minimum of the histogram is assumed to correspond to the road centreline. If the distance between the position of this minimum and the position of the centreline indicated by the database is lower than the maximum error allowed according to the specifications of the database, the road is decided to be correct.
Figure 4: Strategy of edge direction analysis (extracted edges = black, expected road centreline = dotted cyan, parallel profiles = blue). Lower left: the computed histogram of the intersection counts over the profile index. Lower right: an optimal model configuration.
For urban areas containing a lot of small houses, the model is robust. However, more homogeneous context such as grassland, paddy fields or huge industry halls, is not covered by the model. Therefore, the confidence value is modelled as a function of the surrounding structure elements. The actual histogram is compared with a histogram based on the optimal situationfor that model, exemplarily depicted in the lower right of Figure 4. This optimal situation is an absolute free passage through the expected road and a number of intersections on each side of the road, which occur if a row of buildings of standard size is situated next to the road with a specific width. The confidence
Cdir for the edge direction analysis is calculated as the area ratio of the actual histogram H and an optimal histogram Hmodel:
1
1 1
2
1
( ) ( )
( )
A N
n n A
dir N
model n
n n
C =
H n
−
= = +
=
Δ ⋅ Δ
⎛ ⎞
⎜ ⎟
⎜ ⎟
⎝ ⎠
∑
∑
∑
where n is the profile index and A is the index of the centreline profile; Δ(n) = Hmodel(n) - H(n) if Hmodel(n)≥H(n) and Δ(n) = 0 otherwise. As the neighbouring areas may be fairly different on both road sides, the area to the left and the area to the right of the road are considered by different terms.
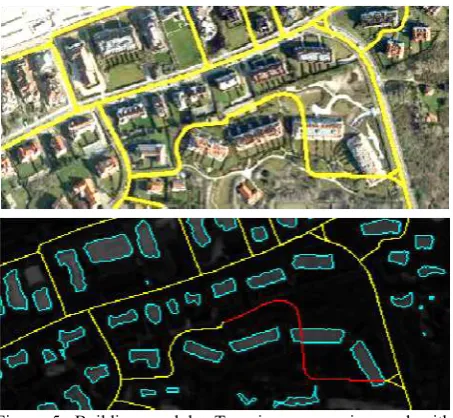
Building: Explicitly considering of buildings as vote against the correctness of the road object is frequently applied in literature (Hinz and Baumgartner 2003; Zhang, 2004; Poulain et al., 2010). As we are not interested in the buildings themselves, the building detection strategy is kept simple. Firstly, a 3m threshold is applied to the nDSM; secondly, trees are removed by introducing a vegetation mask computed by a simple landcover classification. A road object is decided to be wrong if its centreline intersects an extracted building (Figure 5). The confidence Cbuild is defined on the basis of a reliability map originated from the nDSM generation process.
Figure 5: Building module. Top: image superimposed with database roads containing one incorrect object. Bottom: nDSM superimposed with extracted buildings (cyan) and evaluation result (incorrect = red, no decision = yellow)
Grassland: In (Zhang, 2004) and (Youn et al., 2008), grassland was considered as a hint against the existence of a road. As the reconstruction of a road is frequently connected with a redevelopment of grassland areas it is usually a good indicator for such a change (e.g. Figure 6). Thus, we use a ground
vegetation mask, computed by a simple landcover classification, to detect intersections between grassland areas and the road centrelines. The confidence of the decision relies on the quality of the ground vegetation mask. As the vegetation areas of interest are usually small, local radiometric properties can significantly affect the result and lead to misclassifications, e.g. with dark road surfaces or shadowed road areas. Thus, the brightness of the intersecting image region is used to define the confidence Cveg by Eq. 2 for x= i¯ , where i¯ is the mean intensity value of the intersecting pixels in the green band. The parameters a and b are selected so that Cveg=0.9 for i¯ = I¯ and Cveg=0.1 for i¯ =0.0, whereI¯ is the mean intensity value of the whole scene in the green band.
Figure 6: Redeveloped roundabout identified by grassland detection (revised roads = red, no decision = yellow)
Topology: In order to enhance the image analysis results, the topologic properties of the road network are often considered, e.g. (Baumgartner 1999; Hinz and Baumgartner 2003; Gerke and Heipke 2008). The local object-based strategy proposed in this work is basically weak for short roads, as local occlusions or blurring can hardly be compensated. In accordance with the related work it is the assumption of this module that such short roads can be validated by their junctions (cf. Figure 7). Thus, for roads with length<30m that have two nodes (junctions) with
degree>1 we additionally consider the output of the verification modules from the roads connected to them. Hence, Eq.1 is extended to iterate over p`=p+k·p instead of p, where k is the number of connected roads. The additional k·p modules are considered with reduced confidences Ci`=0.5·Ci as they always express only one node of the road to be validated.
Figure 7: Topologic Analysis: short road objects are not verified by one of the verification modules. They are verified based on the junctions they connect (correct = green, undecided = yellow).
3. EXPERIMENTS
To evaluate our method, experiments with different datasets were carried out. In the following we will analyse the strengths and limitations of the particular modules with respect to different datasets. We will further compare these results with the combined solution and with those produced by the EuroSDR test presented in (Mayer et al., 2006). Additionally, we demonstrate the practical impact of our method on real cartographic datasets provided by the mapping agencies of Japan, Belgium and Germany. For all experiments we used the same system parameters. The only exceptions that were made are related to the availability of nDSM and IR-band in a particular dataset and to the training of the colour module, which is required for any new scene.
rk Module Completeness Correctness
EuroSDR_Aerial1
1 2D_line 0.52 (*0.17) 1.0
2 Parallel_Edge 0.27 (*0.02) 1.0
3 Intersection 0.24 (*0.06) 0.988
4 Colour 0.22 (*0.05) 0.967
5 SSH 0.21 (*0.01) 0.996
All 0.79 0.985
best of EuroSDR test 0.51 -
EuroSDR_Aerial2
1 2D_line 0.73 (*0.30) 1.0
2 Parallel_Edge 0.33 (*0.01) 1.0
3 Colour 0.26 (*0.02) 1.0
4 SSH 0.25 (*0.01) 0.995
All 0.90 0.996
best of EuroSDR test 0.65 -
EuroSDR_Aerial3
1 2D_line 0.82 (*0.29) 0.999
2 Parallel_Edge 0.47 (*0.02) 1.0
3 SSH 0.30 (*0.01) 1.0
All 0.97 1.0
best of EuroSDR test 0.72 -
EuroSDR_Ikonos1sub1
1 Intersection 0.62 (*0.38) 0.994
2 SSH 0.40 (*0.03) 1.0
3 2D_line 0.35 (*0.03) 1.0
All 0.94 1.0
best of EuroSDR test 0.48 -
EuroSDR_Ikonos3sub1
1 2D_line 0.88 (*0.03) 1.0
2 SSH 0.73 (*0.00) 1.0
3 Intersection 0.30 (*0.12) 1.0
All 0.95 1.0
best of EuroSDR test 0.81 -
EuroSDR_Ikonos3sub2
1 2D_line 0.92 (*0.07) 1.0
2 SSH 0.89 (*0.00) 1.0
3 Intersection 0.14 (*0.07) 1.0
All 1.0 1.0
best of EuroSDR test 0.85 -
Uraga
1 Intersection 0.59 (*0.25) 1.0
2 SSH 0.26 (*0.02) 0.980
3 Colour 0.19 (*0.05) 0.983
4 Topology 0.11 (*0.11) 0.940
All 0.71 0.986
Algiers
1 SSH 0.44 (*0.11) 0.998
2 2D_line 0.33 (*0.06) 1.0
All 0.61 0.998
Zeebrugge
1 Colour 0.43 (*0.03) 0.995
2 2D_line 0.38 (*0.07) 0.994
3 Parallel_Edge 0.35 (*0.07) 0.978
4 Intersection 0.18 (*0.02) 0.994
5 3D_line 0.11 (*0.08) 0.990
All 0.88 0.990
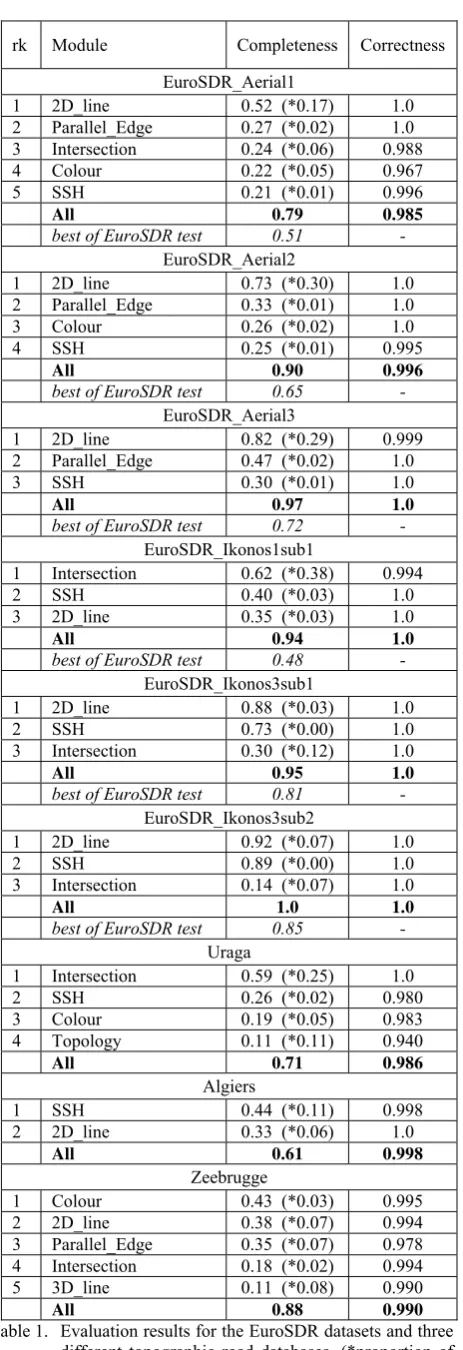
Table 1. Evaluation results for the EuroSDR datasets and three different topographic road databases. (*proportion of data exclusively validated by a module)
3.1 Datasets
EuroSDR_Aerial1-3 The three scanned aerial images (RGB, 0.5m GSD) are part of the EuroSDR benchmark dataset. For the experiments we used the reference dataset from the EuroSDR test as input data. As this dataset contains no errors, we simulated errors by rotating the reference data against the imagery by 180o. Hence, the verification approach should reject these objects. The scenes are named according to the original test.
• Aerial1: suburban area (43km correct roads)
• Aerial2: hilly rural scene with medium complexity (22km) • Aerial3: hilly rural scene with low complexity (23km)
EuroSDR_Ikonos: The three Ikonos tiles are a part of the EuroSDR benchmark dataset. The imagery consists of four bands (RGB,IR) pan-sharpened with 1.0 m GSD. As described above we used the EuroSDR reference dataset in addition with simulated errors for the experiments.
• Ikonos1sub1: suburban area in hilly terrain (18km) • Ikonos3sub1 and Ikonos3sub2: rural hilly scenes with low
complexity (8km and 6km)
Uraga: The aerial image (RGB 0.2 m GSD) was provided by the Japanese mapping agency. The scene shows suburban area in hilly terrain containing a recently finished redevelopment project of a main road. The vector data originate from the Digital Japan Basic Map and include 17 km of road network, of which 3.5 km are marked as incorrect by the manual update process. Many narrow roads and significant shadow effects lead to a high complexity of the scene.
Algiers: This Ikonos image shows a rural area near Algiers, where the roads usually have weak contrast to their surroundings. The meta data of the image are similar to those of EuroSDR_Ikonos. The vector dataset is part of the MGCP, which is an international topographic map of 1:50.000. It contains 670 km of roads, of which 7.5 km were identified to be wrong during a manual quality assessment process.
Zeebrugge: The 12x16km2 RGB image mosaic with 0.5 m GSD shows Zeebrugge, Belgium, and its surrounding area. The scene contains a dense urban area with multistory houses, but also suburban and rural regions. In addition to the imagery an nDSM, computed by dense matching, with 1.5 m GSD was available for the experiments. The input vector dataset contains 630 km of roads, of which 41 km were marked as incorrect by a manual update that was used as a reference.
3.2 Results and Discussion
All test results are summarized in Table 1. For each dataset, the entries are ordered by the completeness values of the modules. In order to restrict the size of the table, only modules that validated more than 10% of the roads are listed. In addition to the final solution, containing the information of all modules, the best result from the EuroSDR test is given for each dataset. In order to make our object-based results comparable to those of the EuroSDR test, which relies on centrelines, we always considered the lengths of the database objects to compute
completeness and correctness. Completeness denotes the length ratio of correctly validated roads compared to the total length of all correct roads in the reference, whereas correctness denotes the length ratio of correctly validated roads with respect to the total length of all validated roads.
General: As for the completeness, it can be seen in Table 1 that the strongest module mostly produce similar results as the best EuroSDR approach did. However, the combined solution is ISPRS Annals of the Photogrammetry, Remote Sensing and Spatial Information Sciences, Volume I-3, 2012
always better, which we interpret as a benefit from the decision level fusion strategy. The constantly high correctness values indicate that our solution is independent from the imagery and the complexity of a scene. The latter issue is important for our motivating task, because any object passing the test will never be investigated by a human editor; if the object is wrong, it will remain in the database as an undetected error. The EuroSDR results for correctness are not displayed in Table1. They are basically not comparable to ours because the verification task allows us to introduce strong prior knowledge from the outdated database, which was not true for the EuroSDR participants.
Aerial2, Aerial3, Ikonos3sub1, Ikonos3sub1: The best results were produced by the line-based approaches. This was already true for the EuroSDR test, where the winners rely on the same basic approach (Wiedemann and Ebner, 2000). As all the scenes show good contrast and a homogenous background the completeness is always high. The modules Parallel_Edge and SSH also successfully validated the scenes, but did not provide much additional information compared to the 2D_line module, which can be seen from the numbers in brackets. The slightly better result of the 2D_line module compared to the line based approaches of the EuroSDR test originates from our object based strategy, which better compensates problems with junctions and smaller occlusions.
Aerial1, Ikonos1_sub1: These two scenes show a strong benefit obtained by combining different approaches. Similar to the approaches used by EuroSDR participants, our modules are always able to deal with smaller parts of the scene quite well, either with the rural or with the suburban part. For the suburban regions the modules based on colour classification and edge intersections were most successful. The latter one had not been used in the EuroSDR test and is mainly responsible for the better result of the proposed approach.
Uraga: The narrow roads and the low sun angle lead to strong shadow effects on the road surfaces. As both the SSH and the colour module are based on models that can deal with shadow effects, they still delivered reasonable results where the other modules failed. Furthermore, the high resolution of the imagery (0.2 m) enhances the success of the area based models. Finally, the consideration of the network topology leads to a significant amount of positive response for many short roads in that scene.
Algiers: As the scene shows comparably low contrast between roads and background, the SSH based model performs strong by considering a large surrounding area of a road.
Zeebrugge: The comparably huge dataset contains roads of many different characteristics and thus does not favour any module. As this dataset contains an nDSM, the 3D_line module has a strong impact in the city centre.
Grassland and building detection modules: As these modules do not validate roads, they do not occur in the result tables. However, they raise the correctness value compared to the single solutions. For Zeebrugge the correctness of the combined solution increases from 0.981 without these modules to 0.990 with these modules, thus nearly halving the error.
4. CONCLUSIONS
The results presented in this paper show that the combination of relatively simple road detection approaches leads to good results, even for complex scenes. The comparison of our results with those of the EuroSDR test demonstrated the strength of the proposed approach. Furthermore, it was shown that the achieved correctness is widely independent from the image data and the complexity of a particular scene.
ACKNOWLEDGEMENTS
We thank the organizers of the EuroSDR test, Helmut Mayer and Uwe Bacher, as well as the national mapping agencies of Japan, Belgium and Germany for providing test and reference data. For our implementation in C++ we use the open-source libraries CNES-OrfeoToolbox (orfeo-toolbox.org), GeoAIDA (geoaida.berlios.de), and LIBSVM (Chang & Lin, 2001).
REFERENCES
Baumgartner, A., Steger, C., Mayer, H., Eckstein, W., Ebner, H., 1999. Automatic road extraction based on multi-scale, grouping, and context.
PE&RS 65(7):777-785.
Chang, C.-C., Lin, C.-J., 2001: LIBSVM: a library for support vector machines: ACM Trans. on Intel. Sys. and Techn..
Gerke, M., Heipke, C., 2008. Image based quality assessment of road databases. IJGIS 22 (8): 871-894
Fortier, M. A., Ziou, D., Armenakis, C. & Wang, S., 2001: Automated correction and updating of road databases from high-resolution imagery.
– Can. J. of Rem. Sens. 27 (1): 76–89.
Fujimura, H., Ziems, M., Heipke, C., 2008. De-generalization of Japanese road data using satellite imagery. PFG 5: 363-373.
Hinz, S., Baumgartner, A., 2003. Automatic extraction of urban roads from multi-view aerial imagery. IJPRS 58(1-2): 83-98.
Klang, D., 1998: Automatic detection of changes in road databases using satellite imagery. IntArchPhotogramRemSens SpatialInformSci
32/4: 293-298.
Klein, L., 1999. Sensor and data fusion, concepts and applications. 2nd
edition, SPIE Optical Engineering Press.
Mayer H., Baltsavias E., Bacher U., 2006. Automated extraction, refinement, and update of road databases from imagery and other data.
Report Commission 2 on Image Analysis and Information Extraction, European Spatial Data Research - EuroSDR, Official Publication 50, pp. 217-280.
Mena, J., B., 2003: State of the art on automatic road extraction for GIS update: a novel classification. - Journal Pattern Recognition Letters archive 24 (16), 3037-3058.
Poulain, V., Inglada, J., Spigai, M., Tourneret, J.,Y., Marthon, P., 2010: High resolution optical and sar image fusion for road database updating.
IGARSS 2010: 2747-2750.
Poullis, C. and You, S., 2010: Delineation and geometric modelling of road networks. IJPRS 65(2), 165-181.
Tax, D.M.J., Duin, R.P.W., 2004: Support vector data description.
Machine Learning 54(1) 45–66
Vapnik, V. N., 1998: Statistical Learning Theory. Wiley, N.Y. Wiedemann, C., Ebner, H., 2000. Automatic completion and evaluation of road networks. IntArchPhotogramRemSens SpatialInformSci
33(B3/2): 979-986
Youn, J., Bethel, J. S., Mikhail, E. M., Lee, C., 2008: Extracting urban road networks from high-resolution true orthoimage and Lidar, PE&RS
74(2): 227-238.
Zhang, C., 2004: Towards an operational system for automated updating of road databases by integration of imagery and geodata. IJPRS 58 (3/4): 166-186.
Zhang, Q., Couloigner, I., 2004: A framework for road change detection and map updating, - IntArchPhotogramRemSens SpatialInformSci
35(Part B2): 720-734.
Ziems, M., Fujimura, H., Heipke, C., Rottensteiner, F., 2010: Multiple-model based verification of japanese road data.
IntArchPhotogramRemSensSpatialInformSci (9) 13-19.
Ziems, M., Beyen, J., Mueller, S., Roovers, S., Heipke, C., 2011a: Multiple-Model based update of Belgian reference road database. In:
IntArchPhRS vol. XXXVIII, part 4, Guilin, China, 2011, pp. 73-80. Ziems, M.; Heipke, C.; Rottensteiner, F., 2011b: SVM-Based Road Verification with partly Non-Representative Training Data. Joint Urban Remote Sensing Event, Munich. 37-40