Page 227 - 242
Received: March 14, 2017; Revised: May 3, 2017; Accepted: May 10, 2017
State Islamic University (UIN) Syarif Hidayatullah Jakarta. Jl. Ir. H. Juanda No. 95, South Tangerang Abstract. Comparing Eiciency and Productivity in Islamic Banking: Case Study in Indonesia, Malaysia, and Pakistan. he objective of this research is to analyze both eiciency and productivity of Islamic Banking Industry in Indonesia, Malaysia and Pakistan. he technique that used in this research is Data Envelopment Analysis (DEA) as for measuring eiciency and thus Malmquist Index (MI) as for measuring productivity. he result of this research found that Islamic Banking Industry in Indonesia is facing ineiciency that shown by ive years average that is not reach 100% eiciency rate. Malaysia also experiences the problem of ineiciency but the condition is better compared to Indonesia. In ive years, the eiciency rate of Malaysia Islamic Bank has not reach 100% eiciency rate. Pakistan among the closest country that could reach an eicient rate level for their Islamic banks. Pakistan close to reach 100% eicient rate within the last ive years.
Keywords: data envelopment analysis, eiciency, malmquist index, productivity
Abstrak. Perbandingan Eisiensi dan Proitabilitas Perbankan Syariah: Studi Kasus di Indonesia, Malaysia, dan Pakistan. Tujuan dari penelitian ini ialah untuk menganalisis eisiensi dan proitabilitas industri perbankan syariah di Indonesia. Teknik yang dipergunakan dalam penelitian ini ialah data envelopment analysis (DEA) untuk mengukur eisiensi dan indeks Malmquist untuk mengukur produktivitas. Hasil penelitian menunjukkan bahwa industri perbankan syariah cenderung kurang eisien, hal ini diperlihatkan oleh data rata-rata lima tahun terakhir yang tidak mampu mencapai tingkat eisiensi 100%. Malaysia turut pula menghadapi permasalahan ineisiensi, namun kondisi ini lebih baik dibandingkan Indonesia. Dalam lima tahun terakhir, tingkat eisiensi industri perbankan syariah di Malaysia tidak mencapai tingkat eisiensi 100%. Pakistan merupakan salah satu Negara yang hampir mencapai tingkat eisiensi pada industri perbankan syariahnya. Pakistan mendekati tingkat eisiensi rata-rata 100%.
Kata kunci: data envelopment analysis, eisiensi, indeks malmquist, produktivitas
COMPARING EFFICIENCY AND PRODUCTIVITY IN
ISLAMIC BANKING: CASE STUDY IN INDONESIA,
MALAYSIA AND PAKISTAN
Introduction
he Indonesian Islamic banking industry had growing rapidly. Nowadays, Islamic banking in Indonesia must able to compete with conventional banks. To increase the competitiveness of Islamic banking industry, the Islamic banks required to operate eiciently. his things to achieve the optimum proit and productivity.
Measurement of the eiciency of the inancial ratios can’t detect internal and external factors cause ineiciency. Banking management also cannot be analyzed through inancial ratios. herefore, it is necessary to measure the eiciency to get more good approach. As it is described above, the measurement of eiciency and proitability in Islamic banking is very important. With known levels of eiciency and proitability levels, it will show the overall performance of Islamic banks. here are some factors that cause ineiciencies, which can also be known that Islamic banks can do a proper evaluation to improve performance and increase competitiveness (Hossen & Rahmawati, 2016).
Yudistira (2004) using Data Envelopment Analysis (DEA) toward 18 Islamic banks, the results of the study revealed that ineiciency experienced by the 18 banks is only touched at 10% a little more, it means quite low when compared to conventional banks. Bank of the sample in this study experienced hard times when passing time of global crisis in 1998-1999. However, it performs very well afterwards, the indings in this study also indicate the existence of diseconomy scale in small to medium sized banks so it is recommended that merger should be done. Suian (2007) perform the test with ive elaboration, Productivity Change (TPCH), Technological Change (TECHCH), Eiciency Change (EFFCH), Pure Technical Eiciency Change (PEFFCH) and Scale Eiciency Change (SECH). he results of this study showed the productivity of Malaysian Islamic banks touching productivity by 8.4% in 2002, increased to 11.2% in 2003 before eventually decreased by 4.6% in 2004. Ahmed, et.al (2009) shows that the government of Pakistan has succeeded in increasing efectiveness and productivity of the banks in the domestic domain through improvement/reforms of its inancial sector.
On eiciency and productivity of inancial institutions in general, there is quite a lot of research exploring particularly in the form of inancial institutions such as bank. It is no surprise because the banking industry itself has been established since a long time in the form of conventional model and continues to grow until alternative banking is available, such as Islamic banking.
Literature Review
Ellahi, et.al (2011) ind that Islamic banks are less eicient than conventional banks, because it is not yet to (be) introduced well by the market, and Islamic banks need more funding to get the source of deposit. he Anova test result shows a signiicant diference for TE as well as for CE between conventional banks and Islamic banks. Hassan (2006) conduct a testing within the scope of cost proit, revenue and X-eiciency of Islamic banks in the world not only by using stochastic cost frontier approach as a method, but also perform the testing with could be performed in conjunction with conventional accounting ratios in determining the performance of Islamic banks. Although Islamic banks are relatively less eicient in containing cost, they are relatively eicient in generating proit. he average allocate eiciency is 74%, whereas the average technical eiciency is about 84%. his means that the dominant source of ineiciency is due to allocate ineiciency rather than technical ineiciency. hese results are consistent with the fact that the Islamic banks operate in overall regulatory environments, which are not very supportive of their operations. Mghaieth and El Mehdi (2014) focus on inding the determinants of Islamic banking around economy crisis timeline, 2007-2008. It shows the samples (banks) has 82.13% rate of cost eiciency and 82.47 % rate of proit eiciency.
Mohamad, et.al (2008), in Eiciency of Conventional versus Islamic Banks: International Evidence using the Stochastic Frontier Approach (SFA), Measures and compares the cost and proit eiciency of 80 banks in 21 of Organization of Islamic Conference (OIC) countries: 37 conventional banks and 43 Islamic banks, using the Stochastic Frontier Approach (SFA). In addition, it assesses the eiciency of those banks based on their size, age, and region. he indings suggest that there are no signiicant diferences between the overall eiciency results of conventional versus Islamic banks. However, there is substantial room for improvement in cost minimization and proit maximization in both banking systems. Furthermore, the indings show no signiicance diference in average eiciency scores between big versus small and new versus old banks in both banking streams. his implies that size and age did not afect the performance of banks in both streams. Overall, the results are in favor of the more recent Islamic banking system.
Setiawan (2007) concluded that the ineiciency of banking in Indonesia is generally caused by the ineiciency of operating costs and ineiciencies of rupiah credit costs. Although banks forming the DEA are considered as an eicient bank, in fact, the high net interest margin of these banks is caused by high proits mark-up as well as high risk mark-up. Indrawati (2009) shows that the commercial banks in Indonesia are relatively ineicient.
Berger, et.al (2007) analyzed the proit and cost eiciency using 266 pieces of annual observation data from 38 banks in the period of 1999-2003. he empirical results of this study stated that the reforms undertaken against banks in China in the form of reduction in government ownership and extend the gateway for foreign investors have brought very strong positive efect on the eiciency. Luciano and Regis (2007) conclude that there seem to be economies of scale at the beginning of the period, while they do not seem to characterize more.
Jajri (2008) reveals that in general TFP growth in SMIs is negative due to negative contribution from both technical eiciency and technical change. However, analysis by sub industries indicates some positive TFP growth especially in the light industries like food and beverages, textiles and plastic products that merely come from positive contribution of technical eiciency. he heavy SMIs like transport equipment and chemical products seem less eicient and at the same time do not gain positive growth in technical change that subsequently resulted in negative growth of TFP. he study also inds that technical change is a signiicant determinant of SMIs output growth in six sub industries: food and beverages, textiles, wood products, plastic products, electrical electronics and transport equipment. In other industry sub groups the relationship are positive but not signiicant.
Based on the literature review above, shows that measurement of eiciency and productivity of certain industrial area and the usage of DEA are become a common in general and thus we can also inferred that there is a gap that needs to be illed, which not only to update the above mentioned works but also because a comprehensive study about eiciency and productivity on Islamic banking in Indonesia, Malaysia and Pakistan.
Method
that purpose data processing techniques which will be used are as follows: First, Data Envelopment Analysis (DEA) for eiciency measurement. Second, malmquist Index (MI) is using to measure the productivity in Islamic banking industry.
here’s generally three types approaches to determine which proxies, which will be the variables, those three approaches are asset, production and intermediation. Each approach considers the X and Y relation. Whereas most research tend to use intermediation approaches. Intermediation (Yudistira, 2004) approaches assumes that bank is and institution which doing intermediary function that is bank is positioned as the one who bridging the deicit with the surplus one, with this assumption then the bottom line is that total deposits will be considered as X variable while loans, funding and inancing will considered as output. his research is using three input variables (such as: staf cost, ixed cost, and total deposit) and three output variables (such as: total loans, incomes, and liquid assets.
he data will be analyze using the help of software whereas the result will indicate how does eiciency and productivity a bank, it can be seen through the indicates: (1) DEA, Indicator of eiciency, value of: (a) CRS (Constant Return to Scale); (b) VRS (Variance Return to Scale); (c) SE (Scale Eiciency). (2) Malmquist, Indicator of productivity, value of: (a) EFFCH, eiciency change related to CRS DEA; (b) PECH, eiciency change related to VRS DEA; (c) SECH, eiciency change related to SE DEA; (d) TECH, technological change; (e) TFPCH, Total Factor Productivity change.
Result and Discussion
Eiciency Measurement
Here are the results of analysis on the Islamic banking performance in Indonesia in terms of eiciency; performance calculation was performed by the method of Data Envelopment Analysis (DEA).
Eiciency Measurement in Indonesia
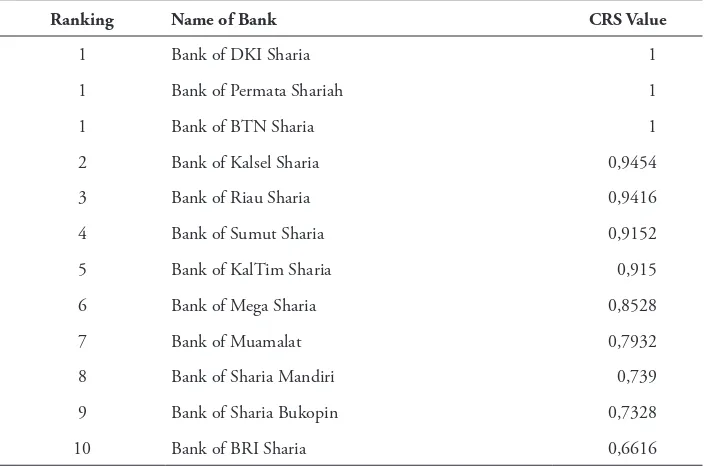
of Muamalat (0.7932); Number 9 is Bank of Sharia Mandiri (0.739); Rank number 9 is Bank of Sharia Bukopin (0.7328); he rank 10 is Bank of BRI Sharia (0.6616).
Table 1. CRS: Average eiciency value within 5 years
Ranking Name of Bank CRS Value
1 Bank of DKI Sharia 1
1 Bank of Permata Shariah 1
1 Bank of BTN Sharia 1
2 Bank of Kalsel Sharia 0,9454
3 Bank of Riau Sharia 0,9416
4 Bank of Sumut Sharia 0,9152
5 Bank of KalTim Sharia 0,915
6 Bank of Mega Sharia 0,8528
7 Bank of Muamalat 0,7932
8 Bank of Sharia Mandiri 0,739
9 Bank of Sharia Bukopin 0,7328
10 Bank of BRI Sharia 0,6616
In Table 2, the average value of eiciency for each bank within a period of ive years by order from the most eicient level (value 1) to the lowest relatively eicient value (value <1), i.e: irst rank are Bank of Kalsel Sharia, Bank of DKI Sharia, Bank of Permata Sharia, Bank of Sharia Mandiri, Bank of Muamalat, Bank of BTN Sharia; the second rank was Bank of Mega Sharia (0.985); he third rank was Bank of Riau Sharia (0.961); Bank of Sumut Sharia ranked the fourth (0.9356); Bank of KalTim Sharia got the ifth place (0.927), Bank of BRI Sharia ranked the sixth (0.9152), and Bank of Sharia Bukopin ranked the seventh (0,8762).
Table 2. Ranking of average value within 5 years: VRS Output Orientation
Ranking Name of Bank Average Value
1 Bank of KalSel Sharia 1
1 Bank of DKI Sharia 1
1 Bank of Sharia Mandiri 1
1 Bank of Muamalat 1
1 Bank of BTN Sharia 1
2 Bank of Mega Sharia 0,985
3 Bank of Riau Sharia 0,961
4 Bank of Sumut Sharia 0,9356
5 Bank of Kaltim Sharia 0,927
6 Bank of BRI Sharia 0,9152
7 Bank of Sharia Bukopin 0,8762
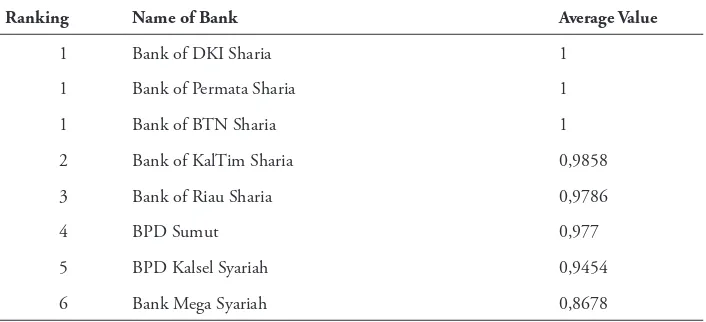
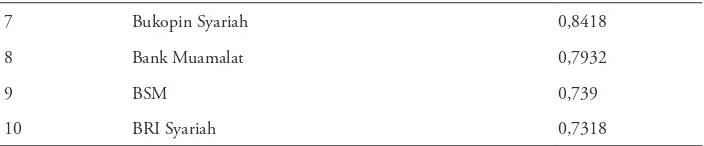
he value of average eiciency for each bank within a period of ive years by order from the most eicient level (Value 1) to the lowest relative eiciency (N <1), were: the irst ranking with full eiciency values (value 1) were: Bank of DKI Sharia, Bank of Permata Sharia, Bank of BTN Sharia; he second ranked by Bank of Kaltim Sharia (0.9858); Bank of Riau Sharia in the third rank (0.9786); fourth-ranked was Bank of Sumut Sharia (0.977); he ifth was Bank of KalSel Sharia (0.9454), the sixth was Bank of Mega Sharia (0.8678), seventh for Bank of Sharia Bukopin (0.8418), eighth rank for Bank of Muamalat (0.7932), the ninth was Bank of Sharia Mandiri (0.739), and the tenth was Bank of BRI Sharia (0.7318), can be seen in more detail in the Table 3.
Table 3. Ranking of average value within 5 years of sharia banking: SE Input Orientation
Ranking Name of Bank Average Value
1 Bank of DKI Sharia 1
1 Bank of Permata Sharia 1
1 Bank of BTN Sharia 1
2 Bank of KalTim Sharia 0,9858
3 Bank of Riau Sharia 0,9786
4 BPD Sumut 0,977
5 BPD Kalsel Syariah 0,9454
7 Bukopin Syariah 0,8418
8 Bank Muamalat 0,7932
9 BSM 0,739
10 BRI Syariah 0,7318
Eiciency Measurement in Malaysia
Based on screening process in order to ilter and gather decent research objects and forming amounts of data base, which are limited to general criteria that data collected must be from bank which operational in recent ive years in range of 2009 to 2013. We found sixteen Islamic banking in Malaysia, as like the Table 4.
Table 4. List of Sharia Banking in Malaysia, 2009-2013
No Name of Bank No. Name of Bank
1 Ain Islamic Bank Berhad 9 Pembangunan Malaysia Berhad
2 Agrobank Islmic Banking 10 Export Import Bank of Malaysia Bhd
3 Al Rajhi Malaysia 11 Hong Leong Islamic Bank
4 Alliance Islamic Bank Berhad 12 KAF Islamic Bank
5 Am Islamic Bank Berhad 13 KFH Malaysia
6 Asian Finance Bank Berhad 14 MIDF Amanah Investment Bank Bhd
7 Bank Kerjasama Rakyat Malaysia Berhad 15 Public Islamic Bank Berhad
8 Bank Muamalat Malaysia Berhad 16 RHB Islamic
13); 1 bank in 2013 (Bank: 3). Based on DEA SE input orientation, ineiciency occurs in: 8 banks in 2009 (Bank: 1, 3, 5, 6, 7, 12, 13, and 16); 6 banks in 2010 (Bank: 3, 4, 5, 6, 8 and 16); 5 banks in 2011 (Bank: 2, 3, 5, 7 and 8); 8 banks in 2012 (Bank: 2, 3, 5, 6, 7, 8, 9, 13 and 16); 4 banks in 2013 (Bank: 3, 5, 7 and 16). For DEA SE Output Orientation, ineiciency occurs in: 8 banks in 2009 (Bank: 1, 3, 5, 6, 7, 12, 13 and 16); 6 banks in 2010 (Bank: 3, 4, 5, 6, 8, and 16); 5 banks in 2011 (Bank: 2, 3, 5, 7 and 8); 8 banks in 2012 (Bank: 2, 3, 5, 6, 7, 13 and 16); 3 banks in 2013 (Bank: 3, 5 and 7).
Eiciency Measurement in Pakistan
Based on screening process in order to ilter and gather decent research objects and forming amounts of data base, which are limited to general criteria that data collected must be from bank which operational in recent ive years in range of 2009 to 2013. We found ive Islamic banking in Pakistan, as like the Table 5.
Table 5. List of Sharia Banking in Pakistan, 2009-2013
No. Name of Bank
1 Ain Islamic Bank Berhad
2 Agrobank Islamic Banking
3 Al Rajhi Malaysia
4 Alliance Islamic Bank Berhad
5 AmIslamic Bank Berhad
Based on DEA CRS, ineiciency occurs in: 2 banks in 2009 (Bank: 1 and 2); 3 banks in 2010 (Bank: 2, 3 and 4); 1 bank in 2011 (Bank 2) and 2012 (Bank 2), this is valid for both input and output orientation. Based on DEA VRS, ineiciency occurs in: 2 banks in 2009 (Bank: 1 and 2); and 1 bank in 2010 (Bank 4). his is applicable for both input and output orientation. Based on DEA SE, ineiciency occurs in: 2 banks in 2009 (Bank: 1 and 2); 3 banks in 2010 (Bank: 2, 3 and 4); 1 bank in 2011 and 2012 (Bank 2). his is valid for both input and output orientation.
Productivity of Islamic Banking
orientation. he results of calculation with this software will generate numbers in some kind of test as an indicator.
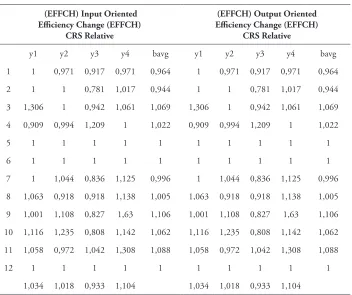
Table 6. Malmquist Index Islamic Bank in Indonesia (EFFCH)
(EFFCH) Input Oriented Eiciency Change (EFFCH)
CRS Relative
(EFFCH) Output Oriented Eiciency Change (EFFCH)
CRS Relative
y1 y2 y3 y4 bavg y1 y2 y3 y4 bavg
1 1 0,971 0,917 0,971 0,964 1 0,971 0,917 0,971 0,964
2 1 1 0,781 1,017 0,944 1 1 0,781 1,017 0,944
3 1,306 1 0,942 1,061 1,069 1,306 1 0,942 1,061 1,069
4 0,909 0,994 1,209 1 1,022 0,909 0,994 1,209 1 1,022
5 1 1 1 1 1 1 1 1 1 1
6 1 1 1 1 1 1 1 1 1 1
7 1 1,044 0,836 1,125 0,996 1 1,044 0,836 1,125 0,996
8 1,063 0,918 0,918 1,138 1,005 1,063 0,918 0,918 1,138 1,005
9 1,001 1,108 0,827 1,63 1,106 1,001 1,108 0,827 1,63 1,106
10 1,116 1,235 0,808 1,142 1,062 1,116 1,235 0,808 1,142 1,062
11 1,058 0,972 1,042 1,308 1,088 1,058 0,972 1,042 1,308 1,088
12 1 1 1 1 1 1 1 1 1 1
1,034 1,018 0,933 1,104 1,034 1,018 0,933 1,104
Islamic Banking Productivity in Indonesia
Table 6 shows the results of input and output orientation on the same value. his is in accordance with the nature of the EFFCH testing itself relative to the CRS models, so the value changes in the input and output will generate the same value scale. EFFCH Table 6 includes the calculation of Malmquist Index EFFCH within the last 5 years. Measurement starts from the previous year, so the value in row y1 is the result of the second year relative to the irst year, and so on.
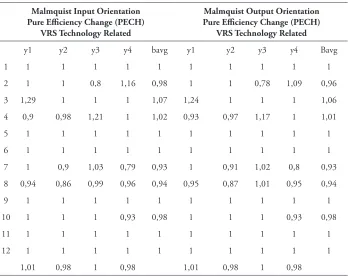
Index PECH within the last 5 years. Measurement starts from the previous year, so the value in line y1 is the result of the second year relative to the irst year, and so on.
Table 7. Malmquist Index of Islamic Banking in Indonesia (PECH)
Malmquist Input Orientation Pure Eiciency Change (PECH)
VRS Technology Related
Malmquist Output Orientation Pure Eiciency Change (PECH)
VRS Technology Related
y1 y2 y3 y4 bavg y1 y2 y3 y4 Bavg
1 1 1 1 1 1 1 1 1 1 1
2 1 1 0,8 1,16 0,98 1 1 0,78 1,09 0,96
3 1,29 1 1 1 1,07 1,24 1 1 1 1,06
4 0,9 0,98 1,21 1 1,02 0,93 0,97 1,17 1 1,01
5 1 1 1 1 1 1 1 1 1 1
6 1 1 1 1 1 1 1 1 1 1
7 1 0,9 1,03 0,79 0,93 1 0,91 1,02 0,8 0,93
8 0,94 0,86 0,99 0,96 0,94 0,95 0,87 1,01 0,95 0,94
9 1 1 1 1 1 1 1 1 1 1
10 1 1 1 0,93 0,98 1 1 1 0,93 0,98
11 1 1 1 1 1 1 1 1 1 1
12 1 1 1 1 1 1 1 1 1 1
1,01 0,98 1 0,98 1,01 0,98 1 0,98
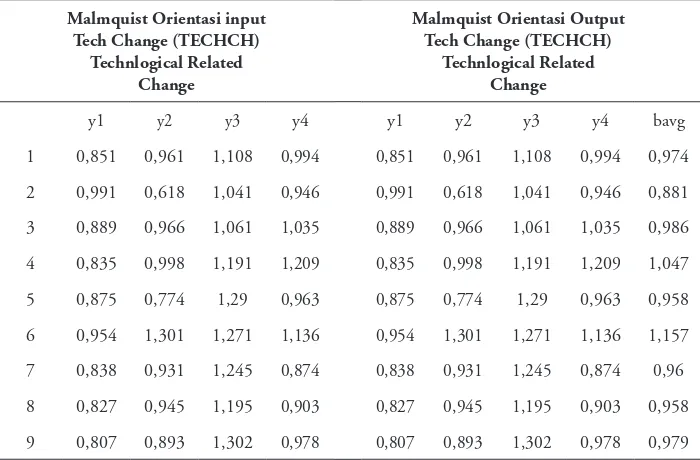
SECH Table 8 shows results of the input and output orientation producing diferent values, it is in accordance with the nature of the SECH testing itself relative to the SE model, Scale Eiciency namely CRS / VRS scale, so the value changes in the input and output will generate diferent scale value, he table includes the calculation of Malmquist Index SECH within the last 5 years. Measurement starts from the previous year, so the value in the line y1 is the result of the second year relative to the irst year, and so on.
Islamic Banking Productivity in Malaysia
Output Orientation
For techch: 7 banks increased in the irst year (Bank: 1, 2, 3, 5, 6, 9 and 12); 5 banks have increased in the second year (Bank: 3, 5, 9, 13 and 15); 12 banks had increased in the third year (Bank: 1, 2, 3, 4, 5, 6, 7, 8, 9, 13, 15 and 16); 3 banks increased in the fourth year (Bank: 2, 4 and 16). For tfpch: 8 banks increased in the irst year (Bank: 1, 2, 3, 5, 6, 9, 12 and 16); 8 banks increased in the second year (Bank: 3, 4, 5, 6, 9, 13, 15 and 16); 9 banks experienced an increase in the third year (Bank: 1, 2, 3, 4, 8, 9, 13, 15 and 16); 8 banks increased in the fourth year (Bank: 1, 2, 3, 4, 6, 12, 13 and 16). For efch: 7 banks increased in the irst year (Bank: 1, 3, 6, 7, 12, 13, and 16); 5 banks increased in the second year (Bank: 3, 4, 6 and 16); there are no banks that have increased in the third year; 7 banks increased in the fourth year (Bank: 1, 3, 5, 6, 12, 13 and 16). For Pech: 5 banks increased in the irst year (Bank: 1, 3, 12, 13 and 16); 1 bank has increased in the second year (Bank 3); 1 bank has increased in the third year (Bank 2); 5 banks have increased in the fourth year (Bank: 1, 3, 12, 13 and 16). For Sech: 5 banks have increased in the irst year (Bank: 1, 6, 7, 12 and 13); 5 banks have increased in the second year (Bank: 3, 4, 5, 6, and 16); 1 bank has increased in the third year (Bank: 3); 7 banks increased in the fourth year (Bank: 1, 3, 5, 6, 12, 13 and 16).
Table 8. Malmquist Index of Islamic Banking in Indonesia (TECHCH)
Malmquist Orientasi input Tech Change (TECHCH)
Technlogical Related Change
Malmquist Orientasi Output Tech Change (TECHCH)
Technlogical Related Change
y1 y2 y3 y4 y1 y2 y3 y4 bavg
1 0,851 0,961 1,108 0,994 0,851 0,961 1,108 0,994 0,974
2 0,991 0,618 1,041 0,946 0,991 0,618 1,041 0,946 0,881
3 0,889 0,966 1,061 1,035 0,889 0,966 1,061 1,035 0,986
4 0,835 0,998 1,191 1,209 0,835 0,998 1,191 1,209 1,047
5 0,875 0,774 1,29 0,963 0,875 0,774 1,29 0,963 0,958
6 0,954 1,301 1,271 1,136 0,954 1,301 1,271 1,136 1,157
7 0,838 0,931 1,245 0,874 0,838 0,931 1,245 0,874 0,96
8 0,827 0,945 1,195 0,903 0,827 0,945 1,195 0,903 0,958
10 0,982 0,731 1,18 1,021 0,982 0,731 1,18 1,021 0,964
11 0,883 0,951 1,082 1,015 0,883 0,951 1,082 1,015 0,98
12 0,566 0,953 0,911 0,885 0,566 0,953 0,911 0,885 0,812
avg 0,851 0,904 1,151 0,992 0,851 0,904 1,151 0,992
Input Orientation
For techch: 7 banks increased in the irst year (Bank: 1, 2, 3, 5, 6, 9, and 12); 5 banks have increased in the second year (Bank: 3, 5, 9, 13 and 15); 12 banks had increased in the third year (Except: 10, 11, 12 and 14); 3 banks increased in the fourth year (Bank: 4, 12 and 15). For tfpch: 8 banks increased in the irst year (Bank: 1, 2, 3, 5, 6, 9, 12, and 16); 8 banks increased in the second year (Bank: 3, 4, 5, 6, 9, 13, 15, 16); 8 banks experienced an increase in the third year (Bank: 1,2,3,4,8,9,13 and 16); 6 banks increased in the fourth year (Bank: 3, 4, 5, 8, 12 and 15). For efch: 7 banks increased in the irst year (Bank: 1, 3, 6, 7, 12, 13, and 16); 5 banks have increased in the second year (Bank: 3, 4, 5, 6 and 16); No bank has increased in the third year; 7 banks increased in the fourth year (Bank: 1, 3, 5, 6, 12, 13, 16). For
Pech: 5 banks have increased in the irst year (Bank: 1, 3, 12, 13 and 16); 1 bank has increased in the second year (Bank: 3); 1 bank has increased in the third year (the Bank: 1); 3 banks increased in the fourth year (Bank: 2, 3 and 13). For Sech: 5 banks have increased in the irst year (Bank: 1, 6, 7, 12 and 13); 5 banks have increased in the second year (Bank: 3, 4, 5, 6 and 16); No bank has increased in the third year; 8 banks increased in the fourth year (Bank: 2, 3, 5, 6, 7, 8, 13, and 16).
Islamic Banking Productivity in Pakistan
For techch: 5 banks have increased in the irst year (All banks); 1 bank has increased in the second year (Bank 2); 3 banks increased in the third year (Bank: 1, 2 and 3); 4 banks have increased in the fourth year (Bank: 1, 2, 3 and 5). (Valid for both input and output orientation). For tfpch: 4 banks increased in the irst year (Bank: 1, 2, 4 and 5); 3 banks increased in the second year (Bank: 2, 3 and 4); 3 banks increased in the third year (Bank: 1, 2 and 3); 4 pneingkatan bank experienced in the third year (Bank: 1, 2, 3 and 4). (Valid for both input and output orientation).
has increased in the second year (Bank 4); No bank has increased in the third and fourth year. (Valid for both input and output orientation). For Sech: 1 bank has increased in the irst year (Bank 1); 2 banks increased in the second year (Bank: 3 and 4); 1 bank increase in the third and fourth year (Bank: 1 and 2). (Valid for both input and output orientation).
Conclusion
he most important part is the fact that many of them have experienced ineicient condition. For instance, Islamic Banking Industry in Indonesia is facing ineiciency that shown by ive years average that is not reach 100% eiciency rate. However, Indonesia in the fair condition because Indonesia lies on the 75%+ category that range around 87%-97% eiciency rate. he ineiciency usually caused by external factors not in the managerial factors. In the internal factors, we ind that input orientation and output has no signiicance diferent. It shown the optimization aspects in the eiciency and expansion of output. In the productivity aspects, we ind an increasing growth trend for the last four years, we believe it caused by managerial factors rather than technology factors that could improve eiciency in banking industry.
Malaysia also experiences the problem of ineiciency but the condition is better compared to Indonesia. In ive years, the eiciency rate of Malaysia Islamic Bank has not reach 100% eiciency rate. However, Malaysia reach a very good condition of eiciency that lies on the 90%+ range (Approximately 92%-95%).
Similar to Indonesia, the causes of ineiciency are from external factors. Good indicators in input and output shows that Malaysia Islamic Bank reach optimal level in the eiciency of input and also the output expansion. In the productivity aspects, despite of positive and luctuate trend happened for the last four years, the current condition shows the likelihood of negative growth of productivity for Malaysia Islamic Bank that cause by technological aspects.
Pakistan among the closest country that could reach an eicient rate level for their Islamic banks. Pakistan close to reach 100% eicient rate within the last ive years. hey obtain the range 99.3%-100% eicient rate. he good indicators shown in the input and output aspects of the Islamic Bank that depict the cost eiciency and in input also the output expansion. In the productivity aspects, positive trend shown and shown the increasing pattern that cause by technology advancement in inancial sectors and also the good governance in managerial sectors.
(RoE), and other similar inancial proitability ratio. Also, macroeconomic variable as GDP and Inlation. In addition, diferent method for similar study might triangulate the result of our study by using the methods like SFA or regression analysis using ANOVA.
he implications of this study can be used as a reference and the development of literacy in Islamic inance, encourage related institutions, universities, education ministries, regulators such as Bank of Indonesia and the FSA and the inancial industry to facilitate quality inancing research in the ield of Islamic inance, facilitation of writing and publication of international standardized scientiic papers. For that it is necessary to develop synergies and cooperation between elements or stakeholders in supporting the development of scientiic works in this ield. It is expected the potential scientiic work in the ield of Islamic banking and inance in Indonesia in its various aspects can be recognized by the academic community at the international level.
Referrences
Ahmed, U. et.al. (2009). Eiciency Dynamics and Financial Reforms: Case Study of Pakistani Banks. International Research Journal of Finance and Economics, 25: 172-182.
Berger, A.N. et.al. (2007). Bank Ownership and Eiciency in China: What Lies Ahead in he World`s Largest Nation? Bank of Finland Research Discussion Papers 16.
Ellahi, N. (2011). Testing Technical and Cost Eiciency of Pakistani Islamic Banking System, “ 8th International Conference on Islamic Economics and Finance. Qatar
Faculty of Islamic Studies.
Hassan, M.K. (2006). he X-Eiciency in Islamic Banks. Islamic Economic Studies, 13 (2): 49-78.
Hossen, M.N. & R. Rahmawati. (2016). Eiciency and Proitability on Indonesian Islamic Banking Industry. Al-Iqtishad: Jurnal Ilmu Ekonomi Syariah (Journal of Islamic Economics), 8 (1): 33-48.
Indrawati. Y. (2009). Analisis Eisiensi Bank Umum di Indonesia Periode 2004 – 2007: Aplikasi Metode Data Envelopment Analysis (DEA). (Unpublished hesis). Depok: Universitas Indonesia.
Luciano, E. & L. Regis. (2007). Bank Eiciency and Banking Sector Development: the Case of Italy. ICER Working Paper.
Mediadianto, A. (2007), Eisiensi Bank Syariah dan Bank Konvensional dengan Metode DEA. (Unpublished hesis). Depok: Universitas Indonesia.
Mghaieth, A. & I.K. El Mehdi. (2014). he Determinants of Cost/Proit Eiciency of Islamic Banks Before, During, and After he Crisisi of 2007-2008 using SFA Approach. (Working Paper). IPAG Business School.
Mohamad, S. et.al. (2008). Eiciency of Conventional versus Islamic Banks: International Evidence using the Stochastic Frontier Approach (SFA). Journal of Islamic Economics, Banking and Finance. 107-130.
Setiawan. I. (2007). Analisa Perbankan Indonesia dengan Menggunakan Metode Data Envelopment Analasis Studi Kasus 25 Bank dengan DPK Terbesar Tahun 2001 – 2005. (Unpublished hesis). Depok: Universitas Indonesia. Suian, F. (2007). Malmquist Indices of Productivity Change In Malaysian Islamic
Banking Industry: Foreign Versus Domestic Banks. Journal of Economic Cooperation, 28 (1): 115-150.